Project 07: Curves

This project was a really fun experience with using different curves to simulate weather, along with arrays and shifting elements in the array. It was difficult to actually get the weather to move the way I wanted it to but I’m still unhappy with how some of the rain function works. It took a bit to get the curves working but from there it wasn’t too hard to get the grids working the way I wanted, although there were some pretty funny interactions with the direction and speed with which the curves moved and fell.

weather

var nPoints = 100
var curveX = []
var curveY = []
var numCurves;


function setup() {
    createCanvas(480, 480);
}


function draw() {
	numCurves = width
	for (y = 0; y < width; y += 40){ ////sends data to arrays to translate for curves
    for (x = 0; x < height; x += 40){
            curveY.push(y)
            curveX.push(x)
        }
    }
	background(0, 0, 255, 4)
	if (mouseIsPressed) { ///changes curve and color when mouse is held down
		rain()
	} else {
	    wind()
	}
}

function drawGrid() { ///establishes moving pattern of neiods for the rain() function
curveX.shift()
curveY.shift()
for(n = 0; n <= numCurves; n++){
	translate(curveX[n], curveY[n])
	drawNeoid()
}
}


function drawSecond() {  ///establishes moving pattern of curves for the wind() function
curveX.shift()
curveY.shift()
for(k = 0; k <= numCurves; k++){
	translate(curveX[k], curveY[k])
	drawLituus()
    }
}
function drawNeoid() { ///draws a neiod curve based on the mouse location
	var x
	var y
	var r
	var a = mouseX / 10
	var b = mouseY / 5
	beginShape()
	   for (var i = 0; i < nPoints; i++) {
            var t = map(i, 0, nPoints, 0, TWO_PI); ///converts to terms of pi
            r = (a * t) + b ////neiod formula
            x = r * cos(t)
            y = r * sin(t)
            vertex(x, y)
        }
    endShape()        
}

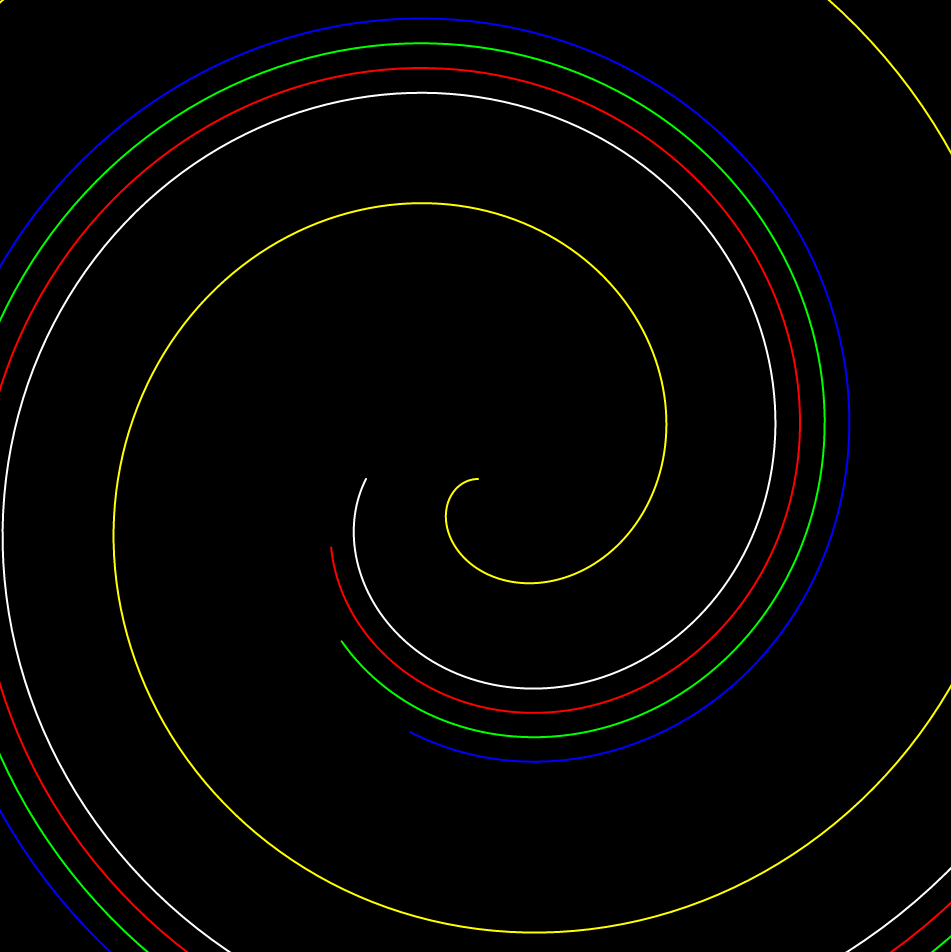
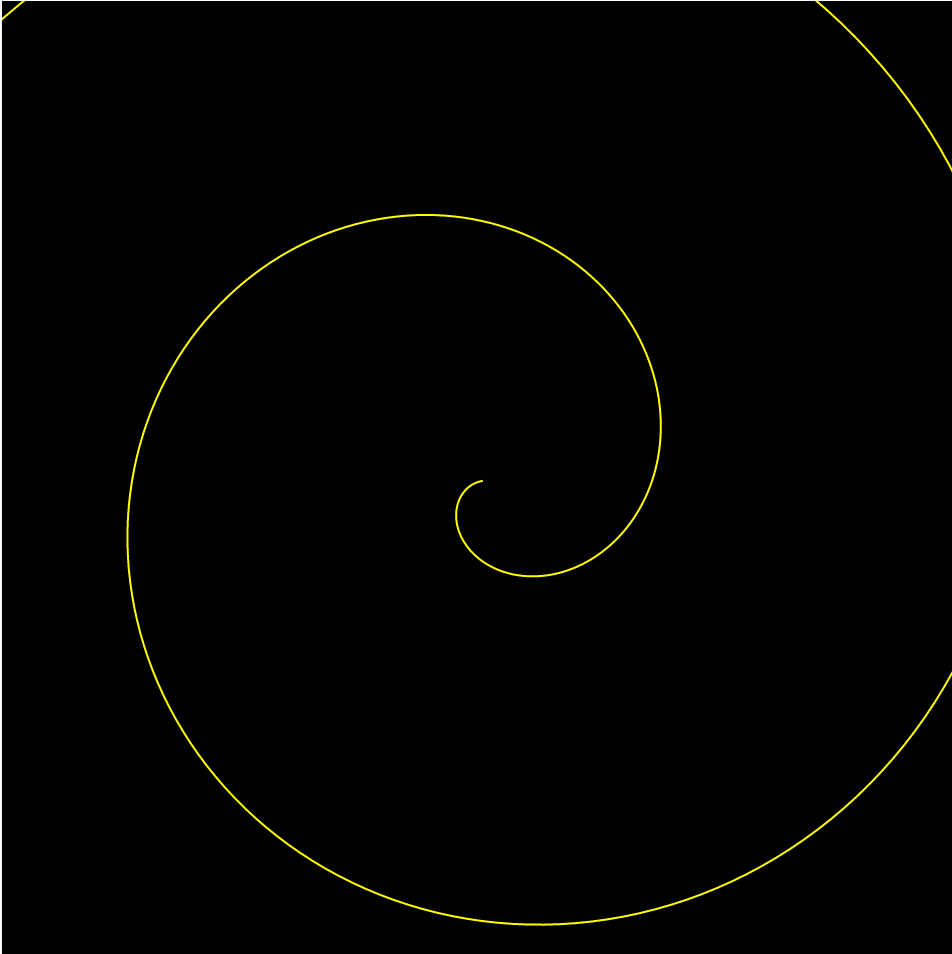
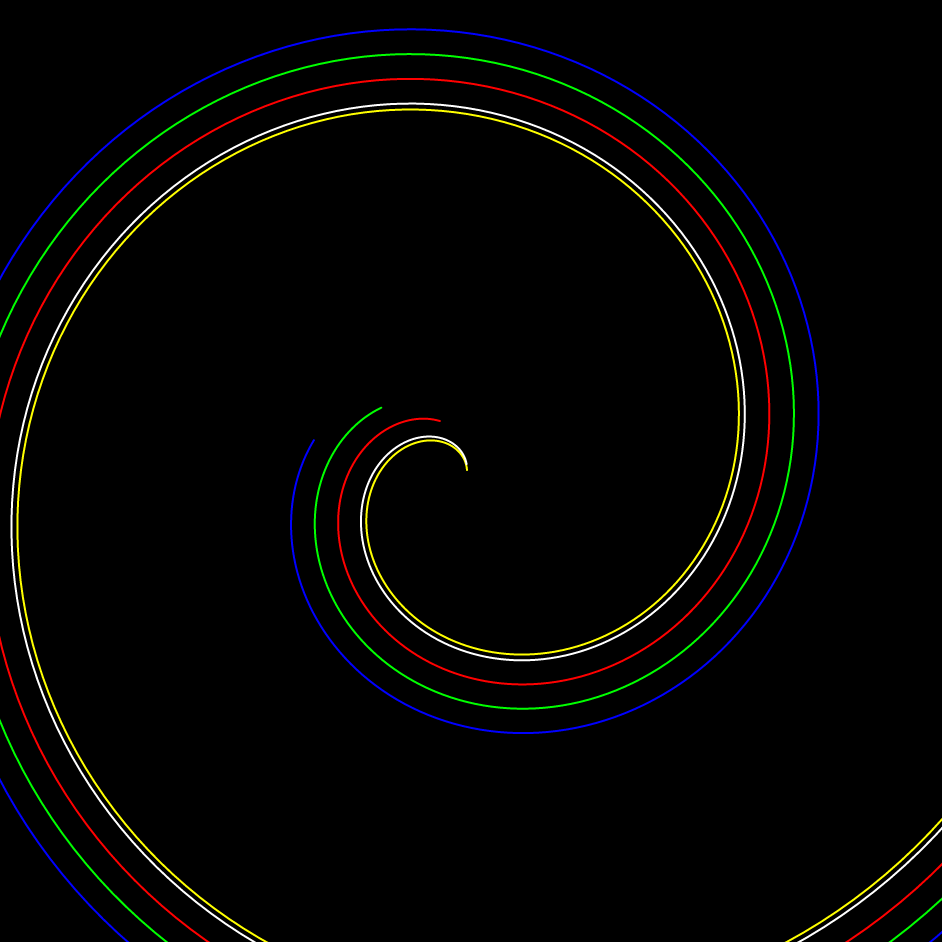
function drawLituus() { ///draws a lituus curve based on the mouse location, similar process to drawNeiod() with a different formula
    var x
	var y
	var r
	var a = (mouseX / 10) + (mouseY / 5)
	beginShape()
	   for (var i = 0; i < nPoints; i++) {
            var t = map(i, 0, nPoints, 0, TWO_PI);
            r = sqrt(sq(a) / t) ///lituus formula in terms of r
            x = r * cos(t)
            y = r * sin(t)
            vertex(x, y)
        }
    endShape()
}

function rain(){ ///draws a pattern of blue neiods like rain
	drawGrid()
	stroke(0, 0, 255)
	background(236, 236, 236, 4)
}

function wind(){ ////draws white lituuses like wind
	drawSecond()
	stroke(255, 255, 255)
	}

Project7_curves

sketch_curvesDownload
	// Huijun Shen  session D
    // huijuns@andrew.cmu.edu


var nPoints = 100;
//var lineGroup = [];


function setup() {
    createCanvas(400,400);
    background(180);
    frameRate(10);  
    
}


function draw() {
    background(150);
    noStroke();
    push();
    translate(width/2,height/2);
    rotate(mouseX/30); // make it rotate according to x position
    Orthotomic();
    pop();
    
} 

function Orthotomic(){ //draw the shape

    var x;
    var y;  
    noFill();
    fill(255-mouseY*0.3,mouseY*0.2,100); // make color related to y position
    stroke(3);
   
    beginShape(); // the shape
    for (var i = 0; i < nPoints; i++) {
        var t = map(i, 0, nPoints, 0, TWO_PI);
        x = constrain(mouseX,0,400)/30*cos(t);
        y = sin(t);
        var x1 =20*(x*cos(2*t)-y*sin(2*t)+2*sin(t));
        var y1 =20*(-x * sin(2*t) - y*cos(2*t) + 2*cos(t));
        vertex(x1+random(5), y1+random(5)); //make the edge a bit random lines
    }


    endShape(CLOSE);    
   
    
}

Project 07: Composition with Curves

My process to create this project began with doing research on various geometric curves. Once I found the Conchoid of de Sluze, I found that it had this unique directional quality and, if translated to the middle of the canvas, neatly divided it in half. After making the curve flip based on the x-position of the mouse, I decided to make the bulge of the curve responsive to the y-position of the mouse. Then, I would draw another curve ( a cardiod cartacaustic) with a flashing background in the half of the canvas the Conchoid of de Sluze was not occupying. In this way, the Conchoid of de Sluze was acting as a revealing element. Afterwards, to add some visual interest, I added a random function to the vertexes of each curve to create a jittery animated effect.

Project 7 – CurvesDownload


function setup() {
    createCanvas(480, 480);
    background(220);
    text("p5.js vers 0.9.0 test.", 10, 15);
}

function draw() {
	background(0);
	if (mouseX >= width/2){
		noStroke();
		fill(random(200,255),random(100,255),0);
		rect(0,0,width/2,height);
		push();
		translate(width/4,height/2);
		//rotate(radians(45));
		cardioidCatacaustic();
		pop();
	} else {
		noStroke();
		fill(random(100,255),0,random(200,255));
		rect(width/2,0,width/2,height);
		push();
		translate(3*width/4,height/2);
		rotate(radians(180));
		cardioidCatacaustic();
		pop();
	}
	push();
	translate(width/2,height/2);
	conchoid();
	pop();
}

function conchoid() {
	//https://mathworld.wolfram.com/ConchoidofdeSluze.html
	var x;
	var y;
	var r;
	var a = constrain(mouseY,10,240);
	fill("red");
	beginShape();
	for(var i = 0; i < 200; i++){
		var t = map(i,0,200,-PI,3*PI);
		if(mouseX <= width/2){
			r = -(1/cos(t) + a*cos(t));
		} else{
			r = (1/cos(t) + a*cos(t));
		}
		x = r*cos(t);
		y = r*sin(t);
		vertex(x + random(-2,2),y + random(-2,2));
	}
	endShape();
}

function cardioidCatacaustic() {
	https://mathworld.wolfram.com/CardioidCatacaustic.html
	var x;
	var y;
	var xe;
	var ye;
	var strokeVal =.2;
	var a = 60;
	noFill();
	stroke(0);
	strokeWeight(strokeVal);
	beginShape();
	for(var i = 0; i < 200; i++){
		var t = map(i,0,200,-PI,PI);
		x = a*(1 + cos(t))*cos(t);
		y = -a*(1 + cos(t))*sin(t);
		vertex(x + random(-2,2),y + random(-2,2));
	}
	endShape(CLOSE);
}

Project 7

After exploring the variety of equations on the MathWorld site, I decided to use a heart curve to create peaches. My peaches are inspired by Japanese peaches, and they change color and size based on mouseX.

peaches
Japanese peach
function setup() {
    createCanvas(480, 480);
}

function draw() {
    background(150, 240, 210); //mint background
    //4 peaches
    for (var x = 140; x <= width; x += 200) {
        for (var y = 140;y <= height; y+= 200) {
        push();
        leaf(x, y);
        pop();
        push();
        translate(x, y);
        peach();
        pop();
        }
    }
}
function leaf(x, y){
    push();
    stroke(35, 153, 139);
    strokeWeight(2);
    strokeCap(SQUARE);
    fill(50, 200, 180);
    arc(x+15, y+15, 70, 40, PI/4, PI + PI/3, OPEN);
      //arc(width/220 - 25, height/2, 40, 40, PI-PI/3, , OPEN);
    pop();
  
}
function peach(){
    var colorshift = constrain(mouseX, 5, 50);
    fill(255, 180- colorshift/4, 120+colorshift/2);// peach become redder based on mouseX
    stroke(250, 250, 250); //offwhite outline
    scale(2.5);//no need to rotate peach shape
    beginShape();
    for (var i = 0; i < 2*PI; i+=0.1) {
        var mx = constrain(mouseX/300, 0.7, 1.2); //mouseX multiplier
        var x = mx*20*pow(sin(i),3);
        var y = mx*20*cos(i)-4*cos(2*i)-2*cos(3*i);
        vertex(x,y); 
    }
    endShape();
}

PROJECT-07 (curves)

sketch
// SEAN CHEN
// 15-104 A

var nPoints = 100;
var tx = []; // keeping track of the x y of each hypotrochoid
var ty = [];
var rot = 0; // rot init
var size = []; // each size
var col = []; // each color

function setup() {
    createCanvas(480, 480);
    background(255);
}

function distance() { // distance from center to mouse
    var d = dist(width/2, height/2, mouseX, mouseY);
    return d;
}

function hypotrochoid(a, col) {
    push();
    fill(col);
    var x, y, a, b, t;
    b = a / int(map(distance(), 0, width/2, 1, a));
    stroke(0);
    rotate(radians(rot));
    beginShape();
    for (var i = 0; i < nPoints; i++) {
        t = map(i, 0, nPoints, 0, TWO_PI);
        x = (a - b) * cos(t) - b * cos((a-b) / b * t);
        y = (a - b) * sin(t) + b * sin((a-b) / b * t);
        vertex(random(3)+x, random(3)+y);
    }
    endShape(CLOSE);
    pop();
}

function draw() {
    background(255);
    rect(0, 0, 480, 480);
    push();
    translate(width/2, height/2); // initial hypotrochoid
    hypotrochoid(120, color(245,211,114));
    pop();
    for (var i = 0; i < tx.length; i++) { // added hypotrochoid
        push();
        translate(tx[i], ty[i]);
        hypotrochoid(size[i], col[i]);
        pop();
    }
    rot += 1;
    text("click to add!", 10, 20);
}

function mouseClicked() { // add new hypotrochoid
    tx.push(mouseX); // input new at mouseXY
    ty.push(mouseY);
    size.push(random(50, 200));
    col.push(color(random(255),211,114));
    if (tx.length > 12) { // delete after 12
        tx.shift();
        ty.shift();
        size.shift();
        col.shift();
    }
}

Project 7 – Interactive Curve

sketch
//hollyl
//composition with curves
//section D
var nPoints = 150;

function setup(){
	createCanvas(480, 480);
}

function drawCartiod(){
	var x;
	var y;

	var a = 15;
	var b = a/2;
	var h = constrain(mouseY/50, 0, b);
	var ph = mouseX/50;

	fill(200, 255, 200);
	beginShape();
	for(var i=0; i<nPoints; i++){
		var t=map(i, 0, nPoints, 0, TWO_PI);

		x = (a+b)*cos(t) * (h-cos(ph+t*(a+b)/b));
		y = (a+b)*sin(t) * (h-cos(ph+t*(a+b)/b));
		vertex(x, y);
	}
	endShape(CLOSE);
}

function draw(){
	background(255);
	push();
	translate(width/2, height/2);
	drawCartiod();
	pop();
}


I really enjoyed the examples for this project, as they were very soothing to play with, so I decided to create a form that I enjoyed the most. I played around with epicycliod forms in desmos until I landed on one that I enjoyed that coded it.

Project 7 – Curves

For this project, I decided to create a psychedelic display of colors and lines. I played around with Epitrochoid Curves and created two different circular displays. This resulted in a busy display of lines and curves that almost seemed 3d. I took a screenshot of my favorite shape, which looked like a cell underneath a microscope.

sketchDownload
//Se A Kim
//seak
//Section D

var nPoints = 300;
var angle = 100;

function setup() {
    createCanvas(480, 480);
}

function draw() {
    background(0);
    translate(width/2, height/2);
    rotate(mouseX/20);
    drawEpitrochoidCurve1();
    drawEpitrochoidCurve2();
}
    //Draw Epitrochoid 1
function drawEpitrochoidCurve1() {
    var a = map(mouseX, 0, 480, 0, 100); 
    var b = map(mouseY, 0, 480, 0, 50); 
    var c = map(mouseY, 0, 480, 0, 50); 
    strokeWeight(1);
    stroke(200, 255, 226);
    fill(200, 100, 109); 

    beginShape(); 
    for (var i=0; i<nPoints; i++) {
        var angle = map(i, 0, 20, 0, PI);
        x = (a) * cos(angle) - c * cos((a+b) * angle);
        y = (b) * sin(angle) - c * sin((a+b) * angle);
        vertex(x, y);
    }
    endShape();
}

    //Draw Epitrochoid 2
function drawEpitrochoidCurve2() {
    var a = map(mouseX, 0, 1000, 0, 10); 
    var b = map(mouseY, 0, 1000, 0, 50); 
    var c = map(mouseX, 0, 1000, 0, 50); 
    strokeWeight(1);
    stroke(200, 20, 226);
    fill(100, 10, 120); 

    beginShape(); 
    for (var i=0; i<nPoints; i++) {
        var angle = map(i, 0, 20, 0, PI);
        x = (b) * cos(angle) - c * cos((a+b) * angle);
        y = (a) * sin(angle) - c * sin((a+b) * angle);
        vertex(x, y);
    }
    endShape();
}
A screen capture of my favorite shape

Project 7 – Composition with Curves

it’s an avocadooooooooo… thaaaaanksss…

sketch
var nPoints = 100;

function setup() {
    createCanvas(300, 480);
    background(220);
    text("p5.js vers 0.9.0 test.", 10, 15);
    frameRate(10);
}

function draw() {
    background(198, 179, 220);
    //Avocado
    push();
    translate(width * 0.6, height * 0.5);
    rotate(radians(30));
    cranoidCurve();
    pop();
    //Avocado face
    face();
    //Avocado pit
    moon();
    //Stars move with mouse
    push();
    translate(mouseX - 200, 30);
    star();
    pop();
    push();
    translate(100, mouseY + 80);
    scale(0.5);
    star();
    pop();
}

function cranoidCurve() {
    var x;
    var y;
    var r;
    var a = 40;
    var b = 60;
    var c = 70;
    var p = constrain((mouseX / width), 0, 1);
    var q = constrain((mouseY / height), 0, 1);
    stroke(77, 135, 2);
    strokeWeight(10);
    fill(195, 238, 139);
    beginShape();
    for(var i = 0; i < nPoints; i++) {
        var t = map(i, 0, nPoints, 0, TWO_PI);
        r = a * sin(t) +
            b * sqrt(1 - p * sq(cos(t))) +
            c * sqrt(1 - q * sq(cos(t)));
        x = r * cos(t);
        y = r * sin(t);
        vertex(x, y);
    }
    endShape(CLOSE);
}

function face() {
    noFill();
    stroke(0);
    strokeWeight(2);
    arc(200, 190, 5, 5, radians(210), radians(30));
    arc(220, 200, 5, 5, radians(210), radians(30));
    arc(205, 210, 10, 10, radians(50), radians(190));
}

function moon() {
    //Moon/Avocado pit gets bigger as x increases with mouse
    var x = max(min(100 + mouseX, width), 10);
    var sizeX = x * 3 / 10;
    var r = 300 - mouseX;
    var g = 300 - mouseX;
    var b = 30;
    noStroke();
    fill(r, g, b);
    circle(mouseX - 100, mouseY - 30, sizeX);
}

function star() {
    fill(240, 255, 135);
    frameRate(10);
    var x = [50, 61, 83, 69, 71, 50, 29, 31, 17, 39];
    var y = [18, 37, 43, 60, 82, 73, 82, 60, 43, 37];
    var nPoints = x.length;
    beginShape();
    //Squiggly star
    for (var i = 0; i < nPoints; i++) {
        vertex (x[i] + random(-3, 3), y[i] + random(-3, 3));
    }
    endShape(CLOSE);
}

While exploring different types of curves, I was inspired by the cranioid curve, which strongly resembles an avocado shape when interacted with.

Project 7: Curves

For project 7, I chose to use a logarithmic spiral to create a series of spirals that interact with the mouse position. I was inspired to do logarithmic spirals by some shells I have in a jar on my desk. Then, I wanted to do something that is colored differently than my previous projects.

screen capture of my program

The spiral’s distance from the center increases or decreases relative to the mouse x position while the degree from the center changes relative to Y depending on the Y position.

sketch

//Helen Cheng
//helenc1@andrew.cmu.edu
//Section C
//Project-07

var theta;
var r;
var nPoints = 500;

function setup() {
  createCanvas(480, 480);
  angleMode(DEGREES);
}

function draw() {
  background(0);
  startAngle = constrain(mouseY, 10,360);
  //parallel spirals
  stroke(255,255,0);
  logSpiral(0,startAngle);
  stroke(255,255,255)
  logSpiral(mouseX, startAngle);
  stroke(255,0,0)
  logSpiral(mouseX+25, startAngle+25);
  stroke(0,255,0)
  logSpiral(mouseX+50, startAngle+50);
  stroke(0,0,255)
  logSpiral(mouseX+75, startAngle+75);

}

function logSpiral(r, theta, color) {
  var x;
  var y;
  noFill();
  beginShape();
  //populates points on each of the spirals
  for (i=0; i<nPoints; i++) {
    x = 240+(r+i)*-cos(theta+2*i);
    y = 240+(r+i)*sin(theta+2*i);
    vertex(x, y);
  }
  endShape();
}

Project 07

curvy curves
var x;
var y;
var spread; // how far each bean is from one another	
var a; // scales the size of individual beans


function setup() {
    createCanvas(480, 480);
}

function draw() {
    background(0, 30, 50);	
	translate(width/2, height/2);
	push();
	for(var i = 0; i <= 24; i ++){
		beanWO();
		rotate(radians(15));
	} 
	pop();
    // arrangement of 24 beanWO functions 

	push();
    for(var j = 0; j <= 12; j++){ 
    	beanF();
    	rotate(radians(30));
    }
    pop();
    // arrangement of 12 beanF functions

    push();
    for(var k = 0; k <= 36; k++){
        beanScrib(); 
        rotate(radians(mouseX));	
    }
    pop();
    // arrangement of 36 scribble-like shapes that rotate based on the X position of the mouse

    push();
    for(var m = 0; m <= 3; m ++){
    	beanVar();
    	rotate(radians(120));
    }
    pop();
    // draws function beanVar in the middle of the canvas
} 


function beanWO(){ 
// draws beans with white outlines that move toward and away from the origin based on mouseX
    push();
    a = 100
    spread = mouseX/5;
	stroke(255);
	noFill();
	beginShape();
	for(var theta = 0; theta <= TWO_PI; theta += radians(1)){
        x = a * cos(theta) * (pow(sin(theta), 3) + pow(cos(theta), 3)) + spread; // 
        y = a * sin(theta) * (pow(sin(theta), 3) + pow(cos(theta), 3)) + spread; // y parameter of bean curve
        vertex(x, y)
	}
	endShape();
	pop();
}

function beanF(){ 
// draws translucent beans whose colors change with mouseY
	push();
	a = 200;
	spread = -mouseX/5; 
	var r = map(mouseY, 0, 480, 0, 255);
	noStroke();
	fill(r, 255, 231, 40);
	beginShape();
	for(var theta = 0; theta <= TWO_PI; theta += radians(1)){
        x = a * cos(theta) * (pow(sin(theta), 3) + pow(cos(theta), 3)) + spread; // x paremeter of bean curve
        y = a * sin(theta) * (pow(sin(theta), 3) + pow(cos(theta), 3)) + spread; // y parameter of bean curve
        vertex(x, y)
	}
	endShape();
	pop();	
}

function beanScrib(){ 
// draws a variation of the bean function that looks like a scribble
	push();
	a = mouseY;
	spread = mouseY/12
	noFill();
	stroke(214, 197, 255, 40);
	strokeWeight(3);
	beginShape();
	for(var theta = 0; theta <= radians(180); theta += radians(1)){
        x = a * cos(theta * .5) * (pow(sin(theta * .6), 3) + pow(cos(theta), 3)) + spread; 
        y = a * sin(theta * .5) * (pow(sin(theta * .6), 3) + pow(cos(theta), 3)) + spread; 
        vertex(x, y)
	}
	endShape();
	pop();	
}

function beanVar(){ 
// draws a variation of the bean function that changes with mouseY
	push();
	a = 50
	var b = map(mouseY, 0, height, 0, 5) // modifies an angle in the function with mouseY
	noFill();
	stroke(146, 255, 205);
	strokeWeight(5);
	beginShape();
	for(var theta = 0; theta <= radians(180); theta += radians(1)){
        x = a * cos(theta) * (pow(sin(theta * b), 3) + pow(cos(theta), 3));  
        y = a * sin(theta) * (pow(sin(theta * b), 3) + pow(cos(theta), 3)); 
        vertex(x, y)
	}
	endShape();
	pop();

}

For this project, I chose to explore the properties of the “Bean Curve,” essentially a curve shaped like a bean. After figuring out how to use the parametric equations, I experimented with implementing a series of beans that were arranged in a concentric shape and moved further apart with mouseX. From there, I tried plugging in different variables into this function to see what kinds of compositions I could create with different parameters.