Project-07-Butterfly Curve

sketchsl07.Download
// Sarah Luongo   
// sluongo
// sluongo@andrew.cmu.edu
// Project

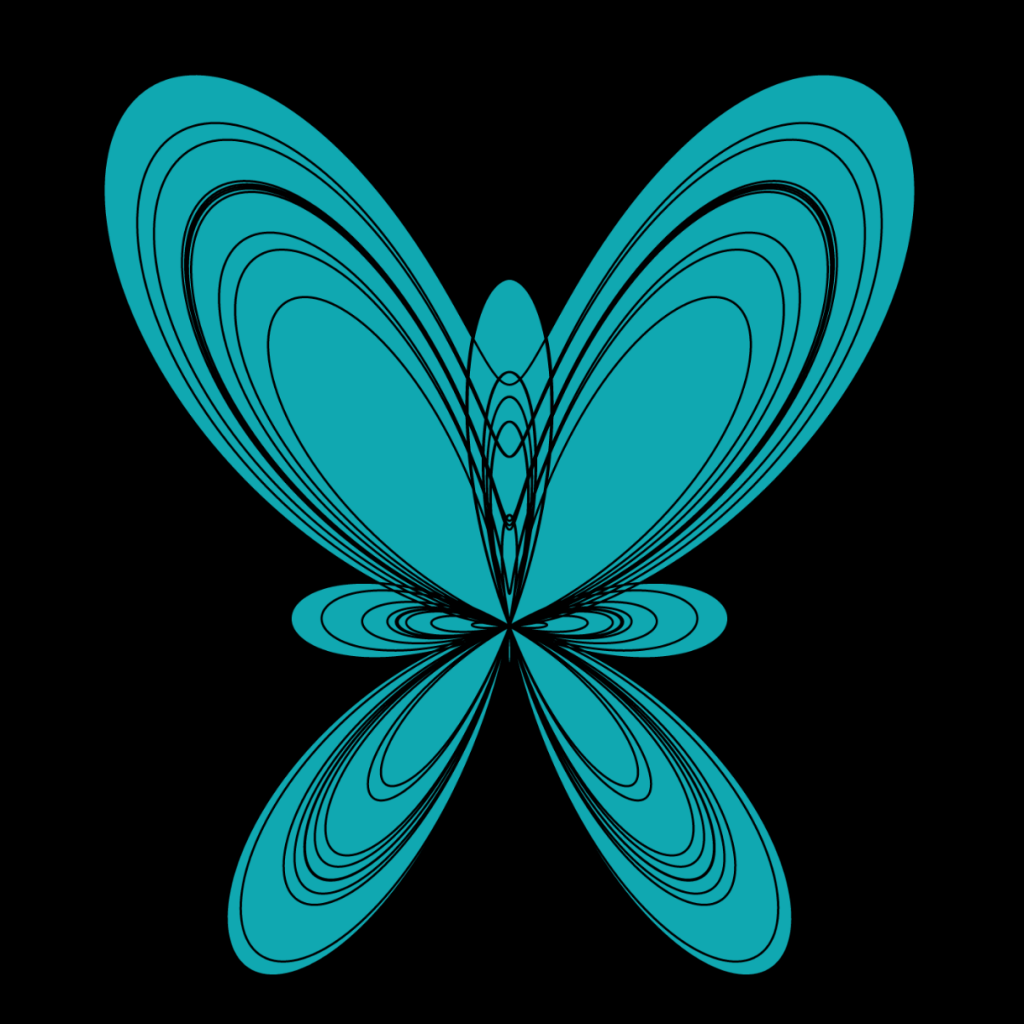
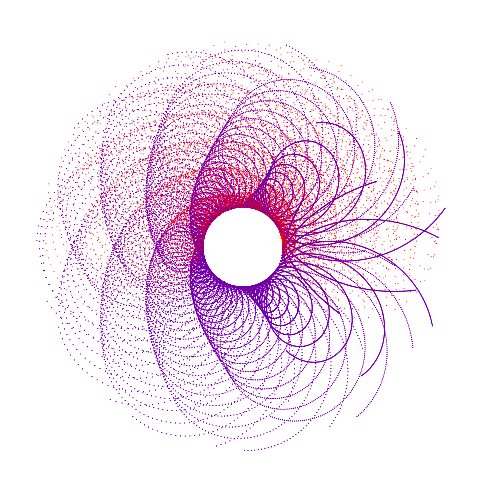
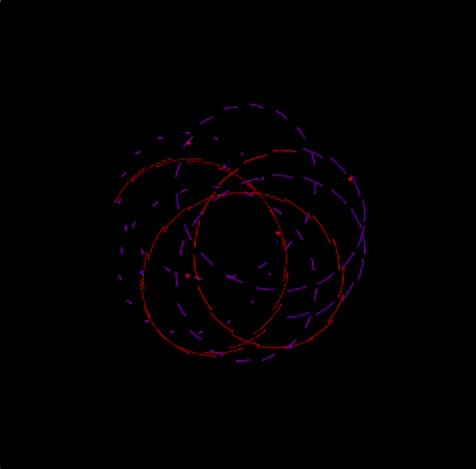
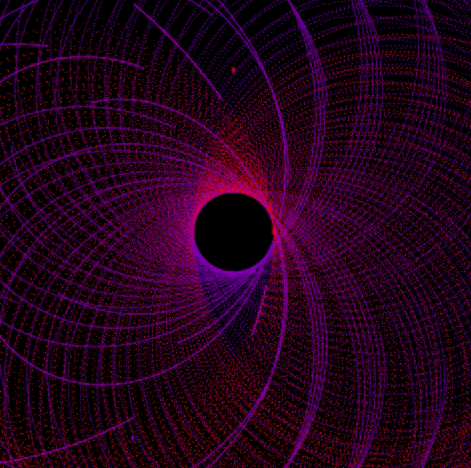
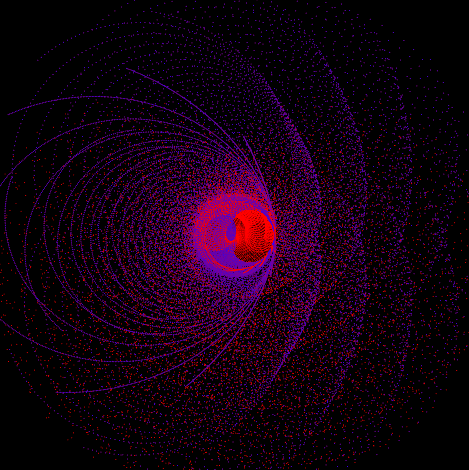
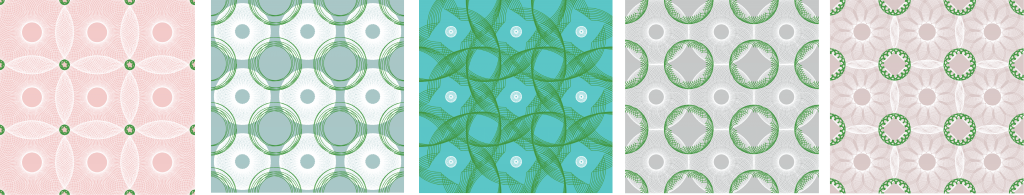
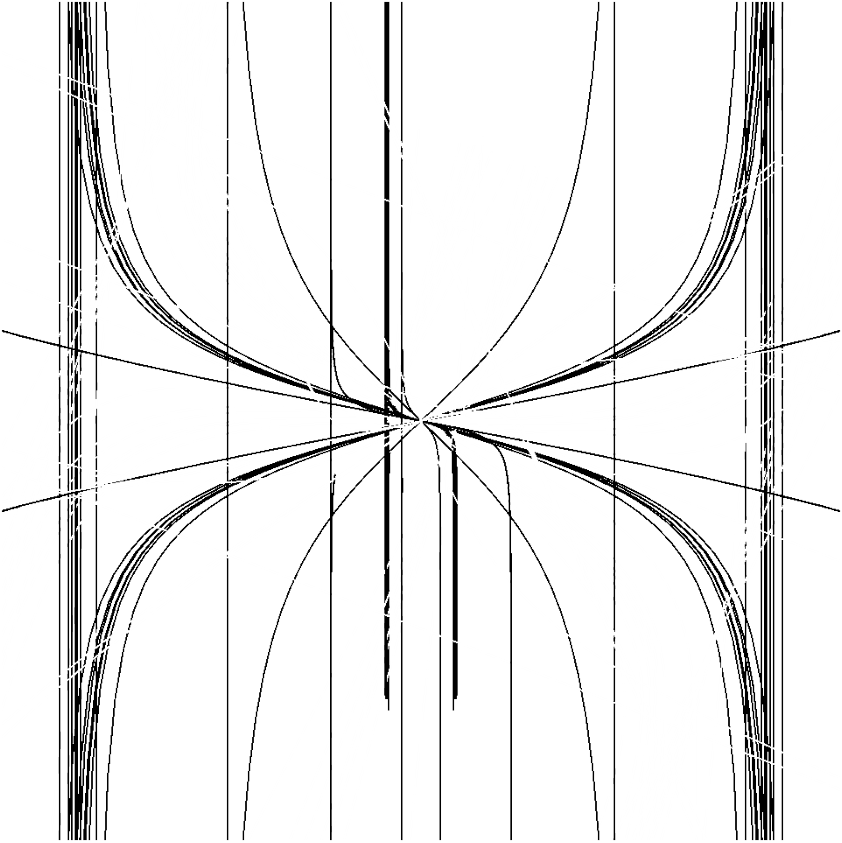
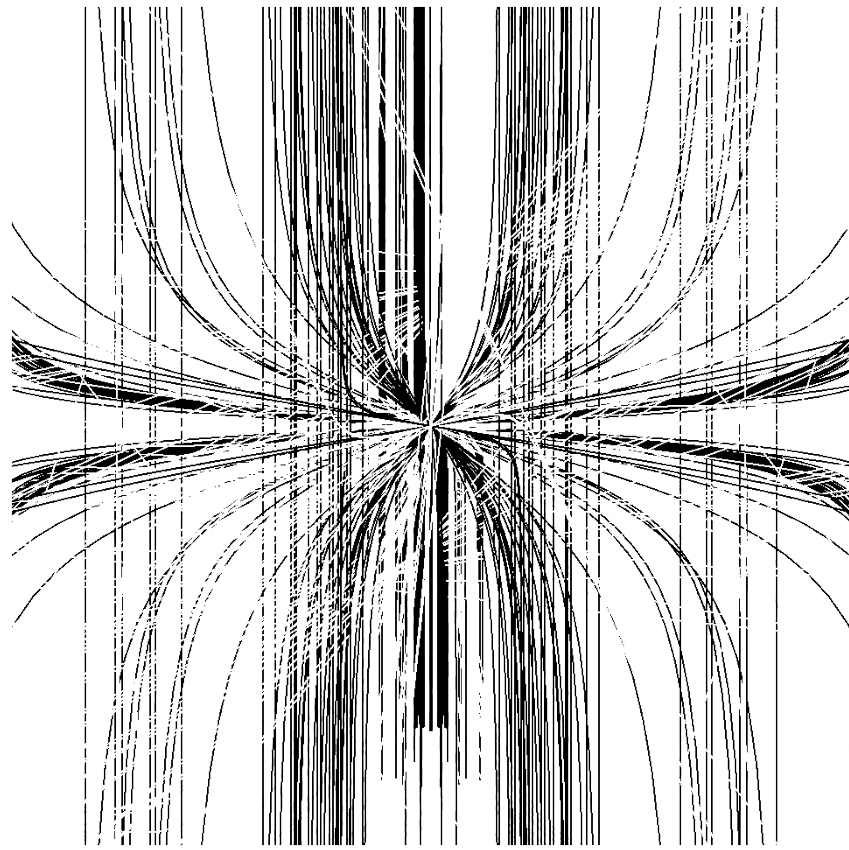
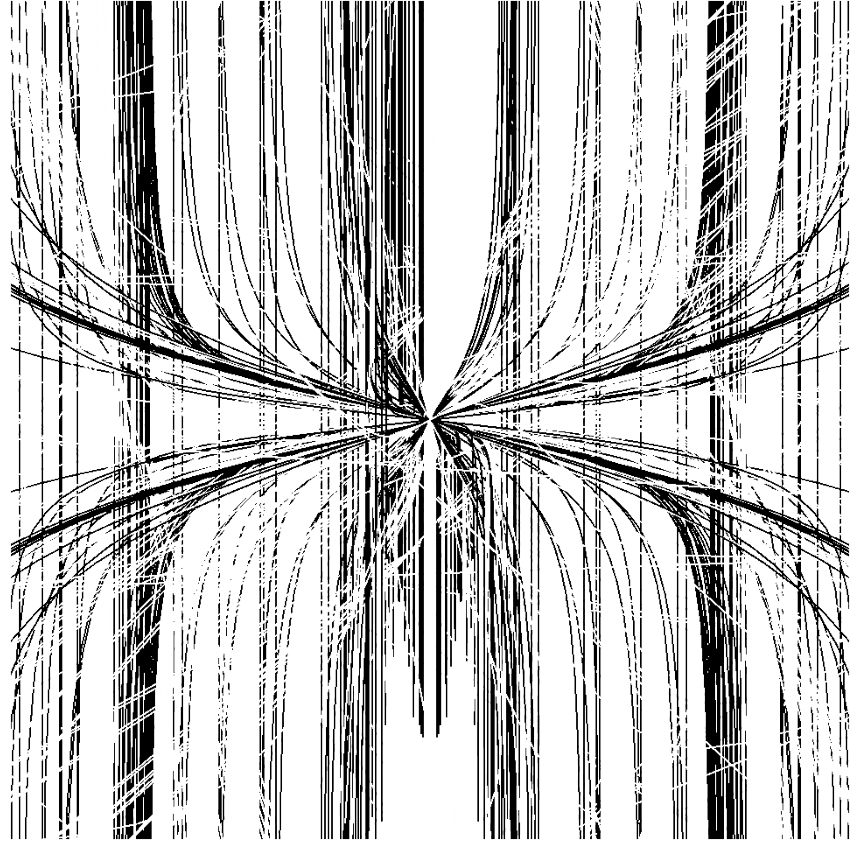
/* This code aims to create the curve, butterfly curve, as explained on Wolfram
MathWorld. In addition to drawing the curve I played around with the fill color
and stroke depending on the X position of the mouse. */

// Setups canvas size and speed
function setup() {
    createCanvas(480, 480);
    frameRate(10);
}

// Draws the butterfly curve
function draw() {
    var red = random(255); // Random shade of red
    var green = random(255); // Random shade of green
    var blue = random(255); // Random shade of blue

    background(0); // Black background
    translate(width/2, height/1.64); // Translate to the "center" of canvas
    rotate(PI); // Rotate 180 degrees

    if (mouseX < width/3) {                           
        fill(red, green, blue); // Random fill color      
	stroke(0); // Black
	// Draws butterfly curve 4 times
        for (var i = 0; i < 4; i++) {
            drawButterflyCurve(i);
        }  
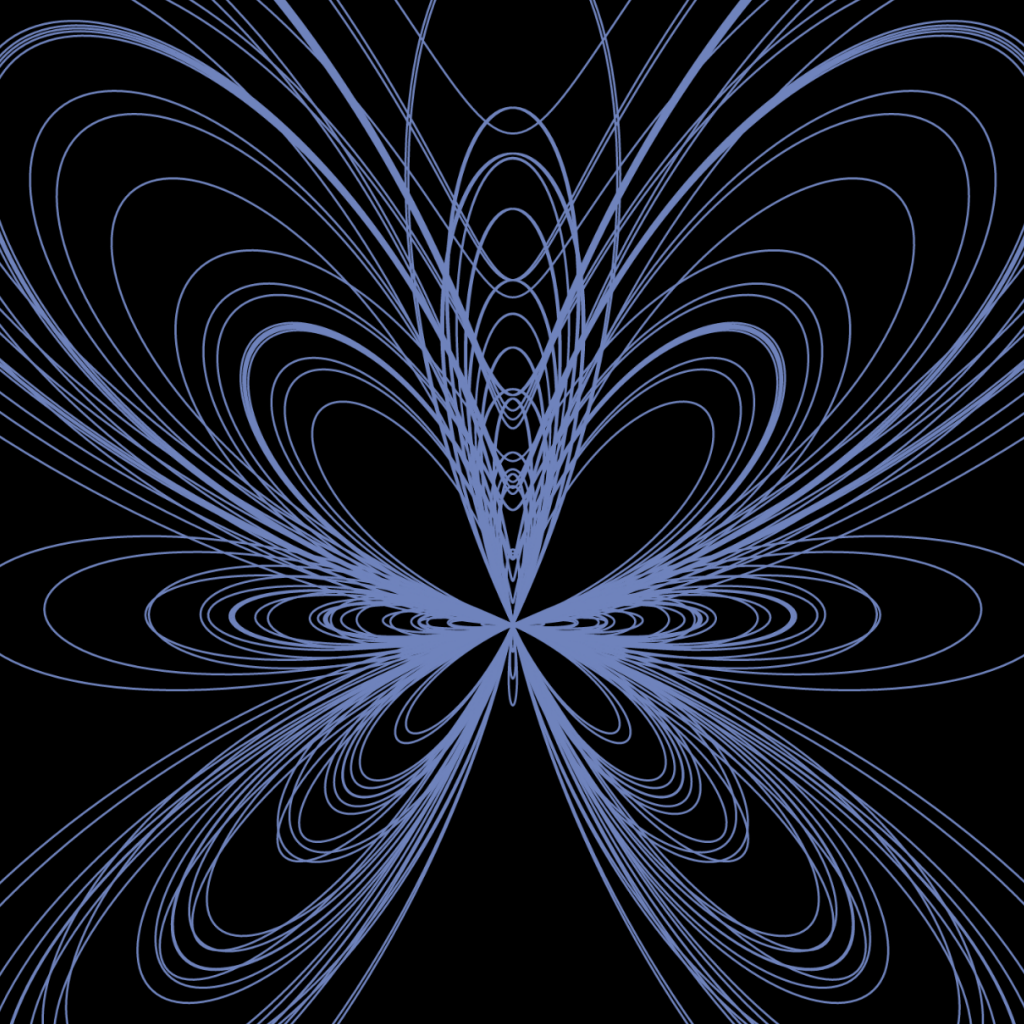
    } else if (mouseX >= width/3 & mouseX < 2*(width/3)) {
	noFill();
	stroke(red, green, blue); // Random stroke color
	// Draws butterfly curve 4 times
        for(var i = 0; i < 4; i++) {
            drawButterflyCurve(i*2); // i*2 makes size of curve bigger
        }
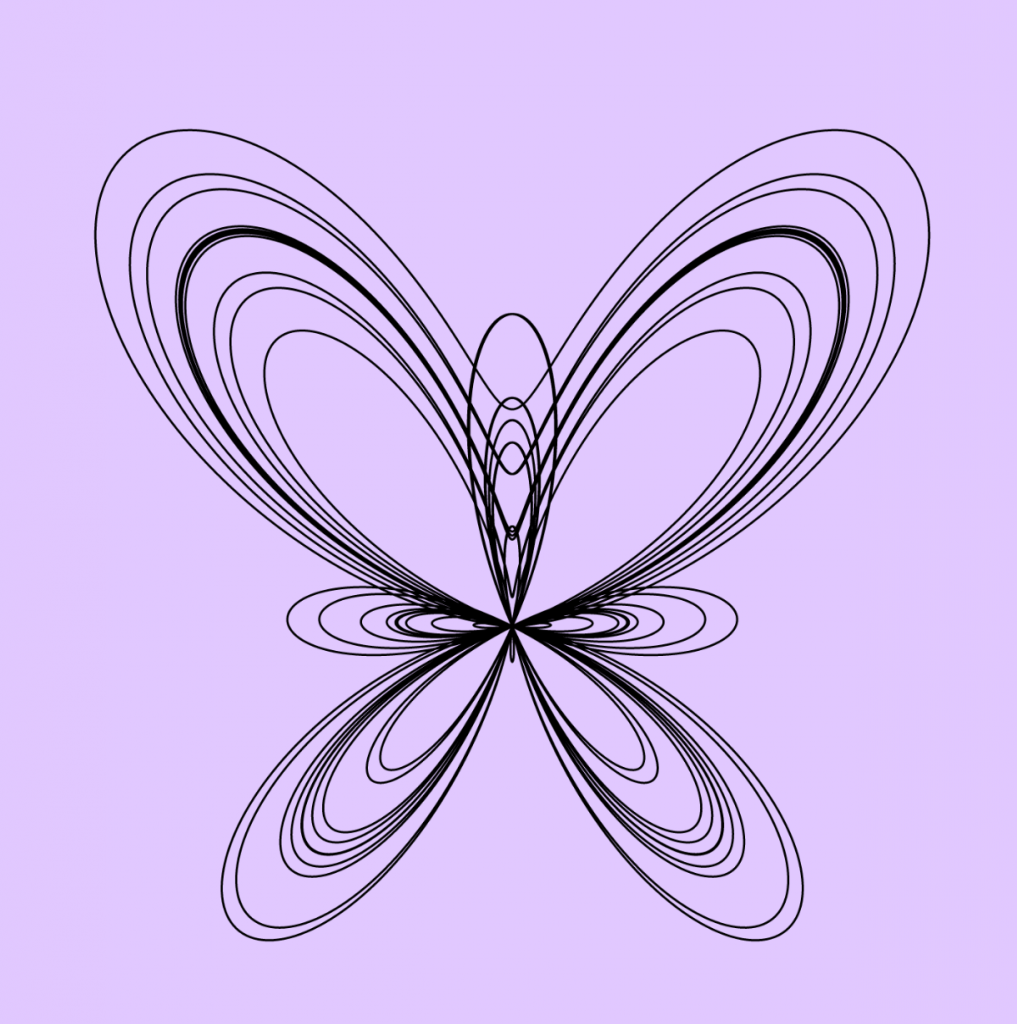
    } else if (mouseIsPressed) {
	background(225, 200, 255); // Purple background
	noFill();
	stroke(0); // Black
	drawButterflyCurve(1); // To see original curve
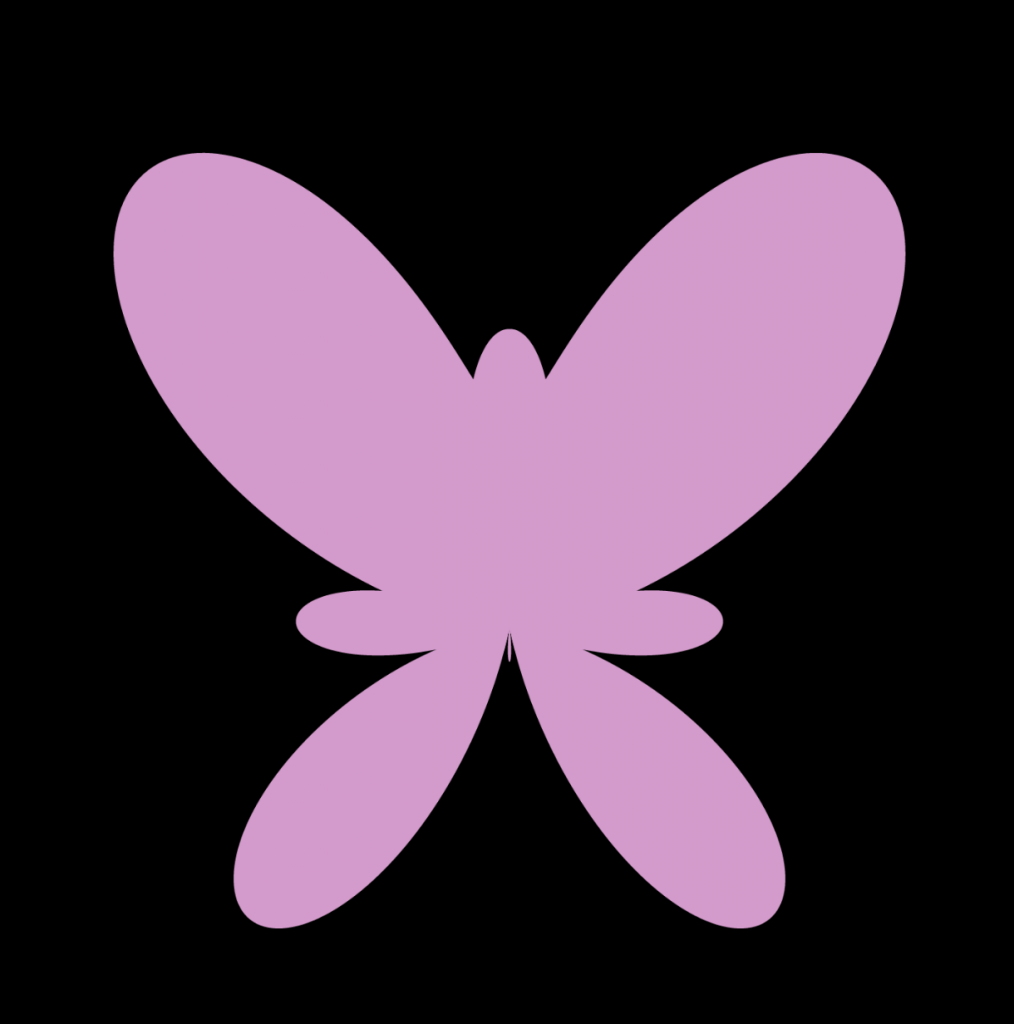
    } else {
	noStroke();
	fill(red, green, blue); // Random fill color
	// Draws butterfly curve 4 times
        for(var i = 0; i < 4; i++) {  
            drawButterflyCurve(i/3); // i/3 makes size of curve smaller
        }
    }
}

// Butterfly Curve
// https://mathworld.wolfram.com/ButterflyCurve.html
function drawButterflyCurve(j) {
    var da = .01; // How round the "wings" are
    var a = map(mouseX, 0, width, 0, width/9); // Constrain x size of butterfly curve 
    var b = map(mouseY, 0, height, 0, width/8); // Constrain y size of butterfly curve
    // Creates the butterfly curve
    beginShape();
    for (var t = 0; t <= 24*PI; t += da) {
	// The parametric equations found on the website commented above
	var r =  exp(cos(t))-2*cos(4*t)-pow(sin(t/12), 5);
	var x = a * sin(t) * r * j;
	var y = b * cos(t) * r * j;
	vertex(x, y);
    }
    endShape();
}

When I saw this curve on Wolfram MathWorld, I was super excited because I had attempted to draw a butterfly in my last project. I think this curve is way cooler because there’s a lot more curves and more going on. So, it wasn’t just a boring (although I don’t find it so boring) Butterfly Curve, I added some if statements to duplicate the curves, change colors of the fill and stroke, but if this is too much for you you can also click the mouse in the bottom right to get the normal curve. Also, moving the mouse up and down and side to side within each if statement changes the size of the curves. If you move it left to right within a third of the width it kind of looks like the butterfly is flapping it’s wings.

Mouse within 0 and 1/3 of the width
Mouse within 1/3 and 2/3 of the width
Within 2/3 and 3/3 of the width
Within 2/3 and 3/3 of the width if mouse is pressed (best if clicked at bottom right)

Project 07 – Curves

I chose to use the Epitrochoid Curve for my project this week. My code draws two curves—a blue and red one, and it’s pretty cool to see how and where they overlap with each other.

*because of the lag it’s really slow on WordPress ;(*

  • Refresh the page to start from center with white background.
  • Move the mouse back and forth to build contrast areas by changing the direction of the curve (inward or outward).
  • Control the speed of curve drawn with mouse position.
  • Click the mouse to change background to black.
  • Click and hold the mouse to erase all previous curve paths, and visualize the curve with stars that get brighter and dimmer with mouse position (brightest at lower right corner).
  • Release the mouse to draw the curve at various starting points.
Maggie – Curves
//Maggie Ma
//Section D

//variables for equation on https://mathworld.wolfram.com/Epitrochoid.html
var a = 30; //radius of small circle
var b = 10; //radius of rotating perimeter circle
var h = 0; //height of curve from the center of b
var t; //time
var x;
var y;
var speed; 


function setup() {
    createCanvas(500,500);
    background(255);
}

function draw() {
    noStroke();

	constrain(mouseX,0,width);
	constrain(mouseY, 0, height);

	//draws dots (without trail) when mouse is pressed
	//background changes to black
	//dots change in size with mouse position
    if (mouseIsPressed) { 
		background(0);
		for (t = 0; t <TWO_PI; t += 1) {
			fill(0,0,255);
	    	epCurve2(); }

   		for (t= 0; t<PI; t+= 1) {
   			fill(255,0,0);
	    	epCurve2(); }
	}

	speed=map(mouseX,0,width,.5,-.5); //changes the speed and size of curve as mouseX moves
    a+=speed; 
    h+=speed;
  	
  	fill(255,0,0); //drawing red curve
    for (t =-PI; t < TWO_PI; t += .08) {
    	epCurve();
    }

    fill(0,0,255); //drawing blue curve
    for (t= -PI; t<PI; t+= .08) {
	    epCurve();
    }
}

function epCurve() { //Epitrochoid Curve function
	push();
    translate(width/2, height/2); 
    //draw curve
    x=(a+b)*cos(t)-h*cos(((a+b)/b)*t); 
    y=(a+b)*sin(t)-h*sin(((a+b)/b)*t);
    ellipse(x,y,0.8,0.8); //draws dots on canvas
    pop();
}

function epCurve2() { //Dotted curve when mouse is pressed
	push();
   	translate(width/2, height/2); 
    //draw curve
    x=(a+b)*cos(t)-h*cos(((a+b)/b)*t); 
    y=(a+b)*sin(t)-h*sin(((a+b)/b)*t);
    ellipse(x,y,0.5+mouseX/100,0.5+mouseY/100); //draws dots on canvas that change size w/ mouse position
    pop(); 
}

Project 07 – Composition with Curves

sketch
// Stefanie Suk
// 15-104 Section D

var nPoints = 100; //number of points for curves
var angle = 10; //angle of rotation

function setup() {
    createCanvas(480,480);
    frameRate(15); //set frame rate to 15
}

function draw() {
    background(33, 63, 99); //background of canvas to dark blue

    //placing Hypocycloid in center
    push();
    translate(width/2, height/2);
    Hypocycloid();
    pop();

    //placing Deltoid in center and rotate by angle
    push();
    translate(width/2, height/2);
    rotate(radians(angle));
    angle += mouseX;
    Deltoid();
    pop();

    //placing Epitrochoid in center
    push();
    translate(width/2, height/2);
    Epitrochoid();
    pop();
}

function Hypocycloid(){
    // variables for Hypocycloid
    var a1 = map(mouseY, 0, 300, 150, 180); //size changes with respect to mouseY
    var b1 = 15;
    var c1 = mouseX / 25;

    //color, stroke of Hypocycloid
    stroke(167, 219, 239);
    strokeWeight(6);
    noFill();

    //create curve, map to full circle radians
    //use math function to find x and y values
    beginShape();
    for (var i = 0; i < nPoints; i++) {
        var angle1 = map(i, 0, nPoints, 0, TWO_PI);     
        x1 = (a1 - b1) * cos(angle1) + c1 * cos((a1 - b1) * angle1);
        y1 = (a1 - b1) * sin (angle1) - c1 * sin((a1 - b1) * angle1);
        vertex(x1, y1);
    }
    endShape(CLOSE); 
}

function Deltoid(){
    colorR = map(mouseX, 0, 50, 100, 255);
    colorG = map(mouseX, 0, 50, 100, 255); //set color in specific range
    colorB = map(mouseY, 0, 50, 100, 255); //changes color with respect to mouseX,Y
    
    // variable for Deltoid, change size
    a2 = map(mouseY, 0, height, 10, 40); //size changes with respect to mouseY
    
    //color, stroke, fill of Deltoid
    stroke(255);
    strokeWeight(6);
    fill(colorR, colorG, colorB);

    //create curve, map to full circle radians
    //use math function to find x and y values
    beginShape();
    for (var i = 0; i < nPoints; i++) {
        var angle2 = map(i, 0, nPoints, 0, TWO_PI);
        x2 = ((2 *(cos(angle2))) + (cos(2*angle2)))* a2 ;
        y2 = ((2 *(sin(angle2))) - (sin(2*angle2)))* a2 ;
        vertex(x2, y2);
    }
    endShape(CLOSE);
}

function Epitrochoid() {

    colorR = map(mouseX, 0, 50, 100, 255);
    colorG = map(mouseX, 0, 50, 100, 255); //set color in specific range
    colorB = map(mouseY, 0, 50, 100, 255); //changes color with respect to mouseX,Y

    // variables for epitrochoid
    var a3 = map(mouseY, 0, 400, 40, 110); //size changes with respect to mouseY
    var b3 = 50;
    var c3 = (mouseX / 15);

    //color, stroke of epitrochoid
    stroke(colorR, colorG, colorB);
    strokeWeight(1.5);
    noFill();

    //create curve, map to full circle radians
    //use math function to find x and y values
    beginShape();
    for (var i = 0; i < nPoints; i++) {
        var angle3 = map(i, 0, nPoints, 0, TWO_PI);
        x3 = (a3 + b3) * cos(angle3) + c3 * cos((a3 + b3) * angle3);
        y3 = (a3 + b3) * sin(angle3) + c3 * sin((a3 + b3) * angle3);
        vertex(x3, y3);
    }
    endShape(CLOSE);
}

I utilized hypocycloid, deltoid, and epitrochoid using the reference from Mathworld to create this project. I chose these curves because I loved how they were structured. I thought that when these three curves are put together would create one unique interactive shape for my project. The exploration of this project was interesting, and I also played around with random colors and sizes with mouseX and mouseY. The unique part about these curves in my project is that the curves in my work create different smoothness depending on the position of the mouse (round, shape, spiky, squiggly). The different shapes created in the project look like forms of snowflakes, which is why I made the main color blue.

Project-07-Curves

Please move your cursor around and feel the heartbeats.

heart
//jiaqiwa2; Jiaqi Wang; Section C
function setup() {
    createCanvas(480, 480);
    background(220);
    
}

function draw() {
	// Create a blended background
	fill(0, 10);
    rect(0, 0, width, height);
    //Keep track of how far mouse is away from the center
	var dX=Math.abs(mouseX-width/2);
	var dY=Math.abs(mouseY-height/2);
	//xoff and yoff are used to continuously govern 
	//two parameters of the curve respectively
	var xoff=map(dX,0,240,1,17);
	var yoff=map(dY,0,240,1,17);
	fill(220,49,63,60);
    heart(width/2,height/2,xoff,yoff);

}

function heart(Px,Py, xoff,yoff){
	push();
	//move the heart to the center of the canvas
	translate(Px,Py);
	noStroke();
	//start drawing heart curve 
	//with respect to mouse's distance from the center
	beginShape();
	for(var i=0;i<TWO_PI; i+=0.01){
		 var x=xoff*16*pow(sin(i),3);
		 var y=-yoff*(13*cos(i)-5*cos(2*i)-2*cos(3*i)-cos(4*i));
		 vertex(x,y);
	}
	endShape();
	pop();
}


For this project, I wanted to create a dynamic feeling of heartbeat using the Heart Curve.

Project-07: Curves

For this week’s project, I decided to use 2 different curves that reminded me of flowers, a 10 cusp Epicycloid and a 10 cusp Hypotrochoid. I decided to make them rotate and change in size based on the mouse movements but in opposite directions to give off a pulsating effect. I also utilized mousePressed so that the curves can alternate. The mouse positions also control the colors of the curves and the background so that the final output is unique in all positions. The colors of the flowers and background are quite muted to give off a slight vintage wallpaper vibe with a modern twist.

(below are screenshots of the code at different mouse positions)

sketch

function setup() {
    createCanvas(480, 480);
}

var nPoints = 100;

// background color codes
var r = 205;
var g = 152;
var b = 152;

// to switch curves based on mouse click
var whichCurve = 0;

// curve color codes
var curver = 202;
var curveg = 255;
var curveb = 255;

function draw() {

	// to add/subtract color codes based on mouse position
	var colordiffX = map(mouseX, 0, 480, 0, 53);
	var colordiffY = map(mouseY, 0, 480, 0, 53);

	background(r - colordiffX, g + colordiffY, b + colordiffX);

	stroke(255); // white outline

	// 5 x 5 curves (outer)
	for(var x = 60; x < width; x += 90){
		for(var y = 60; y < height; y += 90){
			push();
			translate(x, y);
			fill(curver + colordiffX, curveg - colordiffY, curveb - colordiffX);
			if(whichCurve == 0) {
				drawHypotrochoid();
			}
			else {
				drawEpicycloid();
			}
			pop();
		}
	}
	// 4 x 4 curves (inner)
	for(var x = 105; x < width - 90; x += 90) {
		for(var y = 105; y < height - 90; y += 90) {
			push();
			translate(x, y);
			fill(curver + colordiffY, curveg - colordiffX, curveb - colordiffY);
			if(whichCurve == 1) {
				drawHypotrochoid();
			}
			else {
				drawEpicycloid();
			}			
			pop();
		}
	}
}

// draw rotating 10 cusp epicycloid
function drawEpicycloid() {
	var x;
	var y;
	var a = mouseX / 30;
	var b = a / 10;
    var h = constrain(mouseY / 8, a / 10, 8*b);
    var ph = mouseX / 50;

    beginShape();
    for (var i = 0; i < nPoints; i++) {
        var t = map(i, 0, nPoints, 0, TWO_PI);
        x = (a + b) * cos(t) - h * cos(ph + t * (a + b) / b);
        y = (a + b) * sin(t) - h * sin(ph + t * (a + b) / b);
        vertex(x, y);
    }
    endShape(CLOSE);
}

// draw rotating 10 cusp hypotrochoid
function drawHypotrochoid() {
	var x;
	var y;
	var a = (width - mouseX)/20; // opposite movement from epicycloid
	var b = a / 10;
    var h = constrain((height - mouseY)/8, a/10, 10*b);
    var ph = (width - mouseX) / 50;

    beginShape();
    for (var i = 0; i < nPoints; i++) {
        var t = map(i, 0, nPoints, 0, TWO_PI);
        x = (a - b) * cos(t) + h * cos(ph + t * (a - b) / b);
        y = (a - b) * sin(t) - h * sin(ph + t * (a - b) / b);
        vertex(x, y);
    }
    endShape(CLOSE);
}

// mouse pressed alternates order of curves
function mousePressed() {
	if(whichCurve == 0){
		whichCurve = 1;
	}
	else {
		whichCurve = 0;
	}
}

Project 7: Curves

I played around with some of the different roulettes I found on Wolfram Math World. I wanted my project to have a psychedelic effect and change colors depending on the location of the mouse. If you move your mouse around the screen, the colors and sizes of the shapes change on the screen. The background color also changes based on the which quadrant the mouse is in.


My favorite part of the project was experimenting with the shapes’ equations. A simple change in a subtraction sign, variable, or coefficient can drastically change the shape. I also attached a few screenshots below of what the program looks like at different mouse locations.

sketchDownload
var a;    //radius of fixed circle
var b;   //radius of moving circle
var h = 10;  //height of the moving circle 
var theta;   
 
function setup() {
    createCanvas(480, 480);
    background(220);
}

function draw() {
	drawBackground(); 

	for (var x = 0; x <= 480; x += 120) {
        for (var y = 0; y <= 480; y += 120) {
            push();
            translate(x+60, y+60);
            drawEpitrochoid();
            pop();
        }

    	for (var y = 0; y <= 480; y += 120) {
    		push();
    		translate(x + 60, y + 60);
    		drawRanunculoid();
    		pop();
    	}

    	for (var y = 0; y <= 480; y += 120) {
    		push();
    		translate(x + 60, y + 60);
    		drawInnerRanunculoid();
    		pop();
    	}
    }
                
}
//background changes color based on what quadrant the mouse is in.
function drawBackground() {
	if (mouseX < width / 2 & mouseY < height / 2) {
    	background(51, 0, 54);
    } else if (mouseX < width / 2 & mouseY > height / 2) {
    	background(173, 178, 211);
    } else if (mouseX > width / 2 & mouseY < height / 2) {
    	background (47, 57, 77);
    } else {
    	background (86, 102, 107);
    }
}

//draws large epitroid in the background
function drawEpitrochoid() {
	strokeWeight(0);
	fill(mouseX + 100, mouseY + 100 , 223);
	beginShape();    

	a = map(mouseX/2, 0, 480, 1, 50);
	b = map(mouseY/2, 0, 480, 1, 50);
	h = map(mouseX/2, 0, 480, 1, 50);

	    for (var i = 0; i < 480; i++) {

	        var x = (a+b) * cos(theta) - h * cos(((a+b) / b) * theta);
	        var y = (a+b) * sin(theta) - h * sin(((a+b) / b) * theta);
	        var theta = map(i, 0, 360, 0, TWO_PI);
	    
	        vertex(x, y);
	    }  

	endShape();
}

//draws flower-like shape
function drawRanunculoid() {
	strokeWeight(0);
	fill(mouseY / 5, mouseX / 5, 77);
	beginShape();    

	a = map(mouseY/10, 0, 480, 1, 50);
	b = map(mouseY/10, 0, 480, 1, 50);
	h = map(mouseX/10, 0, 480, 1, 50);

	    for (var i = 0; i < 480; i++) {

	        var x = a * (6 * cos(theta) - cos(6 * theta));
	        var y = a * (6 * sin(theta) - sin(6 * theta));
	        var theta = map(i, 0, 360, 0, TWO_PI);
	    
	        vertex(x, y);
	    }  

	endShape();
}

//draws inner flower-like shape
function drawInnerRanunculoid() {
	strokeWeight(0);
	fill(mouseY + 80, mouseY - 50, 100);
	beginShape();    

	a = map(mouseX/10, 0, 480, 1, 30);
	b = map(mouseY/10, 0, 480, 1, 30);
	h = map(mouseX/10, 0, 480, 1, 30);

	    for (var i = 0; i < 480; i++) {

	        var x = a * (6 * cos(theta) - cos(6 * theta));
	        var y = a * (6 * sin(theta) - sin(6 * theta));
	        var theta = map(i, 0, 360, 0, TWO_PI);
	    
	        vertex(x, y);
	    }  

	endShape();
}

Project 7: Curves

sketch
/*
Bon Bhakdibhumi
bbhakdib
Section D
*/

var nPoints = 100;
function setup() {
    createCanvas(410, 400);
}

function draw() {
    background(171, 230, 255);
    for(var i=30; i<=400;i+=100){
        for(var j=30; j<=400;j+=60){
            push();
            translate(i,j);
            daisy();
            pop();
        }
    }
    for(var k=80; k<=400;k+=100){
        for(var l=0; l<=600;l+=60){
            push();
            translate(k,l);
            daisy();
            pop();
        }
    }
}

function daisy() {
//drawing a daisy
    var x;
    var y;
// making a ranunculoid or a 10-cusp epicycloid  
    var petal = 10;
    if (mouseY >= height/3 & mouseY < height*(2/3)){
        petal = 5;
    }
    var a = 20;
    var b = a / petal;
    var h = b;
// making a fried egg
    if (mouseY < height/3) {
        h = 0;
    }
    var ph = mouseX / 50.0;
    var ph = mouseX / 50.0;
    fill(255);
    stroke(100);
    beginShape();
    for (var i = 0; i < nPoints; i++) {
        var t = map(i, 0, nPoints, 0, TWO_PI);
        x = (a + b) * cos(t) - h * cos(ph + t * (a + b) /b);
        y = (a + b) * sin(t) - h * sin(ph + t * (a + b) /b);
        vertex(x, y);
    }
    endShape(CLOSE);
// middle part
    fill(255, 253, 158);
    circle(0, 0, a);
}

For this project, I decided to create an interactive pattern using ranunculoid and 10-cusps epicycloid curves. The pattern changes from a pattern of fried eggs, when mouseY is in the first third of the canvas, to a pattern of 5-petals daisies, when mouseY is in the second third of the canvas, and to a pattern of 10-petals daisies, when mouseY is in the last third of the canvas. The pattern also spins when mouseX changes.

Project-07 Curves

curves
var r = 0;    //red color variable 

var a = 0;    //radius of circle a (inner circle) for parametric function 
var b = 0;    //radius of circle b (fixed circle) for parametric function  
var h = 0;    //distance from center of inner circle

var theta = 0;    //angle variable
 
function setup() {
    createCanvas(480, 480); 
    background(220);
}

function draw() {

	//changing red level of background  
	r = map(mouseX, 0, 480, 0, 255); 
    background(r, 200, 200);

    //creates 9 Hypotrochoid curves
    for (var x = 0; x <= 400; x += 160) {
        for (var y = 0; y <= 400; y += 160) {
            push();
            translate(x+80, y+80);
            drawHypotrochoid();
            pop();
        }
    }

    //creates 16 Hypotrochoid Evolute curves
    for (var x = 0; x <= 480; x += 160) {
        for (var y = 0; y <= 480; y += 160) {
            push();
            translate(x, y);
            drawEvolute();
            pop();
        }
    }
}

function drawHypotrochoid() {

    //curve based on the Hypotrochoid equation 

    strokeWeight(0.5);
    stroke(255);
    noFill();
    beginShape();    

    a = map(mouseX, 0, 480, 1, 70);
    b = map(mouseY, 0, 480, 1, 5);
    h = map(mouseX, 0, 480, 1, 40);

        for (var i = 0; i < 2000; i++) {

            var x = (a-b)*cos(theta) + h*cos((a-b)/b*theta);
            var y = (a-b)*sin(theta) + h*sin((a-b)/b*theta);
            var theta = map(i, 0, 360, 0, TWO_PI);
        
            vertex(x, y);
        }  

    endShape();

    pop();
}

function drawEvolute() {

    //curve based on the Hypotrochoid Evolute equation
    
    strokeWeight(1);    
    stroke(0, 150, 0);

    noFill();
    beginShape();    

    a = 8*map(480-mouseX, 0, 480, 1, 30);
    b = 2*map(480-mouseY, 0, 480, 1, 20);
    h = 3*map(480-mouseX, 0, 480, 1, 10);

        for (var i = 0; i < 4000; i++) {

            var x = (a-b)*cos(theta) + h*cos((a-b)/b*theta);
            var y = (a-b)*sin(theta) + h*sin((a-b)/b*theta);
            var theta = map(i, 0, 480, 0, TWO_PI);
        
            vertex(x, y);
        }  

    endShape();

    pop();
}
screenshots of cursor at different points

For this project, I tried out a few of the equations from the reference and liked the look of the Hypotrochoid the best. Once I had the Hypotrochoid curve working I want to add some visual interest by replicating them with a loop. Once that was done, I added another curve, the Hypotrochoid Evolute and replicated that with a loop too. After the curves were all in place, I added the changing background. The biggest challenge was understanding how changing the values of variables in the equations effected the curve but once I was able to get that it was fun to mess around with! 

Project-07-Curves

Move your mouse and be patient to generate curves, and try wiggling your mouse in the same spot to build up contrast areas!

sketch

function setup() {
    createCanvas(480, 480, WEBGL);
    angleMode(DEGREES);
    noFill();
    translate(240,240);
} 

function draw() {
//draws black lines
   drawBulletNoseCurve();
//draws white lines to create 'gaps', that spins
   for(let j=0; j<360; j++){
   push();
   stroke(255);
   fill(255,255,255,50);
   rect(-240,-240,480,480,10);
   noFill();
   rotate(mouseY);
   drawBulletNoseCurve();
   pop();
   }
}

function drawBulletNoseCurve(){
    var x;
    var y;
    var a=mouseY/10;
    var t;
    var b=mouseX/50;
//vertical orientation curves
    beginShape();
    for(var i=0;i<100; i++){
         var t = map(i, 0, 100, 0, 200);
        x=a*cos(t);
        y=b*(cos(t)/sin(t));
        vertex(x,y);
    }
    endShape();
//horizontal biased 
    beginShape();
    for(var i=0;i<100; i++){
        var t = map(i, 0, 100, 0, 400);
        x=10*-a*cos(t);
        y=10*b*(cos(t)/sin(t));
        vertex(x,y);
    }
    endShape();
}

I used the Bullet Nose curve to create my project. It uses both black and white layers of lines on a white line, so the white layers create ‘gaps’ or glitches in the black pattern, but it uses the bullet nose curve rotated around the origin to create them. I decided to create a separate function for drawing the curve, as I would use it for different purposes with different strokes. The mouse position helps determine the width of the asymptote portions of the curves, as well as the severity of the curve (how flat the inner portion is). I also made the creative decision to have it build up or truly ‘draw’ instead of re drawing the background each time. This allows the user to see the history of the work and understand the curves and gaps better.

Beginning of the experience, with few lines
Later, with more lines drawn
Alternative final state, with mouse hovering creating bolder areas

Project 7 — Composition with Curves

For this project, I wanted to draw a single object but in different ways. I took the functions from the website provided in the project brief and decided to draw a heart by plugging in functions for “x” and “y” and using the “beginShape()” function. I first began by using a “for loop” to draw a circle by creating a local variable that adds in increments for every loop. By altering this variable, I was able to draw the heart in different ways.

Click to change colors:

sketch
function setup() {
    createCanvas(400, 480);
    background(220);
    text("p5.js vers 0.9.0 test.", 10, 15);
}

function draw() {
    background(0);
    translate(width / 2, height / 2);

    //heart one
    push();
    translate(-100, -130);
    noFill();
    strokeWeight(0.5);
    stroke(255);
    beginShape();
    for(var a = 0; a < TWO_PI; a += 0.3) { //this function draws a circle before the equation is put in
        if(mouseIsPressed){
            stroke(random(255), random(255), random(255)); //color change
        }
        //drawing the first heart
        var r = constrain(mouseX / 180, 1, 70); //movement of mouse
        var x = r * 16 * pow(sin(a), 3);
        var y = -r * (13 * cos(a) - (5 * cos(2 * a)) - 2 * cos(3 * a) - cos(4 * a));
        vertex(x, y);
        //drawning the second heart
        var b = r/2 * 16 * pow(sin(a), 3);
        var c = -r/2 * (13 * cos(a) - (5 * cos(2 * a)) - 2 * cos(3 * a) - cos(4 * a));
        vertex(b, c);
    }      
    endShape(CLOSE);
    pop();

    //heart two
    push();
    translate(100, -130);
    noFill();
    strokeWeight(0.5);
    stroke(255);
    beginShape();
    for(var a = 0; a < TWO_PI; a += 0.2) {
        if(mouseIsPressed){
            stroke(random(255), random(255), random(255)); //color change
        }
        //drawing the first heart
        var r = constrain(mouseX / 180, 1, 70); //movement of mouse
        var x = r * 16 * pow(sin(a), 3);
        var y = -r * (13 * cos(a) - (5 * cos(2 * a)) - 2 * cos(3 * a) - cos(4 * a));
        vertex(x, y);
        //drawing the second heart
        var b = r/2 * 16 * pow(sin(a), 3);
        var c = -r/2 * (13 * cos(a) - (5 * cos(2 * a)) - 2 * cos(3 * a) - cos(4 * a));
        vertex(b, c);
    }      
    endShape(CLOSE);
    pop();

    //heart three
    push();
    translate(-100, 0);
    noFill();
    strokeWeight(0.5);
    stroke(255);
    beginShape();
    for(var a = 0; a < TWO_PI; a += 0.1) {
        if(mouseIsPressed){
            stroke(random(255), random(255), random(255)); //color change
        }
        //drawing the first heart
        var r = constrain(mouseX / 180, 1, 70);
        var x = r * 16 * pow(sin(a), 3);
        var y = -r * (13 * cos(a) - (5 * cos(2 * a)) - 2 * cos(3 * a) - cos(4 * a));
        vertex(x, y);
        //drawing the second heart
        var b = r/2 * 16 * pow(sin(a), 3);
        var c = -r/2 * (13 * cos(a) - (5 * cos(2 * a)) - 2 * cos(3 * a) - cos(4 * a));
        vertex(b, c);
    }      
    endShape(CLOSE);
    pop();

    //heart four
    push();
    translate(100, 0);
    noFill();
    strokeWeight(0.5);
    stroke(255);
    beginShape();
    for(var a = 0; a < TWO_PI; a += 0.08) {
        if(mouseIsPressed){
            stroke(random(255), random(255), random(255)); //color change
        }
        //drawing the first heart
        var r = constrain(mouseX / 180, 1, 70);
        var x = r * 16 * pow(sin(a), 3);
        var y = -r * (13 * cos(a) - (5 * cos(2 * a)) - 2 * cos(3 * a) - cos(4 * a));
        vertex(x, y);
        //drawing the second heart
        var b = r/2 * 16 * pow(sin(a), 3);
        var c = -r/2 * (13 * cos(a) - (5 * cos(2 * a)) - 2 * cos(3 * a) - cos(4 * a));
        vertex(b, c);
    }      
    endShape(CLOSE);
    pop();

    //heart five
    push();
    translate(-100, 130);
    noFill();
    strokeWeight(0.5);
    stroke(255);
    beginShape();
    for(var a = 0; a < TWO_PI; a += 0.06) {
        if(mouseIsPressed){
            stroke(random(255), random(255), random(255)); //color change
        }
        //drawing the first heart
        var r = constrain(mouseX / 180, 1, 70);
        var x = r * 16 * pow(sin(a), 3);
        var y = -r * (13 * cos(a) - (5 * cos(2 * a)) - 2 * cos(3 * a) - cos(4 * a));
        vertex(x, y);
        //drawing the second heart
        var b = r/2 * 16 * pow(sin(a), 3);
        var c = -r/2 * (13 * cos(a) - (5 * cos(2 * a)) - 2 * cos(3 * a) - cos(4 * a));
        vertex(b, c);
    }      
    endShape(CLOSE);
    pop();

    //heart six
    push();
    translate(100, 130);
    noFill();
    strokeWeight(0.5);
    stroke(255);
    beginShape();
    for(var a = 0; a < TWO_PI; a += 0.04) { 
        if(mouseIsPressed){
            stroke(random(255), random(255), random(255)); //color change
        }
        //drawing the first heart
        var r = constrain(mouseX / 180, 1, 70);
        var x = r * 16 * pow(sin(a), 3);
        var y = -r * (13 * cos(a) - (5 * cos(2 * a)) - 2 * cos(3 * a) - cos(4 * a));
        vertex(x, y);
        //drawing the second heart
        var b = r/2 * 16 * pow(sin(a), 3);
        var c = -r/2 * (13 * cos(a) - (5 * cos(2 * a)) - 2 * cos(3 * a) - cos(4 * a));
        vertex(b, c);
    }      
    endShape(CLOSE);
    pop();


}
Normal state
Color state