Project-07 – Curves

sketch
//Dreami Chambers; Section C; dreamic@andrew.cmu.edu; Assignment-05-Project

function setup() {
    createCanvas(480, 480);
    background(220);
}

function draw() {
	background(250, 190, 200) //pink background
	//calls column with 5 hearts
    for (var x = 40; x <= width; x += 200) {
        for (var y = 40;y <= height; y+= 100) {
        	push()
            translate(x, y)
            drawheart2()
            drawheart()
            pop()
        }
    }
    //cals collumn with 4 hearts
    for (var x = 140; x <= width; x += 200) {
        for (var y = 100;y <= height; y+= 100) {
        	push()
            translate(x, y)
            drawheart2()
            drawheart()
            pop()
        }
    }
}

//draws pink hearts
function drawheart(){
	fill(230, 80, 120)
	strokeWeight(0)
	push()
    beginShape();
    rotate(radians(180))
    for (var i = 0; i < TWO_PI; i+=0.1) {
    	var mx = constrain(mouseX/300, 0.7, 1.2) //multiplier based on mouseX
    	var my = constrain(mouseY/300, 0.7, 1.2) //multiplier based on mouseY
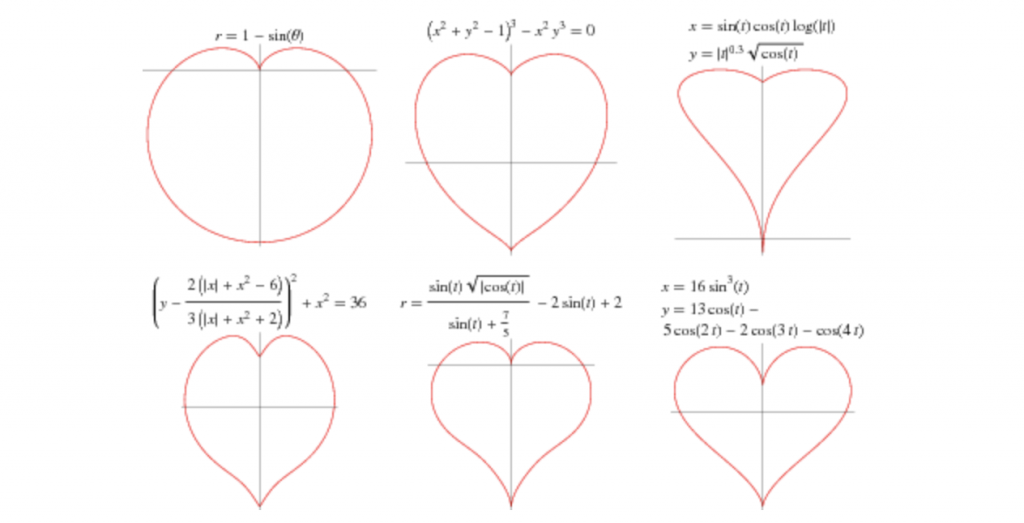
        var x = mx*16*pow(sin(i),3)
        var y = my*13*cos(i) - 5*cos(2*i) - 2*cos(3*i) - cos(4*i)
        vertex(x,y); 
    }
    endShape(CLOSE);
    pop()
}

//draws white hearts
function drawheart2(){
	var t = constrain(mouseX/3, 50, 80) //transparency based on mouseX
	fill(255, 255, 255, t)
	strokeWeight(0)
	push()
    beginShape()
    scale(2)
    rotate(radians(180))
    for (var i = 0; i < TWO_PI; i+=0.1) {
        var x = 1.2*16*pow(sin(i),3)
        var y = 1.2*13*cos(i) - 5*cos(2*i) - 2*cos(3*i) - cos(4*i)
        vertex(x,y); 
    }
    endShape(CLOSE);
    pop()
}

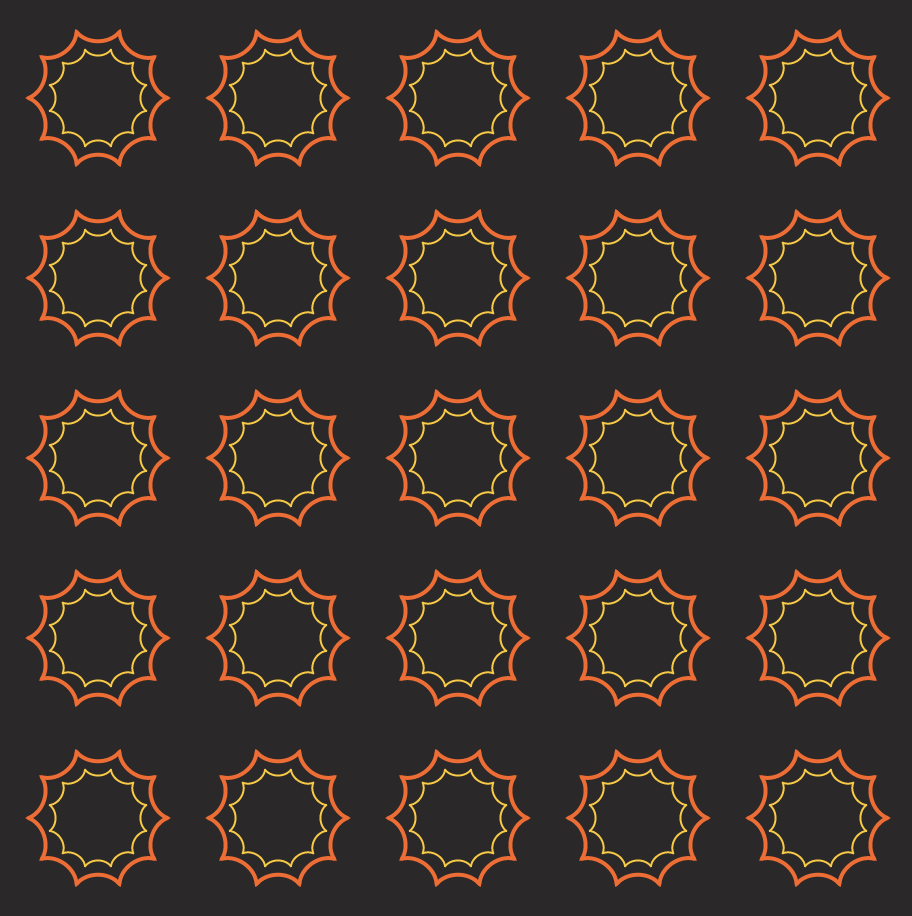
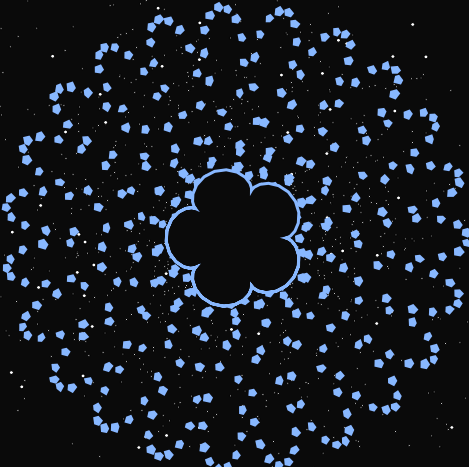
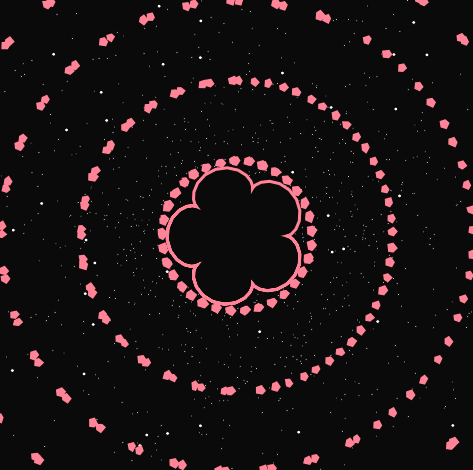
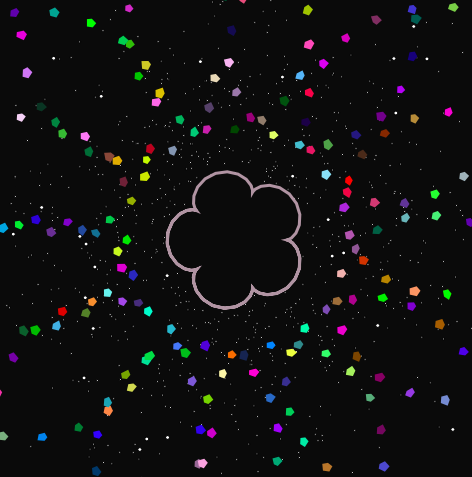
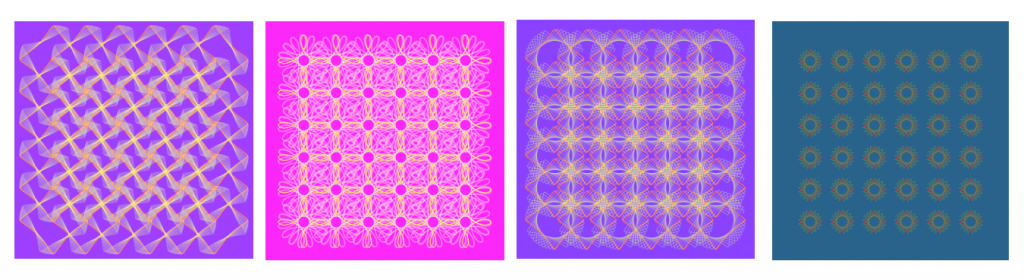
For this project, I wanted to create a wallpaper again, but this time with curves. I decided to use hearts for this, in which the size changes with the mouse coordinates. The white hearts in the background also change in transparency depending on the coordinate of the mouse.

Screenshot of my wallpaper

Project-07-Curves

sketch

var angle=360;

function setup(){
  createCanvas(460,460);
  frameRate(5);
}

function draw(){
  background(43,40,41);
  for (var x = 50; x <= 430; x += 90) {       //curves repetition
    for (var y = 50; y <= 430; y += 90) {
      push();
      translate(x,y);
      stroke(mouseX,100,mouseY);
      curve1();
      stroke(mouseX,200,mouseY);
      curve2();
      pop();
    }
  }
}

function curve1(){     //outer curve
  var x;
  var y;
  var a = map(mouseX, 0, width, 0, 50); 
  var h = map(mouseY, 0, height, 0, 50); 
  var b = a / 10;
  beginShape();
  for (var i = 0; i < angle; i ++) {
    strokeWeight(2);
    noFill();
    var t = map(i, 0, 180, 0, TWO_PI)
    x = (a-b) * cos(t) + h * cos(((a-b)/b) * t);
    y = (a-b) * sin(t) - h * sin(((a-b)/b) * t);
    vertex (x, y)
  }
  endShape(CLOSE);
}

function curve2(){      //inner curve
  var x;
  var y;
  var a = map(mouseX, 0, width, 0, 30); 
  var h = map(mouseY, 0, height, 0, 30); 
  var b = a / 10;
  beginShape();
  for (var i = 0; i < angle; i++) {
    noFill();
    strokeWeight(1);
    var g = map(i, 0, 180, 0, TWO_PI);
    x = (a+b) * cos(g) - h * cos(g * (a+b)/b);
    y = (a+b) * sin(g) + h * sin(g * (a+b)/b);
    vertex(x, y);
  }
  endShape(CLOSE);
}

For this project, I wanted show how it would be possible to show diverse configurations only using two shapes. I tried to play around with the curves to create wallpaper-like patterns. For the interaction, when the mouseX/Y leads to top-right/bottom-left areas, it presents the simplest form while the curves show the most complicated form or nothing when the mouse is on the opposite areas. (color Blue and Orange also resembles the opposite tone of the ocean and the sun)

Project 07: Butterfly Curve

sketchDownload

var n = 100; //Number of points
var r = 50; //Radius

var x = [] //List of X values
var y = [] //List of Y values
var t = [] //Parameter 


function setup() 
{
	createCanvas(480, 480);
	frameRate(60)
	//Initialize Butterfly curve by assigning X, Y and T values
    for (let i = 0; i < n; i++) {
        t[i] = random(0, 180);
        //Equations taken from https://mathworld.wolfram.com/ButterflyCurve.html
        x[i] = r * sin(t[i]) * (exp(cos(t[i])) - 3 * cos(4 * t[i]) - pow(sin(t[i] / 10), 5));
        y[i] = r * cos(t[i]) * (exp(cos(t[i])) - 3 * cos(4 * t[i]) - pow(sin(t[i] / 10), 5));
    }
}


function draw() 
{

    background(0);
    //Make (0,0) center of canvas
    translate(width / 2, height / 2);


    let my = map(mouseY,0,height,18*PI,6*PI); //Map mouse Y to number of rotation iterations of butterflies
    push();
   	noFill();
    stroke(100)
    strokeWeight(0.25)

    //Begin curve for butterfly
    beginShape();
    for (let i = 0; i < my; i += 0.01)
    {
    	//Equations taken from https://mathworld.wolfram.com/ButterflyCurve.html
      	let bx = r * sin(i) * (exp(cos(i)) - 3 * cos(4 * i) - pow(sin(i / 10), 5));
      	let by = r * cos(i) * (exp(cos(i)) - 3 * cos(4 * i) - pow(sin(i / 10), 5));
      	//Vertex has X and Y points corresponding to parametric equations
      	vertex(bx,by)
    }
    endShape();
    pop();

    //Draw flying circles
    push();
    fill(255);
    noStroke();
    //Loop for number of circles
    for (let i = 0; i < n; i++) 
    {
    	let mx = map(mouseX,0,width,-0.005,0.005); //Map mouse X to speed at which parameter changes (from negative to positive speeds)
        t[i] += mx; //Add mapped mouse X to parameter

        //Reset parameter if it exceeds 180 degrees
        if (t[i] > 180)
        {
        	t[i] = 0;
        }

        //Equations taken from https://mathworld.wolfram.com/ButterflyCurve.html
        x[i] = r * sin(t[i]) * (exp(cos(t[i])) - 3 * cos(4 * t[i]) - pow(sin(t[i] / 10), 5));
        y[i] = r * cos(t[i]) * (exp(cos(t[i])) - 3 * cos(4 * t[i]) - pow(sin(t[i] / 10), 5));

        //Draw circle
        circle(x[i], y[i], 3);
    }
    pop();
}

The Butterfly curve seemed really similar to the Lorentz attractor curves I was looking for last week’s Looking Outwards. I initially wanted to make a circle follow the trail of the curve and have the mouseX determine the speed, however I realized that it was actually easier to have multiple circles follow the path.

MouseX controls speed and direction of circles, MouseY controls amount of curve iterations of the butterfly curve.

Project – 07 – Curves

sketch
/* 
 * Amy Lee 
 * amyl2
 * Section B 
 */ 

// Array variables for star X and Y positioning 
var starX = []; 
var starY = []; 
var r = 5; 
var r2 = 10; 
var nPoints = 5; 
var nPoints2 = 10; 
var separation = 120; 

function setup() {
    createCanvas(480,480);
    // Random placement of stars
    for (i = 0; i < 60; i++){
    	starX[i] = random(10,470); 
    	starY[i] = random(10,470); 
    }
    frameRate(7); 
}

function draw() {
	background(10); 

	// Time variable for stars 
	var s = second(); 

	// Setting randomGaussian ellipses in the background 
    push(); 
    translate(width/2,height/2); 
    for (var i = 0; i < 1000; i++){
    	fill(255); 
    	ellipse(randomGaussian(0,120),randomGaussian(0,120),2.2,2.2);
    }
    pop(); 

    // New star every second
    for( i = 0; i < s; i++){
    	fill(255); 
    	ellipse(starX[i],starY[i],4,4); 
    }

	// Calling on Hypotrochoid Function
    push(); 
    noStroke(); 
    translate(width/2,height/2); 
    drawHypotrochoid(); 
    pop();

    // Calling on Ranuculus Function
	drawRanuculus();

	// Drawing hidden alien, only appears when mouse distance from center is < 50
	push(); 
	for(var y = 200; y < 280; y += 5){
		for (var x = 200; x < 280; x += 5){
			noStroke(); 
			fill(173,212,173); 
			if(nearMouse(x,y) == true){
				// Face
				ellipse(241,240,70,70); 
				// Eye 
				fill(255); 
				ellipse(241,240,40,40); 
				// To make eye follow mouseX when mouseX is near 				
				fill(173,212,173); // green iris
				if (mouseX < 256 & mouseX > 230){ 
					ellipse(mouseX,240,25,25);
				} else {
					ellipse(241,240,25,25); 
				}
				// Pupil 				
				fill(0) 
				if (mouseX < 256 & mouseX > 230){ 
					ellipse(mouseX,240,20,20);
				} else {
					ellipse(241,240,20,20); 
				}				
				fill(255); 
				ellipse(248,230,10,10); 
			}
		}
	}
	pop(); 
} 


function drawHypotrochoid() {
	// Setting Hypotrocoid Variables
	for (var t = 0; t < 360; t++){
  		var h = map(mouseY, 0, height/4, height/2, height/4);
    	var a = 150;
    	var b = map(mouseY,0,height/2,1,2);

	var x = (((a-b)*cos(radians(t))) + h*cos(((a-b)/b)*radians(t))); 
	var y = (((a-b)*sin(radians(t))) - h*sin(((a-b)/b)*radians(t)));

	// Draw pentagons 
    beginShape();
    for (var i = 0; i < nPoints; i++) {
    	noStroke(); 
    	// Pentagons change color as mouseY changes 
		if (mouseY <= 80){
			fill(255,142,157); //Red 
		} else if (mouseY > 80 & mouseY <= 160){
			fill(255,210,142); // Orange 	
		} else if (mouseY > 160 & mouseY <= 240){
			fill(255,252,142); // Yellow 	
		} else if (mouseY > 240 & mouseY <= 320){
			fill(192,255,142); // Green 
		} else if (mouseY > 320 & mouseY <= 400){
			fill(142,188,255); // Blue 	
		} else if (mouseY > 400 & mouseY <= 480){
			fill(157,142,255); // Purple	
		} else {
			fill(random(255),random(255),random(255)); 
		}	
		// Setting variables for pentagons
        var theta = map(i, 0, nPoints, 0, TWO_PI);
        var px = r * cos(theta);
        var py = r * sin(theta);
        // Draw pentagon shape with random jitter 
        vertex(x+px + random(-1, 1), y+py + random(-1, 1));
   	}
    endShape(CLOSE);
	}
}

function drawRanuculus() {
	push(); 
	translate(2 * separation, height/2);
	// Setting stroke colors according to how mouseY changes 
		if (mouseY <= 80){
			stroke(255,142,157); //Red 
		} else if (mouseY > 80 & mouseY <= 160){
			stroke(255,210,142); // Orange 	
		} else if (mouseY > 160 & mouseY <= 240){
			stroke(255,252,142); // Yellow 	
		} else if (mouseY > 240 & mouseY <= 320){
			stroke(192,255,142); // Green 
		} else if (mouseY > 320 & mouseY <= 400){
			stroke(142,188,255); // Blue 	
		} else if (mouseY > 400 & mouseY <= 480){
			stroke(157,142,255); // Purple	
		} else {
			stroke(random(255),random(255),random(255)); 
		}	
	strokeWeight(3); 
	fill(10); 
	beginShape();
    for (var i = 0; i < nPoints2; i += 0.1){
      var px2 = r2 * (6 * cos(i) - cos(6 * i));
      var py2 = r2 * (6 * sin(i) - sin(6 * i));
      vertex(px2, py2);
    }
    endShape();
    pop()
}

function nearMouse(x,y){
	if(dist(x,y,mouseX,mouseY) < 50){
		return true;
	} else {
		return false; 
	}
}


For this project, I played around with the Hypotrochoid and Ranuculus curves to create these designs. I wanted to give this an outer space feel, so I also added a Gaussian distribution of ellipses to resemble stars in the background. When the distance of the mouse is close to the center, an alien eye is revealed. The colors of the curves according to the mouseY position and an additional larger star is added every second. It definitely has a chaotic look to it but I thought that it fit the theme since space is far from organized.

Project-07: Spirographs

Interactive Spirographs with the Heart Curve

{scroll to bottom for final p5.js embed}

https://editor.p5js.org/ssahasra/sketches/HZjqQv5Q2

To create my interactive spirograph for this week’s project, my first step was to review existing curves on the Wolfram website and pick one that is simple, but can also give me exciting visuals when I use the combination of mouseX, map(), and constrain() functions.

I chose the Heart Curve, not only because it is an iconic shape/symbol but it’s parametric function allowed me to tweak the shape on all three of it’s curves.

If you notice this image, the cusp or crevice, the tip and the two mirroring bulges are the three curves that can be manipulated.

Using the given starter code, I first replaced the parametric equations and explored different types of curves, including the eight curve and the bean curve.

Finally, after fixing on the heart curve, I used the following parametric equations for the value of x and y:

a1 = 16, a2 = 13 and so on.

In the draw function, I set a1, a2 and a3 as variables and then used the mouseX to control the bulge and cusp of the heart.

Furthermore, I also added the rotate() function to setup, to reveal how the shapes create a spirograph. The frameRate() was also used to control the speed, to see the interactions and mouseX induced changes more clearly.

Here, is a video of an intermediate stage of the program:

One more important aspect of this effect is that I activated the alpha value in the fill() function so the mouseX movement also adds dynamic transparencies similar to “onion layers” in flash.

Project 7: Curves

curves cb
//global variables
var nPoints = 1000;
var angle = 0;

function setup() {
    createCanvas(480, 480);
}

function draw() {
    background(mouseY, 100, mouseX); //change background color
    //draw 2 sets of 36 hypotrochoids 
    for (var x = 80; x <= 400; x += 64) {
        for (var y = 80; y <= 400; y += 64) {
            push();
            translate(x, y);
            drawHypotrochoid1();
            drawHypotrochoid2();
            pop();
        }
    }
}

function drawHypotrochoid1() {
    var a = map(mouseX, 0, 480, 0, 80); //radius of outside circle
    var b = map(mouseX, 0, 480, 0, 20); //radius of inside circle
    var h = map(mouseY, 0, 480, 0, 40); //point distance from center of inner circle

    strokeWeight(.5);
    stroke(mouseX, mouseY, 100); //change stroke color
    noFill();
    beginShape(); //create hypotrochoid
    for (var i=0; i<nPoints; i++) {
        var angle = map(i, 0, 100, 0, TWO_PI);
        x = (a-b) * cos(angle) + h * cos(((a-b)/b) * angle);
        y = (a-b) * sin(angle) - h * sin(((a-b)/b) * angle);
        vertex(x, y);
    }
    endShape();
}

function drawHypotrochoid2() {
    var a = map(mouseX, 0, 480, 2, 80); //radius of outside circle
    var b = map(mouseX, 0, 480, 2, 20); //radius of inside circle
    var h = map(mouseY, 0, 480, 2, 40); //point distance from center of inner circle

    strokeWeight(.35);
    stroke(mouseX, mouseX, mouseY); //change stroke color
    noFill();
    beginShape(); //create hypotrochoid
    for (var i=0; i<nPoints; i++) {
        var angle = map(i, 0, 100, 0, TWO_PI);
        x = (a-b) * cos(angle) + h * cos(((a-b)/b) * angle);
        y = (a-b) * sin(angle) - h * sin(((a-b)/b) * angle);
        vertex(x, y);
    }
    endShape();
}

After exploring the WolframMathWorld site, I found hypotrochoids and thought that they were very dynamic and interesting. I decided to create my project with two sets of overlapping hypotrochoids to create a field of growing flower-like shapes. To make the composition interactive, I coded the mouse position to control the variables and colors of the hypotrochoids as well as the background color.

top left, top right, bottom left, bottom right
other screenshots

Project 07 – Composition with Curves

I wasn’t really inspired by anything this time but I had an idea in mind of a rotating curve that had a trailing effect. I ended up with a variable epicycloid curve, formed by a point traced by a circle’s radius as it rotates around a larger circle. Clicking on the screen adds “petals” to the shape of the curve. At first, I wanted to experiment with a reuleaux triangle and make an animation similar to a rotary engine, but couldn’t figure out the math behind making the triangle follow an eccentric path.

sketch

/*
 * Eric Zhao
 * ezhao2@andrew.cmu.edu
 *
 * Interactive composition with epicycloid curves
 * that changes color with a gradient effect. Click
 * to increase the number of "petals" on the curves.
 *
 */
var numPoints = 75;
var thetaCanvas = 0;
var rotateSpeed = 2;
var multiplier = 2;
var totalScale;
var epicycloid = [];
var baseFill;

function setup() {
    createCanvas(480, 480);
    background(220);
    strokeWeight(2);
    fill(0);
    angleMode(DEGREES);
    colorMode(HSB);
}

function draw() {
        for (let i = 0; i < 10; i++){
        //creates series of nested epicycloid curve objects
        epicycloid[i] = new Object();
        epicycloid[i].shapeScale = 1 - i/10;
        epicycloid[i].a = epicycloid[i].shapeScale * 100;
        epicycloid[i].b = epicycloid[i].a / multiplier;
        epicycloid[i].theta = 0;
    }

    totalScale = map(sin(thetaCanvas), -1, 1, 0.33, 1);
    //makes composition zoom in and out smoothly
    background(0);

    push();
    translate(width/2, height/2);
    rotate(thetaCanvas);
    scale(totalScale);
    for (let i = 0; i < epicycloid.length; i++){
        //slightly offsets hue and rotation of each successive curve
        push();
        rotate(i*10);
        baseFill = ((thetaCanvas + i*10)*2) % 360;
        stroke(baseFill, 100, 100);
        epicycloidCurve(epicycloid[i]);
        pop();
    }
    pop();
    thetaCanvas += rotateSpeed;
}
function epicycloidCurve(e){
    //Epicycloid curve equation
    beginShape();
    for(let i = 0; i <= numPoints; i++){
        e.theta = map(i, 0, numPoints, 0, 360);
        e.x = ((e.a + e.b) * cos(e.theta) - e.b * cos(((e.a + e.b)/e.b) *
        e.theta));
        e.y = ((e.a + e.b) * sin(e.theta) - e.b * sin(((e.a + e.b)/e.b) *
        e.theta));
        curveVertex(e.x, e.y);
    }
    endShape(CLOSE);
}

function mousePressed(){
    //changes number of "petals" in the epicycloid
    multiplier++;
    if(multiplier > 5){
        multiplier = 2;
    }
}


Project-07-Curves

This is based on a hypotrochoid, which is a point rotating around a circle that is rotating around a larger circle. The point is supposed to create a looping pattern around the larger circle. I changed this by having the position of the mouse affect how fast the point would rotate, breaking the looping pattern created by a hypotrochoid. In addition, I also had the mouse affect the speed at which the inner circle was rotating around the outer circle and the distance the point is from the inner circle. It is a little activity where you can try to fill in the backgroudn with the blue but it is challenging because the point in always rotating and affected by the mouse position.

sketch

var r = 0 // rotation angle of outer circle
var r1 = 0 // rotation angle for inner circle
function setup() {
    createCanvas(480, 480);
    background(0);
    strokeWeight(0);
}

function draw() {
    fill(255);
    textSize(20);
    text('Fill in the background!',0,20);
    translate(width/2,height/2);
    scale(.8);
    speedr = map(mouseX,0,480,0,3,true);
    rotate(radians(r));
    r += speedr
    outercircle();
    innercircle();

    function innercircle(){
      push();
      fill(0,255,0);
      translate(0,170);
      speedr1 = map(mouseY,0,480,1,5,true);
      rotate(radians(r1));
      r1 += speedr1
      circle(0,0,60);
      point();
      pop();

      function point(){
        fill(0,0,255);
        cdistance = map(mouseX,0,480,20,150);
        circle(0,cdistance,30);
      }
    }
    function outercircle(){
      fill(255,0,0);
      circle(0,0,400);
    }
}

Project 07: Composition with Curves

I decided to go with a butterfly curve because I thought it looked cool. Because of the name, I decided to make my project a butterfly flying in the sky. For the background, I just reused my clouds that I made for last week’s deliverables. Instead of having them move depending on what minute it was, I just set a constant to add to the x values of the ellipses the clouds were made of.

butterflyDownload
var translateX;
var translateY;
var nPoints=1000;
var butterfly=true;
var cloudScale=[0.5, 0.75, 1, 1.25, 1.5];
var x=0;
var dx=0.1;

function setup() {
    createCanvas(480, 480);
    translateX=width/2;
    translateY=height/2;
}

function draw() {
    background(222, 245, 253);
    drawClouds();
    push();
    translate(translateX, translateY);
    drawButterfly();
    pop();
}

function drawButterfly(){
    //Butterfly curve https://mathworld.wolfram.com/ButterflyCurve.html
    //this draws a butterfly curve to make the butterfly
    beginShape();
    scale(50);
    strokeWeight(0.02);
    stroke(255, 200);
    var x;
    var y;
    var angle=radians(map(mouseY, 0, height, 0, 360)); //rotation depends on mouseY
    rotate(angle);
    var m=map(mouseX, 0, width, 0, 25); //the size/extent of the curve of the butterfly depends on mouseX
    for (var i=0; i<nPoints; i++){
        var t=map(i, 0, nPoints, 0, m*TWO_PI); //var m is multiplied times the upper limit of the map function
        x=sin(t)*(exp(cos(t))-2*cos(4*t)+pow(sin((1/12)*t), 5));
        y=cos(t)*(exp(cos(t))-2*cos(4*t)+pow(sin((1/12)*t), 5));
        vertex(x, y);
        fill(228, 198, 245, 150);
    }
    endShape();
}

function mousePressed(){
    //changes position depending on where you click
    translateX=mouseX;
    translateY=mouseY;
}

function drawClouds(){
    //smallest cloud--cloud 1
    push();
    fill(250, 250);
    noStroke();
    scale(cloudScale[0]);
    translate(500,100);
    cloud();
    pop();

    //cloud 2
    push();
    fill(250, 250);
    noStroke();
    scale(cloudScale[1]);
    translate(100, 250);
    cloud();
    pop();

    //cloud 3
    push();
    fill(250, 250);
    noStroke();
    scale(cloudScale[2]);
    translate(400, 350);
    cloud();
    pop();

    //cloud 4
    push();
    fill(250, 250);
    noStroke();
    scale(cloudScale[3]);
    translate(0, 50);
    cloud();
    pop();

    //cloud 5
    push();
    fill(250, 250);
    noStroke();
    scale(cloudScale[4]);
    translate(-50, 250);
    cloud();
    pop();
}

function cloud(){
    ellipse(x+30, 10, 60, 40);
    ellipse(x+40, 40, 90, 50);
    ellipse(x, 40, 100, 50);
    ellipse(x, 15, 55, 35);
    x=x+dx;
    //once the clouds go off the screen, they reappear on the other side
    if(x>width){
        x=0;
    }
}

It rotates depending on where mouseY is and also draws the curve as mouseX goes from left to right.

You can also click to change the origin of the image and move the butterfly around.

Project 7 Curves Composition

There are two hypotrochoids that are being drawn simultaneously in this program, as Mouse Y changes you can alter the pedals of the hypotrochoids., the lines redraw themselves every 3 loops around the circle so as you move Mouse Y around you begin to get an overlay of various patterns.

sketch
//tjchen 
// section a 
// 07 project composisiton with curves
var t = 0
var numPoints = 100;// global set up of num of points on circle
var lineX = [];
var lineY = [];
var lineX2 = [];
var lineY2= [];
function setup() {
    createCanvas(480, 480);
    background(0);
    strokeWeight(1);
    stroke(255);
    noFill();
}


function draw() {
    background(0);
    translate(width/2,height/2)
    stroke(255,0,0);
    draw_hypotrochoid_1(t);
    stroke(0,255,0);
    draw_hypotrochoid_2(t);
    t+=1; 
}


function draw_hypotrochoid_1(t){
    var a = 150; // radius of large circle 
    var b = 8; // radius of spinning circle 
    var h = mouseY/10; // location of fixed point 
    var xH= (a-b) * cos (radians(t)) + h * cos(((a-b)/b)*(radians(t)));
    var yH = (a-b) * sin (radians(t)) - h * sin(((a-b)/b)*(radians(t))); 
    circle(xH,yH,10);;
    lineX.push(xH);
    lineY.push(yH);
    if (radians(t)>4*PI){ // 4 trips around the circle before redrawing circle 
        lineX.shift();
        lineY.shift();
    }
    strokeWeight(1);
    for (i=0; i < lineX.length-1; i++){
        line(lineX[i], lineY[i], lineX[i+1], lineY[i+1]);
    }


} 

function draw_hypotrochoid_2(t){
    var a2 = 200; // radius of large circle 
    var b2 = 8; // radius of spinning circle 
    var h2 = mouseX/10; // location of fixed point 
    var xH2= (a2-b2) * cos (radians(t)) + h2 * cos(((a2-b2)/b2)*(radians(t)));
    var yH2 = (a2-b2) * sin (radians(t)) - h2 * sin(((a2-b2)/b2)*(radians(t))); 
    circle(xH2,yH2,10);;
    lineX2.push(xH2);
    lineY2.push(yH2);
    if (radians(t)>4*PI){ // 4 trips around the circle before redrawing circle 
        lineX2.shift();
        lineY2.shift();
    }
    strokeWeight(1);
    for (i=0; i < lineX2.length-1; i++){
        line(lineX2[i], lineY2[i], lineX2[i+1], lineY2[i+1]);
    }


} 
the Circle transitioning
curves in one composition

curves in another composition