Project 06 Abstract Clock

In this project the aim was to create various patterns based on numerical operations on the values of time it self. The resulting clock behaves more like a timer, that resets every 20 seconds. There are in reality 6 different types of patterns that can be created based on manipulating the numeric value of seconds, but by overlaying two 10 second patterns, there begins to be a higher level of nuance to the resulting geometries.

sketch
//tjchen
//section a
//abstract clock

var angle = 0;
var r = 0; // distance from center 
var framecount= 0;

function setup() {
    createCanvas(480, 480);
    background(0);
    noStroke();
    frameRate(60);
}

function draw() {
//map time to color
    var minutecolor = map(minute(),0,59,0,255);
    var secondcolor = map(second(),0,59,0,255);
//reset's stopwatch after 20 seconds 
    if(second()%20==0){
        fill(0);
        square(0,0,width);
    }
//new pattern every 10 seconds
    if (second()%10 === 0){
        angle=0;
        r = 0 ;
        framecount = 0;
    }
    var cenX = (width/2);
    var cenY = (height/2);
//draw circles 
    push();
    translate(cenX,cenY);
    x = r*cos(radians(angle));
    y = r*sin(radians(angle));
    fill(random(255),minutecolor,secondcolor);
    circle(x,y,3);
    r += 0.75;
// creates circle pattern 
    angle += map(second(),0,59,0,360); 
    pop();
    framecount+=1
}

Looking Outward 06

“Collage with Squares Arranged according to the laws of Chance” By the DaDaist artist Jean (Hans) Arp, is a seemingly ordered yet disorganized collage composed of torn up pieces of colored paper on a grey background. For many DaDaist artists, found objects and chance encounters became an extremely important aspect of their creative process as they saw it as a way to break from from the traditional elements that defined artistic practices like intention, craft and control. This was the DaDaist approach to the ever increasing rational/ industrializing world that was developing around them. During the composition of the piece, Arp, alledgedly got frustrated by the original drawing he was working on and tore up the paper, dropping them on to the floor. This “accident”, a purely random encounter, in turn became the ultimate form of expression for the piece he created. Nothing, humanly composed or created will have as much of an accurate portrayal of expression, (an idea artists have been exploring for centuries) than the landing and fluttering down of the paper pieces. In the end I think what makes the concept of randomness powerful in computational and generative art is that it allows a certain degree of looseness. This looseness, formerly could not be found elsewhere in the art and design world. Everything was about intention and structure. Yet, randomness subverts those ideals and allows for the art to have a certain degree of agency away from the creator, breathing itself into life.

Untitled (Collage with Squares Arranged according to the Laws of Chance), Jean (Hans) Arp
(French, born Germany (Alsace). 1886–1966),

Project-06

sketch


function setup() {
    createCanvas(480, 480);
    background(220);
    text("p5.js vers 0.9.0 test.", 10, 15);
}

function draw() {
	background(0, 150, 250); //sky blue
	var s = second();
	var m = minute();
	var h = hour();
	var d = day();
	noStroke();

	//water
	fill(0, 0, 230); //water blue
	rect(0, 180, 480, 220);
	//waves
    for (var a = 0; a <= width; a = a+1) {
    	for (var b = 200; b <= 450; b = b+50) {
    	stroke(0, 0, 150);
    	strokeWeight(1);
    	point(a, b - 15 * sin(radians(a)));	
        }
    }
    fish(200, 250);
    fish(400, 300);
    fish(60, 275);
    
    //sand
    noStroke();
    fill(170, 100, 20) //darker brown, shows up as water receeds
    rect(0, 380-h*2, 480, 400);
	fill(185, 122, 40); //lighter brown with dots in the sand
	rect(0, 380, 480, 120);
	for (var sx = 20; sx <= width; sx = sx+40) {
		for (var sy = 400; sy <= height; sy = sy + 40) {
        stroke(223, 182, 112); //lightest brown
        strokeWeight(3);
        point(sx, sy);
		}
	}
	for (sx = 40; sx <= width; sx = sx + 40){
		for (sy = 420; sy <= height; sy = sy + 40){
			point(sx, sy);
		}
	}
	crab(s*8, 440);
	sun(m*8, 70);
	cloud(400, 50);
	cloud(50, 75);
	boat(d*13, 170);

}


function crab(x, y) {
	push();
	translate(x, y);
	noStroke();
	fill(230, 0, 0);
	ellipse(0, 0, 30, 20);
	fill(255);
	ellipse(-8, -9, 5, 5);
	ellipse(8, -9, 5, 5);
	fill(0);
	ellipse(-8, -9, 3, 3);
	ellipse(8, -9, 3, 3);
	stroke(230, 0, 0);
	strokeWeight(4);
	line(-10, 5, -25, 20);
	line(10, 5, 25, 20);
	line(-15, 0, -25, 5);
	line(15, 0, 25, 5);
	pop();
}

function fish(x, y) {
	push();
	translate(x, y);
	noStroke();
	fill(225, 0, 225); //light purple
	ellipse(0, 0, 30, 15);
	triangle(15, 0, 25, -10, 25, 10);
	fill(255);
	circle(-8, 0, 5);
	fill(0);
	circle(-8, 0, 3);
	pop();
}

function sun(x, y) {
	push();
	translate(x, y);
	noStroke();
	fill(255, 255, 0);
	circle(0, 0, 45);
	stroke(255, 150, 0);
	strokeWeight(7);
	line(30, 0, 50, 0);
	line(-30, 0, -50, 0);
	line(0, 30, 0, 50);
	line(0, -30, 0, -50);
	rotate(radians(45));
	line(30, 0, 50, 0);
	line(-30, 0, -50, 0);
	line(0, 30, 0, 50);
	line(0, -30, 0, -50);
	pop();

}

function boat(x, y) {
	push();
	translate(x, y);
	noStroke();
	fill(185, 122, 40); //main sand brown
	arc(0, 0, 60, 60, 0, PI, CHORD);
	rect(-5, -50, 5, 50);
	fill(255);
	triangle(0, -50, 0, -10, 30, -10);
	triangle(-5, -50, -5, -10, -30, -10);
	pop();
}

function cloud(x, y) {
	push();
	translate(x, y);
	noStroke();
	fill(240);
	circle(0, 0, 45);
	circle(25, 10, 25);
	ellipse(0, 20, 75, 20);
	pop();
}

I made this based on a beach scene. The crab moves across the sand with the seconds, the sun moves across the sky with the minutes, the water recedes with the hours, exposing the darker brown (wet) sand below it. The boat moves based on the day.

Abstract Clock

sketch.6.slDownload
// Sarah Luongo
// Section A

// This code aims to tell time via a buttefly, with the body filling to blue every second, purple dots being added every minute, and the background changing every hour.

var r = 12;
var g = 16;
var b = 30;

function setup() {
    createCanvas(400, 400);
}

function draw() {
    // Background changes different shades of blue every hour
    H = hour();
    // Black - medium blue from 12 AM - 7 AM
    if (H<8){
        background(r*H, g*H, b*H);
    // Medium blue - light blue from 8 AM - 4 PM
    } else if (H >= 8 & H <= 16) {
	background(r*H, g*H, 245*H);
    // Light blue - dark blue from 5 PM - 11 PM
    } else {
        background(192 - (r+13)*(H-16), 255 - (g+20)*(H-16), 255 - b*(H-16));
    }

    translate(width/2, height/2);
    // Pink wings for the butterfly
    fill(255, 50, 123);
    butterflyW();

    // Body of the butterfly
    fill(0); // Black
    ellipse(0, 0, 6, 100);

    // Body filling to a blue color every second
    fill(120, 150, 160);
    var S = map(second(), 0, 59, 0, 100);
        ellipse(0, 0, 6, S);

    // Purple dots added every minute
    fill(75, 0, 110);
    rotate(radians(45));
    for (var j = 0; j < minute(); j++) {
	// Bottom right wing
	if(j <= 15) {
	    circle(j*12+13, 0, 10);
	// Top left wing 
	} else if(j <= 30) {
	    circle(-(j-15)*12-7,0,10);
	// Bottom left wing
	} else if (j <= 45) {
	    rotate(radians(90));
	    circle((j-30)*12+7,0,10);
	    rotate(radians(-90));
	// Top right wing
	} else {
	    rotate(radians(90));
	    circle(-(j-45)*12-7,0,10);
	    rotate(radians(-90));
	}
    }
}

function butterflyW() {
    var da = PI/100;
    beginShape();
    for (var i = 0; i <= 2*PI; i += da) {
	var w = sin(2*i) * width/2;
	var x = w * cos(i);
	var y = w * sin(i);
	vertex(x, y);
    }
    endShape(CLOSE);
}

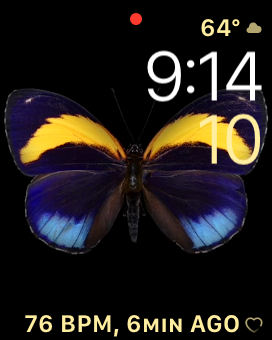
I wanted to do a butterfly to tell time for this project because I was inspired by one of the many faces on my apple watch. Also, I used to love catching butterflies when I was younger (and letting them go of course). I think there are a lot of beautiful butterflies out there. I would’ve like to do a more exquisite butterfly, but I felt it was better to try and have the assignment requirements down before designing anything too crazy. I was happy to at least show a little design to the butterfly with the addition of purple dots every minute.

Project : 06

sketch
/*Aadya Bhartia
Section A 
abhartia@cmu.edu*/

//initializing arrays to hold x and y position of candy based on hours 
var candyX = [0,0,25,-25,-8,43,-42,15,-21,40,-45,6,12];
var candyY = [0,47,40,40,18,18,18,12,2,-5,-10,-15,-20];
var minX = 90;
var minY = 90;
var secX = 260;
var secY = 380;
var hr = 0;

function setup() {
    createCanvas(500, 500);
    background(255, 217, 206);
}
function draw() {
	background(255, 217, 206);
	var s = second();
	var m = minute();
	var h = hour();
	var angle = 0;
	var secR = s/60;
	var minR = m/60;
	//seconds 
	fill(139, 170, 173,90);
	noStroke();
	ellipse(secX, secY, 177*secR); //circle increasing in size for seconds
	stroke(64, 78, 92);
	strokeWeight(1/20*s);
	noFill();
	arc(secX,secY,200, 200, 0 , 2*PI * secR);
	stroke(146, 55, 77);
	strokeWeight(1/6*s); //stroke gets thicker based on seconds
	noFill();
	arc(secX,secY,184, 184, 0 ,2*PI * secR);
	fill(221, 117, 150);
	noStroke();
	rect(secX+82,secY-8,200,10); //bar for seconds 
	//minutes 
	fill(221, 117, 150);
	noStroke();
	rect((minX-3),(minY +62),6,400);//base for the candy ball to count minutes 
	push();
	noFill();
	strokeWeight(1/5*m);
	stroke(113, 10, 53);
	translate(minX,minY);
	ellipse(0, 0, 140); //base for the candy ball to count minutes
	stroke(0);
	strokeWeight(1);
	//hour
	hr = h%12; // number of candy in the ball count the hours 
	candy(hr);
	pop();
	//minutes counted with hearts in a 6 by 10 grid 
	var ctr = [];
	var counter = 0;
	for(var i = 0;i<60;i++){ //creating an array to store all possible minutes 
		ctr.push(i);
	}
	for(var x = 1;x<7;x++){
		for(var y = 1;y<=10;y++){
			push();
			translate(320,8);
			if(counter == m){
				fill(255); //white colour for current minute 
				heart(25*x,25*y);
			}
			else{
				fill(221, 117, 150,random(100,200));
				heart(25*x,25*y);
			}
			pop();
		counter+=1;
		}
	}
}
//candy helps count the hours 
function candy(hr){
	for(var j = 1; j<=hr;j++){//candy globe effect given by the predefined array counting the hours
		fill(random(100,200),random(0,50),random(20,70));
		ellipse(candyX[j],candyY[j],35);
	}
}
function heart(minX,minY){ //creating hearts which count the minutes 
	ellipse(minX-4,minY,9);
	ellipse(minX+4,minY,9);
	triangle(minX-8,minY+2,minX+8,minY+2,minX,minY+10)
}
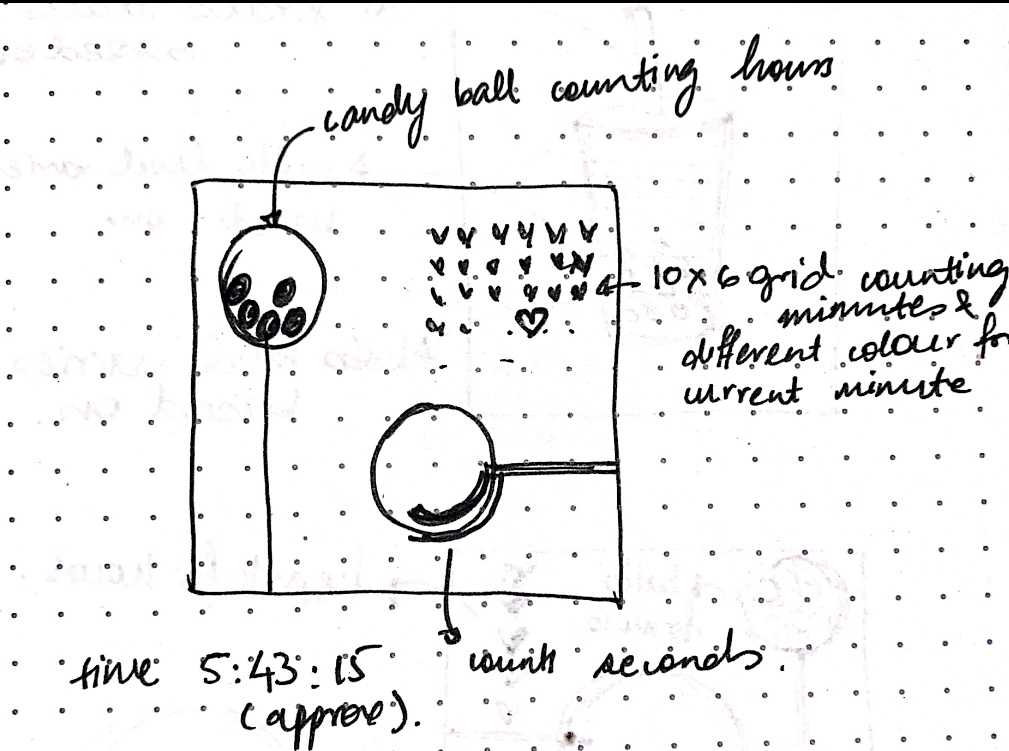
For this project, I decided to create something which had elements of a candy store the seconds are calculated through the circle on the bottom right, the minutes by the candy globe shell and by the hearts while the hours are shown through the number of candy balls in the globe.

Looking Outwards : 06

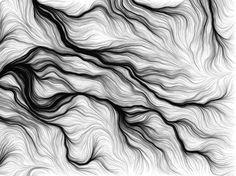
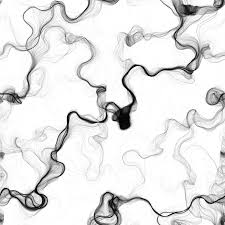
Perlin noise was created by Ken Perlin in 1983 for a film he was working on, Tron. 35 years ago, Ken Perlin won an academic award for discovering the technique now called “Perlin Noise.” Perlin noise is described as a type of gradient noise that interpolates random values to create smooth transitions through the noise function. It helped him add randomness to CG renderings of natural elements like smoke, fire, and water. Its flexibility in mathematical expressions allowed perlin noise to be used to create a wide variety of textures that imitate the controlled random appearance of textures in nature.

In our architecture studio under Dana Cupkova, we are exploring randomness using keyshotand other rendering tools such as grasshopper and kangaroo and it was extremely interesting to read about a similar concept but in a different perspective altogether. I was extremely inspired by how random yet sophisticated his textures look and surprised that something computer generated could still have that level of detail. In real life we take textures like this for granted and do not realise the amount of work that goes into creating smooth transitions.

LO-06: Randomness

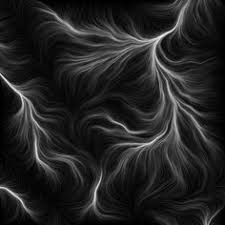
The project I chose to focus on this week is Tim Knowles’ Civita 24 hour Balloon Drawing. I admire this artwork because of its uniqueness. Knowles’ method of incorporating randomness made his final piece very unconventional but also very simple. To make his drawing, Knowles attached a pen to a helium balloon whose motions were “randomly” generated by the wind movements during the day which drew on a 24 meter long slowly moving paper throughout the day. Although wind movements are not completely random, there was a lot of variability in his final 24-meter long drawing which highlighted the balloon’s “random” movements. Knowles’ artistic sensibilities are manifested in the final piece since, like many of his other artworks, he incorporates nature as an art tool to produce very simple but unique pieces.

Civita 24 Hour Balloon Drawing (Tim Knowles, 2001)

Project-06-Abstract Clock

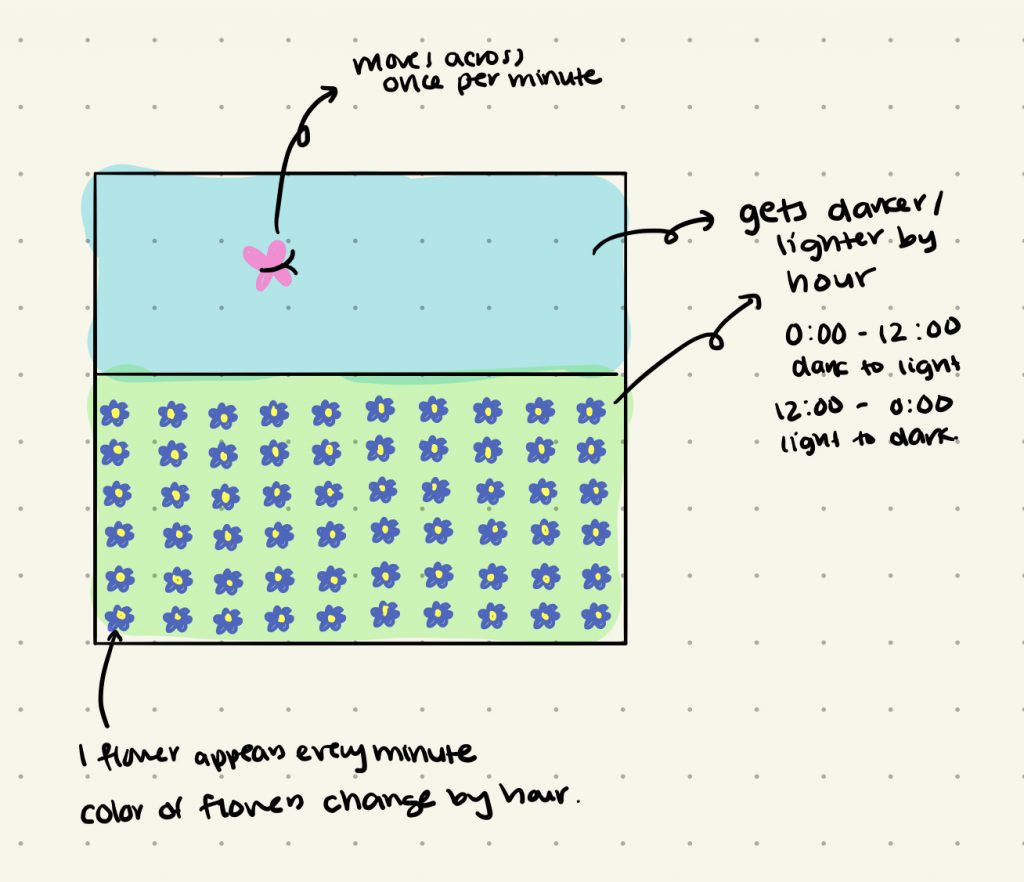
For my abstract clock, I decided to use the concept of a flower garden. The flowers appear once per minute and change color every hour. I also wanted to incorporate day and night in my clock so I made the sky and grass get lighter and darker depending on the hour of the day (ex: from midnight to noon, they get lighter). To incorporate seconds, I added a butterfly that takes 1 minute to move completely across the canvas (flying forward every second).

sketch
var flowerX = []; // flower x positions
var flowerY = []; // flower y positions
var flowerColor = []; // 24 colors (different color per hour)
var grass = []; // stores shade of grass (changes once per hour)
var sky = []; // stores shade of sky (changes once per hour like grass)

// flower r, g, b
var flowerR = 80; 255, 136, 136
var flowerG = 0;
var flowerB = 215;

// grass r, g, b
var grassR = 10; 
var grassG =  90;
var grassB = 30;

// sky r, g, b
var skyR = 25; 
var skyG = 50; 
var skyB = 90;

// butterfly positions
var butterflyX = 0;
var butterflyY = 60;

function setup() {
    createCanvas(480, 400);
    for(var i = 0; i < 24; i ++) { // initialize arrays of elements that change every hour
    	flowerColor[i] = color(flowerR, flowerG, flowerB);
    	grass[i] = color(grassR, grassG, grassB);
    	sky[i] = color(skyR, skyG, skyB);

    	if(i > 12) { // gets darker past noon (day to night)
    		grassR -= 3;
	    	grassG -= 11;
	    	grassB -= 5;
	    	
	    	flowerG += 9;
	    	flowerR -= 10;

	    	skyR -= 10;
	    	skyG -= 12;
	    	skyB -= 14;
    	}
    	else { // gets brighter from midnight (night to day)
    		grassR += 3;
	    	grassG += 11;
	    	grassB += 5;
	    	
	    	flowerB += 10;

	    	skyR += 10;
	    	skyG += 12;
	    	skyB += 14;
    	}
    }
    for(var i = 0; i < 60; i ++) { // once per minute
    	if(i%10 == 0) { // first column of flowers
    		flowerX[i] = 60;
    	}
    	else { // all other columns
    		flowerX[i] = flowerX[i - 1] + width/12;
    	}
    	if(i <= 9) { // first row of flowers
    		flowerY[i] = 2*height/5;
    	}
    	else { // all other rows
    		flowerY[i] = flowerY[i - 10] + width/12;
    	}
    }
}

function drawFlower() {
	// petals
	noStroke();
	var theta = 0;
	var x = 10*cos(radians(theta));
	var y = 10*sin(radians(theta));
	for(var i = 0; i < 8; i ++) {
		rotate(radians(theta));
		ellipse(x, y, 10, 10);
		theta += 45;
	}
	// center
	fill("yellow");
	circle(0, 0, 13);
}

function drawButterfly() {
	fill(255, 192, 204);
	ellipse(0, 0, 20, 20);
	ellipse(0, 20, 20, 20);
	noStroke();
	fill(255, 170, 180);
	ellipse(15, 0, 30, 35);
	ellipse(15, 20, 30, 35);
	stroke(87, 39, 26);
	strokeWeight(4);
	line(-6, 10, 26, 10);
	strokeWeight(2);
	line(26, 10, 36, 5);
	line(26, 10, 36, 15);
}

function draw() {
	noStroke();

	// background changes by hour
	background(sky[hour()]);
	//background(sky[12]);

	// grass changes by hour
	fill(grass[hour()]);
	//fill(grass[12]);
	rect(0, height/3, width, 2*height/3);

	// draw flower once per minute 
	for(var i = 0; i < minute(); i ++) {
		push();
		translate(flowerX[i], flowerY[i]);
		fill(flowerColor[hour()]);
		//fill(flowerColor[12]);
		drawFlower();
		pop();
	}

	// butterfly moves across screen once per minute
	push();
	translate(map(second(), 0, 60, -15, width + 10), butterflyY);
	drawButterfly();
	pop();
}


sketch on goodnotes

Looking Outwards – 06

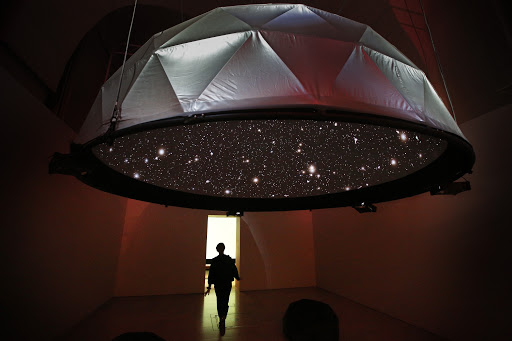
Black Shoals Stock Market Planetarium, by Joshua Portway and Lise Autogena, was a project created in 2001 to represent stock market trades live. The biggest draw to this project for me was that it was two artists’ representation of the stock market, and I had just got into trading this past summer myself. On their website they describe components of the stock market as creatures that have unique “DNA” code and each traded company represents a star. The positions of these companies started out randomly positioned, but eventually drifted together over time into clusters, constellations, and nebulae. When a star is flashing it means someone just sold or bought a trade, and these trades produce food for the creatures in the “environment” the artists created. The bigger the trade, the more food is produced. The title was based on the “Black Scholes” formula which was attempting to accurately estimate the current value of a share. Two of the three mathematicians, who by the way won (all three) a Nobel Prize for this formula, went on to start a company called, “Long Term Capital Management”. Moral of this story is the company ended chaotically which almost brought the US stock market down. There are many parallels between biology, history, and the stock market that truly make this a unique and inspirational piece. I am not doing it a justice with this short blog, so I would definitely recommend checking out their website (posted below) describing the piece.

http://www.blackshoals.net/the-project-1

LONDON, ENGLAND – DECEMBER 02: A visitor walks past the ‘Black Shoals: Dark Matter’ projection at the Big Bang Data exhibition at Somerset House on December 2, 2015 in London, England. The projection displays stars which represent live stock market activity. The show highlights the data explosion that’s radically transforming our lives. It opens on December 3, 2015 and runs until February 28, 2016 at Somerset House. (Photo by Peter Macdiarmid/Getty Images for Somerset House)

LookingOutwards-05

A tech company named Ethmode recently developed a program to design garment in 3D in order to reduce textile waste in the fashion industry. The program is used to build generative designs, visualize material and customize silhouettes through languages such as JavaScript. Beyond providing photo-realistic renders of the garment that help to decide the basic design, the program also offer sophisticated animation on the the movement, drape and stretch of the garments.
Credited to this tech agency, manufacturers in Bangladesh are able to reduce 40% of physical sampling by implementing 3D digital design process. Handful of brands started to work on customized clothing through this digital realm to create gowns and customized sneakers.

Link to the article: https://eco-age.com/magazine/how-3d-digital-design-and-augmented-reality-can-slash-textile-waste-fashion/