Project-07-Curves (Fireworks)

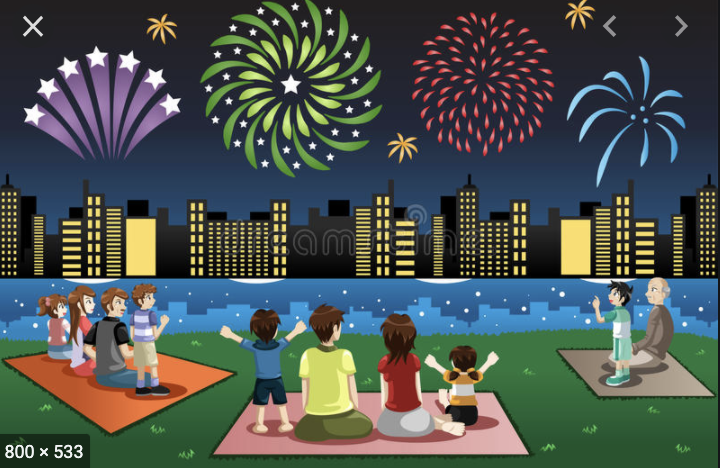
For my project, I wanted to incorporate these curves so that it served a purpose to the image. I did not want to simply create curves and just submit random shapes. I thought that the curve I wanted to use would suit the appearance of fireworks very well. It was difficult at first to figure out how to create these fireworks because I originally wanted them to burst and then disappear/fall down as real fireworks do. However, I decided to just have the fireworks growing and changing colors because I wanted the curves to constantly be seen. I based my project off of a cartoon image of a Fourth of July fireworks celebration, and that is why I put a person on a picnic blanket on the grass so that it would make more sense. I think the easiest part for me was making the city skyline and the person’s body because I have continuously layered shapes in all my projects. I think the most difficulty I had was creating the fireworks, while also making them different enough so that it actually seemed like real unpredictable fireworks. As mouseX or mouseY moves, colors of the fireworks can change, and the size and patterns move based on the mouse movement.

sketch
//Annie Kim
//anniekim@andrew.cmu.edu
//SectionB
//anniekim-07-project ~ CURVES ~ 

xStar = []; //array for stars
yStar = [];

function setup() {
    createCanvas(480, 440);
    background(10, 23, 45); //dark blue sky
    for (i = 0; i < 60; i ++) {
    	xStar[i] = random(0, 480); //randomly placing stars
    	yStar[i] = random(0, 240);
    }
    frameRate(10);
}
function draw() {
	//moon
    fill(245);
    noStroke();
    circle(360, 50, 40);
    fill(10, 23, 45);
    circle(350, 50, 40);

    var s = second(); //stars popping up every second
    for (i = 0; i < s; i ++) {
    	fill(255);
    	ellipse(xStar[i], yStar[i], 2, 2); //stars
    }
//orange OR yellow firework
    push();
    translate(250, 80);
    if (mouseX > 240) { //mouseX right half -> yellow
    	stroke(218, 218, 100);
    } else { //mouseX left half -> orange
    	stroke(218, 100, 100);
    }
	firework1(); 
	pop();
    //purple or pink firework
	push();
	translate(450, 45);
	if (mouseY < 240) { //mouseY top half -> pink
		stroke(135, 105, 170);
	} else { //mouseY bottom half -> purple
		stroke(105, 85, 255);
	}
	firework2();
	pop();
	//blue firework
	push();
	translate(30, 50);
	stroke(136, 194, 223);
	firework3();
	pop();
    //pink and red firework
	push();
	translate(200, 200);
	if (mouseX < 240) { //mouseX left half -> pink
		stroke(180, 70, 180); 
	} else { //mouseX right half -> red
		stroke(255, 120, 150);;
	}
	firework4();
	pop();
	//green or dark green firework
	push();
	translate(440, 180);
	if (mouseX > 240) { //mouseX right half -> dark green
		stroke(155, 165, 130);
	} else {
		stroke(205, 255, 180);
	}
	firework5();
	pop();
	
	//~~~~~CITY~~~~~
	//buildings in black
	fill(0); 
	noStroke();
	rect(0, 260, 480, 40); //base
	rect(0, 220, 20, 80);
	rect(145, 200, 15, 100);
	rect(225, 230, 15, 70);
	rect(310, 200, 25, 100);
	//city buildings FILLED BY YELLOW
	fill(250, 250, 160);
	stroke(0);
	strokeWeight(8);
	rect(20, 240, 30, 60);
	rect(50, 210, 25, 90);
	rect(75, 230, 20, 70);
	rect(95, 250, 30, 50);
	rect(125, 220, 20, 80);
	rect(160, 215, 20, 85);
	rect(180, 200, 20, 100);
	rect(200, 200, 25, 100);
	rect(240, 250, 30, 50);
	rect(270, 230, 40, 70);
	rect(335, 220, 15, 80);
	rect(350, 240, 30, 60);
	rect(380, 190, 20, 110);
	rect(400, 220, 20, 80);
	rect(420, 230, 40, 70); 
	rect(460, 260, 20, 40);//rightmost building
    //START OF WINDOW MAKING(separated by building in code)
	strokeWeight(8);
	stroke(0);
	//building #1
	line(62, 215, 62, 300);
	line(55, 230, 70, 230);
	line(55, 245, 70, 245);
	line(55, 263, 70, 263);
	line(55, 280, 70, 280);
    //building #2
	strokeWeight(4);
	line(270, 240, 310, 240);
	line(270, 250, 310, 250);
	line(270, 260, 310, 260);
	line(270, 270, 310, 270);
	line(270, 280, 310, 280);
	line(270, 290, 310, 290);
    //building #3
	line(410, 220, 410, 295);
	line(400, 240, 420, 240);
	line(400, 260, 420, 260);
	line(400, 280, 420, 280);
    //building #4
    line(425, 230, 425, 295);
	line(430, 230, 430, 295);
	line(435, 230, 435, 295);
	line(440, 230, 440, 295);
	line(445, 230, 445, 295);
	line(450, 230, 450, 295);
	line(455, 230, 455, 295);
	line(420, 250, 460, 250);
	line(420, 270, 460, 270);
	line(420, 290, 460, 290);
    //building #5
    strokeWeight(6);
	line(180, 215, 200, 215);
	line(180, 225, 200, 225);
	line(180, 235, 200, 235);
	line(180, 245, 200, 245);
	line(180, 255, 200, 255);
	line(180, 265, 200, 265);
	line(180, 275, 200, 275);
	line(180, 285, 200, 285);
    //building #6
	strokeWeight(3);
	line(200, 232, 225, 232);
	line(200, 267, 225, 267);
	line(212.5, 200, 212.5, 295);
    //END OF WINDOW MAKING
	//grass
	fill(42, 83, 47);
	noStroke();
	rect(0, 299, 480, 141);

	//picnic blanket
    fill(220, 125, 145); //pink color
    stroke(185, 100, 100); //darker pink color outline
    quad(150, 340, 310, 340, 330, 400, 130, 400); //blanket
    //PERSON SITTING ON BLANKET
    //arms
    fill(230, 200, 170);
    noStroke();
    rect(170, 340, 8, 30);
    rect(212, 340, 8, 30);

    //pants
    fill(104, 104, 55); 
    noStroke();
    ellipse(185, 380, 45, 25);
    ellipse(205, 380, 45, 25);
    //shirt
    fill(234, 234, 131);
    noStroke();
    rect(177.5, 313, 35, 57);
    ellipse(195, 369, 38, 9);
    rect(170, 320, 10, 20);
    rect(210, 320, 10, 20);
    //shoulders
    circle(177.5, 321, 15);
    circle(212.5, 321, 15);
    //sleeve lines
    stroke(200, 200, 100);
    strokeWeight(2); 
    line(178, 327, 178, 340);
    line(212, 327, 212, 340);
    //neck
    fill(200, 170, 140);
    noStroke();
    rect(190, 305, 10, 8);
    //head shape
    fill(230, 200, 170);
    ellipse(195, 295, 23, 28);
    //hair
    fill(80, 45, 25);
    ellipse(195, 285, 25, 20);
    ellipse(191, 290, 20, 30);
    triangle(195, 288, 207, 288, 195, 303);
    //ear
    fill(230, 200, 170);
    stroke(200, 180, 140);
    strokeWeight(1);
    ellipse(200, 295, 4, 7);
}

function firework1() { //yellow-orange firework
	var x;
	var y;
	var a = map(mouseY, 0, height, 0, 20);
	var h = map(mouseY, 0, height, 0, 20);
	var b = a / 4;
	var angle = 360;
	beginShape();
	for (var i = 0; i < angle; i ++) {
		strokeWeight(0.2);
		noFill();
		var q = map(i, 0, 180, 0, TWO_PI);
		x = (a - b) * cos(q) + (h) * cos(((a + b)/ b) * q);
		y = (a - b) * sin(q) + (h) * sin(((a + b)/ b)* q);
		vertex(x, y);
	}
	endShape(CLOSE);
}

function firework2() { //purple-pink firework
	var x;
	var y;
	var a = map(mouseY, 0, height, 0, 35);
	var h = map(mouseY, 0, height, 0, 35);
	var b = a / 8;
	var angle = 360;
	beginShape();
	for (var i = 0; i < angle; i ++) {
		strokeWeight(0.2);
		noFill();
		var q = map(i, 0, 180, 0, TWO_PI);
		x = (a - b) * cos(q) + h * cos(((a + b)/ b) * q / 2);
		y = (a - b) * sin(q) + h * sin(((a + b) / b) * q / 2);
		vertex(x, y);
	}
	endShape(CLOSE);
}

function firework3() { //blue firework
	var x;
	var y;
	var a = map(mouseX, 0, 240, 0, 20);
	var h = map(mouseY, 0, 240, 0, 20);
	var b = a / 15;
	var angle = 360;
	beginShape();
	for (var i = 0; i < angle; i ++) {
		strokeWeight(0.08);
		noFill();
		var q = map(i, 0, 180, 0, TWO_PI);
		x = (a - b) * cos(q) + h * cos(((a + b)/ b) * q);
		y = (a - b) * sin(q) + h * sin(((a + b) / b) * q);
		vertex(x, y);
	}
	endShape(CLOSE);
}
function firework4() { //pink-red firework
	var x;
	var y;
	var a = map(mouseX, 0, 400, 0, 50);
	var h = map(mouseY, 0, 400, 0, 40);
	var b = a / 20;
	var angle = 360;
	beginShape();
	for (var i = 0; i < angle; i ++) {
		strokeWeight(0.2);
		noFill();
		var q = map(i, 0, 180, 0, TWO_PI);
		x = (a - b) * cos(q) + h * cos(((a + b)/ b) * q);
		y = (a - b) * sin(q) + h * sin(((a + b) / b) * q);
		vertex(x, y);
	}
	endShape(CLOSE);
}
function firework5() { //green-dark green firework
	var x;
	var y;
	var a = map(mouseX, 0, 240, 0, 18);
	var h = map(mouseX, 0, 240, 0, 18);
	var b = a / 7;
	var angle = 360;
	beginShape();
	for (var i = 0; i < angle; i ++) {
		strokeWeight(0.4);
		noFill();
		var q = map(i, 0, 180, 0, TWO_PI);
		x = (a - b) * cos(q) + h * cos(((a + b)/ b) * q);
		y = (a - b) * sin(q) + h * sin(((a + b) / b) * q);
		vertex(x, y);
	}
	endShape(CLOSE);
}


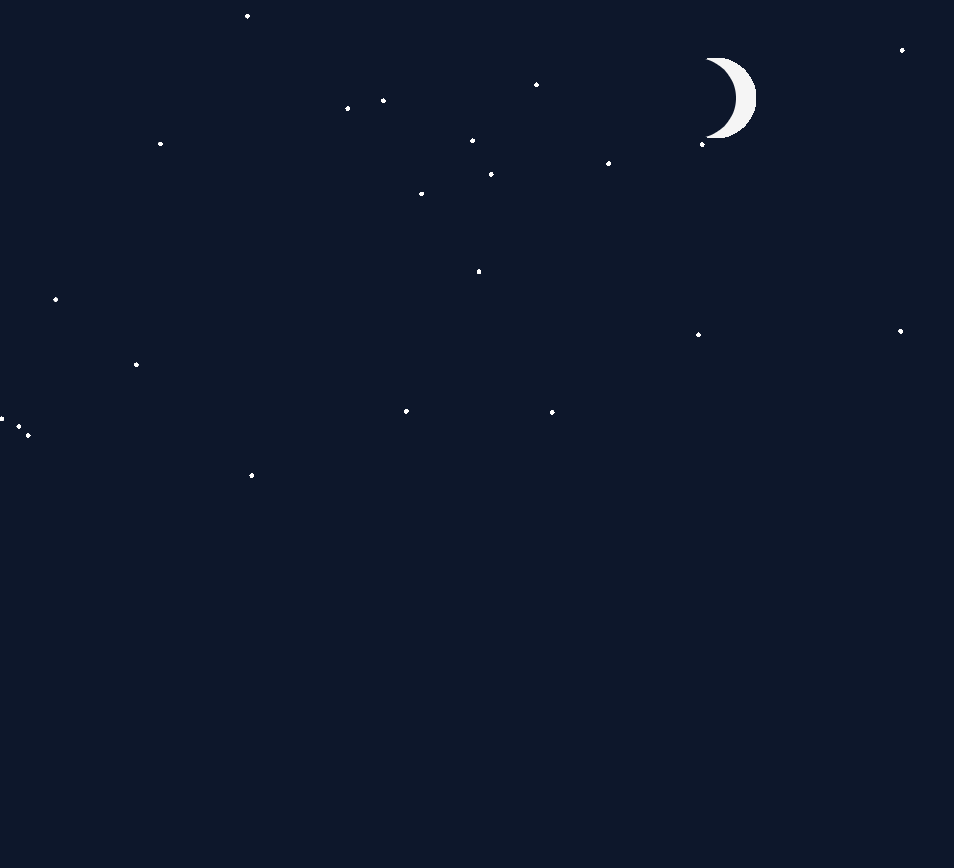
This was the starting process where I made the night sky, and added a moon and stars. The stars add with seconds, so every star represents a second.
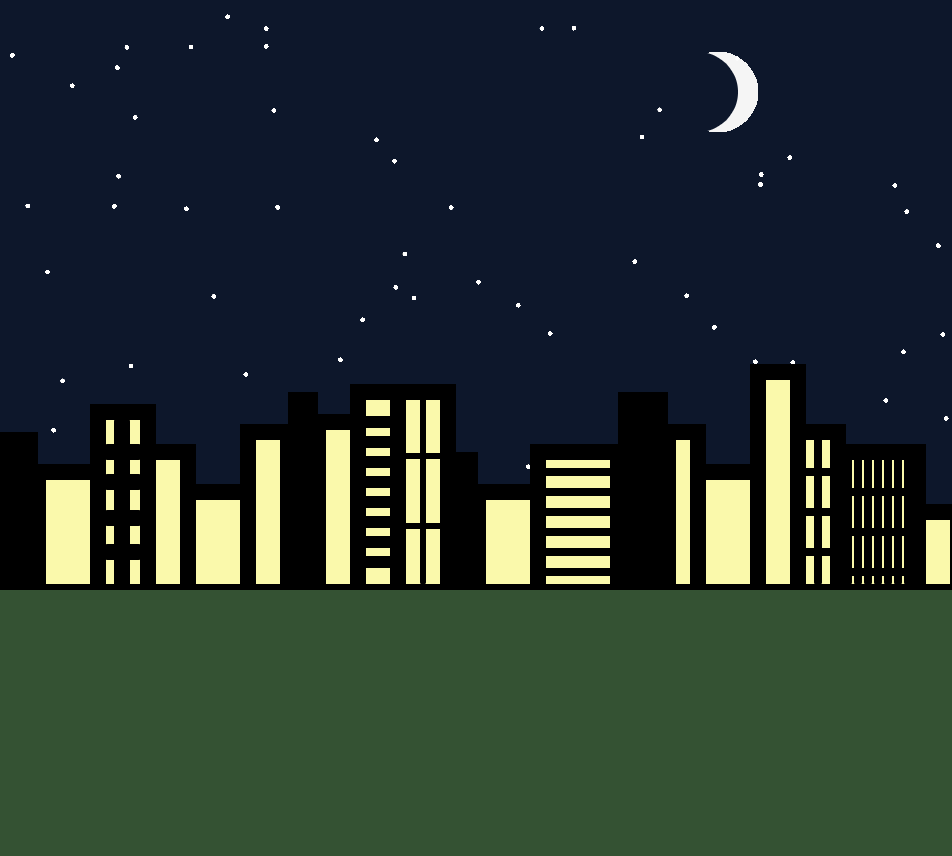
This was after I made the city skyline, I started by making rectangles of different sizes with a yellow fill and black stroke outline. I made the windows by putting black lines over the yellow fills.
This was my inspiration/reference for the fireworks project. I didn’t do nearly as much as in this image, but I did base a lot of ideas from this.

Project-07-Curves

For this project I explored the conchoid of de Sluze curve. I thought this curve was interesting because it reflects different curves across a vertical access depending on if the equation is multiplied by a positive or negative “a”. This reminded me of a galaxy being pinched and forming from space matter so I added a rocket and stars into the background. It also looks like a planet is forming from space matter. The colors change based on the mouse position, the sizes of the curves also change based on mouse position, and when you keep your mouse pressed you can make the right half of the curve (changed “a” value).

graanak-07
//Graana Khan 
//Section B 
// 07 - Project - Curve Composition 

var p = 500; //number of points
var x;
var y;
var a;

function setup() {
    createCanvas(480, 480);
    background(0);
}

function draw() {

//drawing the conchoid curve
	push();
	translate(width/2, height/2);
	scale(25);
	conchoid();
	pop();

//adding the stars in the background 
	stars(50, 50);
	stars(230, 350);
	stars(400, 400);
	stars(380, 100);
	stars(200, 150);
	stars(460, 240);
	stars(70, 430);
	stars(100, 270);
	stars(300, 300);

//rocket in corner
	x = 70;
	y = 400;
	rocket();
	
}

//function for the conchoid of de Sluze 
function conchoid(){
	beginShape();
	stroke(mouseX-200, mouseY-100, 200); //color changes on mouse position 
	strokeWeight(0.01);
	noFill();

	//creating loop for the curves 
	for(var i =0; i < p; i++){
		var t = map(i, 0, p, 0, 2*PI);

		if(mouseIsPressed){  //a values switch from positive to negative if mouse is pressed
			a = mouseX/100;
		} else {
			a = -1*(mouseX/50);
		}

		//equations are from https://mathworld.wolfram.com/ConchoidofdeSluze.html
		x = ((1/cos(t)) + (a*cos(t)))* cos(t);
		y = ((1/cos(t)) + (a*cos(t)))* sin(t);
		vertex(x,y);
	}
	endShape();
}

//function for making the stars 
function stars(x,y){
	stroke(255);
	line(x, y-5, x, y+5);
	line(x-5, y, x+5, y);
}

//rocket in the corner 
function rocket(){
	push();
	translate(x,y);
	rotate(radians(45));
	noStroke();
	fill(255);
	rect(0, 0, 14, 28, 2);
	triangle(0, 0, 7, -13, 14, 0);
	triangle(0, 8, 0, 16, -4, 16);
	triangle(14, 8, 14, 16, 18, 16);
	stroke(255, 0, 0);
	line(2, 30, 2, 40);
	line(11, 30, 11, 42);
	stroke(244, 128, 11);
	line(5, 30, 5, 45);
	stroke(244, 238, 11);
	line(8, 30, 8, 37);
	noStroke();
	fill(0);
	circle(7, 10, 8);
	pop();
}

Project 7: Curves

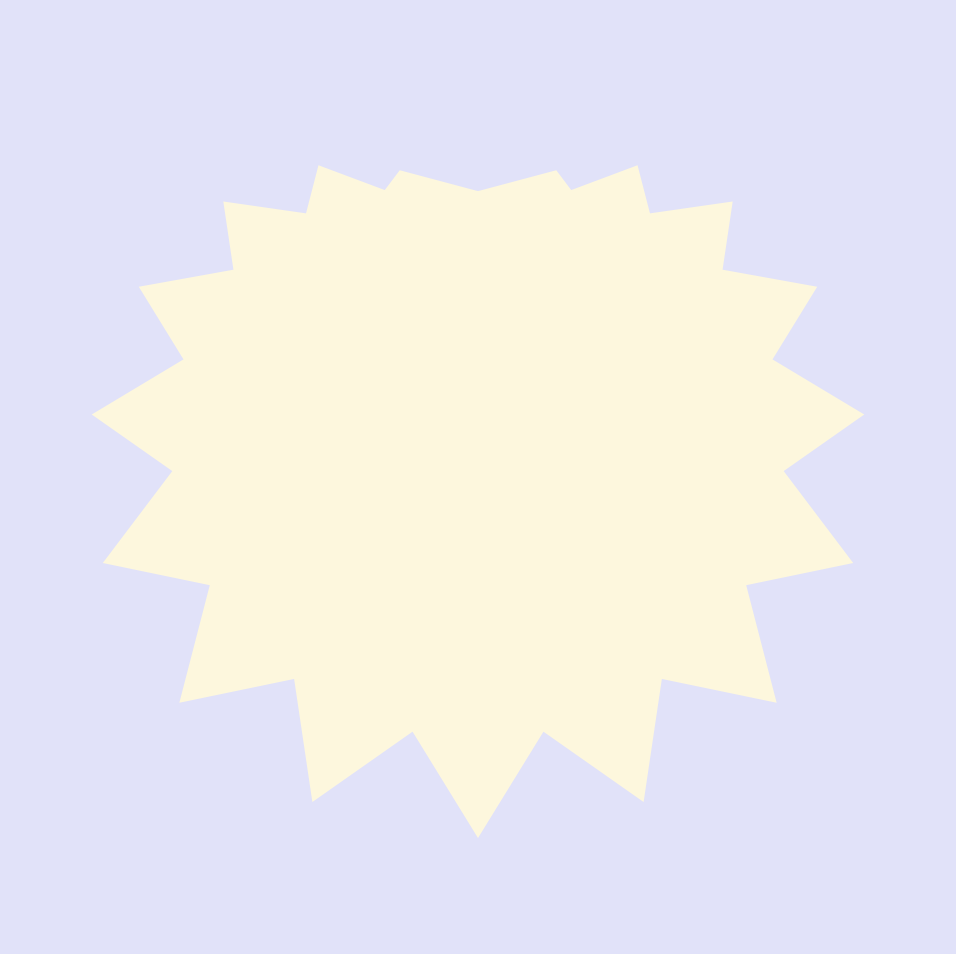
I was really drawn to the rounded curves of the Cardioid and wanted to see how much I could alter this shape based on my mouse’s position. Based on your mouse’s position on the canvas, the Cardioid will change in shape and color.

curves
var nPoints = 100;
var CARDIOID = 0;
var curveMode = CARDIOID;

function setup() {
    createCanvas(480, 480);
    noStroke();
    frameRate(20);
    pinkColor = color(255, 179, 184);
    paleGreen = color(236, 255, 214);
    paleBlue = color(224, 222, 255);
    yellowColor = color(254, 255, 222);
}

function draw() {
    //change color of background depending on MouseY
    let changeBG = map(mouseY, 0, height, 0, 1);
    var changeColor = lerpColor(paleGreen, paleBlue, changeBG);
    background(changeColor);

    //drawing the cardioid
    push();
    rotate(-(PI/2.0));
    translate(-width/4.0, height/2);
    switch (curveMode) {
        case CARDIOID:
            drawCardioidCurve();
            break;
    }
    pop();
}

function drawCardioidCurve() {
    //Cardioid: https://mathworld.wolfram.com/Cardioid.html
    //x = a cos t(1 - cos t)
    //y = a sing t(1 - cos t)

    var x;
    var y;
    var a = 150.0;
    var stifleMouse = constrain(mouseX/2.5, 0, width);

    //changing cardioid color
    let changeShape = map(mouseY, 0, height, 0, 1);
    var shapeColor = lerpColor(pinkColor, yellowColor, changeShape);
    fill(shapeColor);

    //cardioid shape
    beginShape();
    for (var i = 0; i < nPoints; i++) {
        var t = map(i, stifleMouse, nPoints, 0, TWO_PI);
        x = a * cos(t) * (1 - cos(t));
        y = a * sin(t) * (1 - cos(t));
        vertex(x, y);
    }
    endShape(CLOSE);
}

Looking Outwards 07: Information Visualization

A visualization of human development levels in 2013.

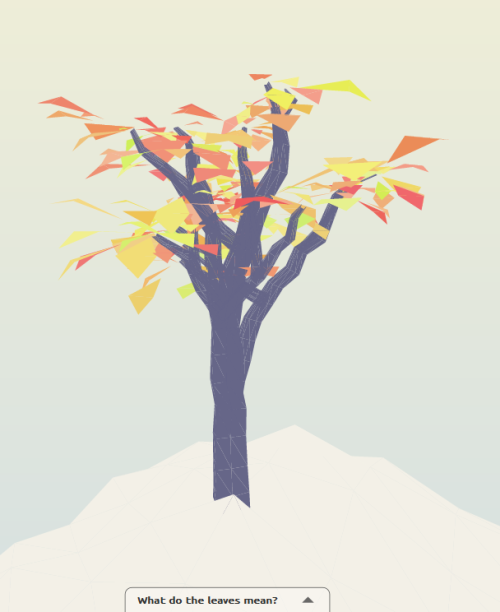
For this week’s Looking Outwards, I was drawn to Dutch creative developer Jurjen Verhagen’s online data visualization Human Development Tree, an interactive platform that lets users visualize a level of human development based on set conditions of life expectancy, expected years of education, mean years of education, a country’s GDP, the country’s ideals on gender equality, and a color of your choice. Based on your input, the platform will reveal
your “ideal tree” with leaves. Leaves that fall off the tree represent current countries that don’t meet your conditions in 1985. More leaves grow back on tree as the data visualization progresses to the year 2013.

You can change the color of the tree’s leaves.

I thought this project was a super fascinating way to combine data and gamification in a fun but educational way. This visualization taught me a lot about human development and how much the world has changed since 1985, as well as leave me curious on how the tree’s leaves would have changed since 2013. I’m really curious on what kinds of algorithms Verhagen combined with
his beautiful 3D models, and if he ever plans on updating this project to reflect data from 2020.

Interact with the data visualization here.

Project 07: Composition with Curves

My process to create this project began with doing research on various geometric curves. Once I found the Conchoid of de Sluze, I found that it had this unique directional quality and, if translated to the middle of the canvas, neatly divided it in half. After making the curve flip based on the x-position of the mouse, I decided to make the bulge of the curve responsive to the y-position of the mouse. Then, I would draw another curve ( a cardiod cartacaustic) with a flashing background in the half of the canvas the Conchoid of de Sluze was not occupying. In this way, the Conchoid of de Sluze was acting as a revealing element. Afterwards, to add some visual interest, I added a random function to the vertexes of each curve to create a jittery animated effect.

Project 7 – CurvesDownload


function setup() {
    createCanvas(480, 480);
    background(220);
    text("p5.js vers 0.9.0 test.", 10, 15);
}

function draw() {
	background(0);
	if (mouseX >= width/2){
		noStroke();
		fill(random(200,255),random(100,255),0);
		rect(0,0,width/2,height);
		push();
		translate(width/4,height/2);
		//rotate(radians(45));
		cardioidCatacaustic();
		pop();
	} else {
		noStroke();
		fill(random(100,255),0,random(200,255));
		rect(width/2,0,width/2,height);
		push();
		translate(3*width/4,height/2);
		rotate(radians(180));
		cardioidCatacaustic();
		pop();
	}
	push();
	translate(width/2,height/2);
	conchoid();
	pop();
}

function conchoid() {
	//https://mathworld.wolfram.com/ConchoidofdeSluze.html
	var x;
	var y;
	var r;
	var a = constrain(mouseY,10,240);
	fill("red");
	beginShape();
	for(var i = 0; i < 200; i++){
		var t = map(i,0,200,-PI,3*PI);
		if(mouseX <= width/2){
			r = -(1/cos(t) + a*cos(t));
		} else{
			r = (1/cos(t) + a*cos(t));
		}
		x = r*cos(t);
		y = r*sin(t);
		vertex(x + random(-2,2),y + random(-2,2));
	}
	endShape();
}

function cardioidCatacaustic() {
	https://mathworld.wolfram.com/CardioidCatacaustic.html
	var x;
	var y;
	var xe;
	var ye;
	var strokeVal =.2;
	var a = 60;
	noFill();
	stroke(0);
	strokeWeight(strokeVal);
	beginShape();
	for(var i = 0; i < 200; i++){
		var t = map(i,0,200,-PI,PI);
		x = a*(1 + cos(t))*cos(t);
		y = -a*(1 + cos(t))*sin(t);
		vertex(x + random(-2,2),y + random(-2,2));
	}
	endShape(CLOSE);
}

Looking Outwards 07: Information Visualization

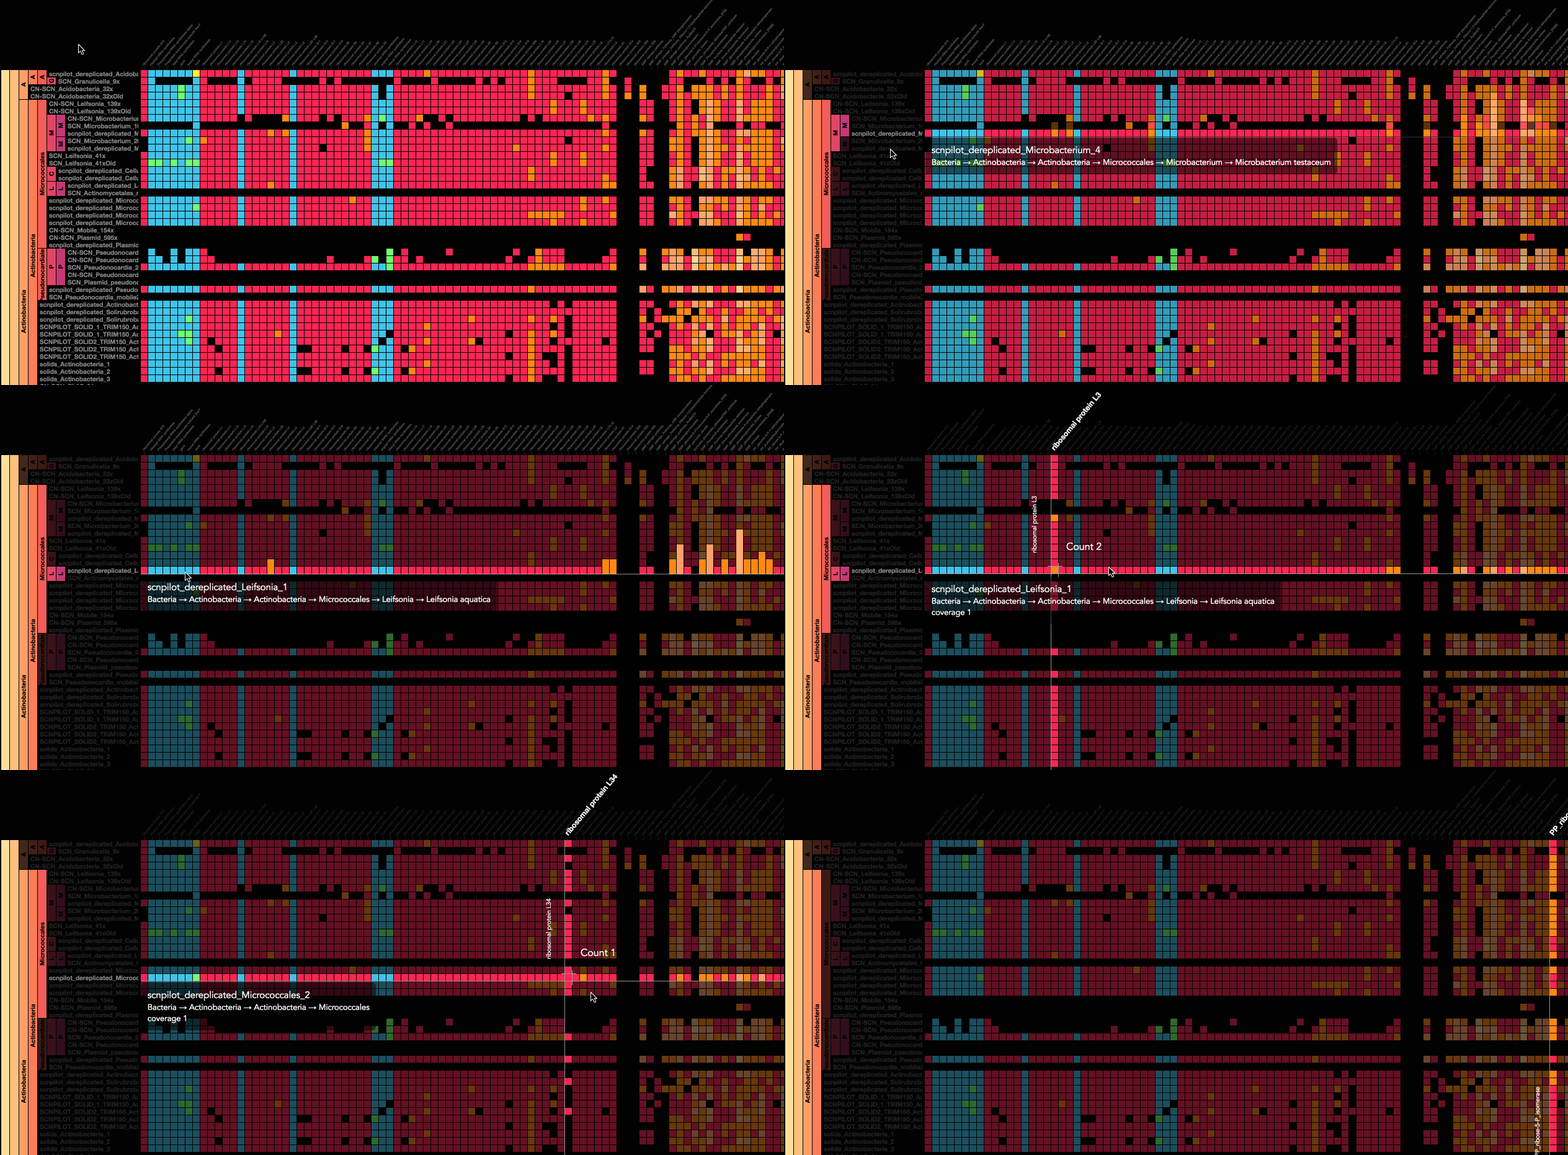
A work of computational information visualization that I find intriguing is Stamen Design’s “Metagenomics with the Banfield Lab.” This project came about when the Banfield Lab asked Stamen Design to visualize their data about gene sequences in an ecosystem. I admire the clarity of the visual result because it takes what would normally be considered complex data and arranges it in a way that is easy to access and read. I suppose that the artwork was generated by sorting the data into a matrix and visualizing the data as squares. Stamen Design’s artistic sensibilities are manifested in the final form because they created a clear and readable visualization of data while being visually interesting.

Gif of Stamen Design’s “Metagenomics with the Banfield Lab”

Project 7 – Composition with Curves

it’s an avocadooooooooo… thaaaaanksss…

sketch
var nPoints = 100;

function setup() {
    createCanvas(300, 480);
    background(220);
    text("p5.js vers 0.9.0 test.", 10, 15);
    frameRate(10);
}

function draw() {
    background(198, 179, 220);
    //Avocado
    push();
    translate(width * 0.6, height * 0.5);
    rotate(radians(30));
    cranoidCurve();
    pop();
    //Avocado face
    face();
    //Avocado pit
    moon();
    //Stars move with mouse
    push();
    translate(mouseX - 200, 30);
    star();
    pop();
    push();
    translate(100, mouseY + 80);
    scale(0.5);
    star();
    pop();
}

function cranoidCurve() {
    var x;
    var y;
    var r;
    var a = 40;
    var b = 60;
    var c = 70;
    var p = constrain((mouseX / width), 0, 1);
    var q = constrain((mouseY / height), 0, 1);
    stroke(77, 135, 2);
    strokeWeight(10);
    fill(195, 238, 139);
    beginShape();
    for(var i = 0; i < nPoints; i++) {
        var t = map(i, 0, nPoints, 0, TWO_PI);
        r = a * sin(t) +
            b * sqrt(1 - p * sq(cos(t))) +
            c * sqrt(1 - q * sq(cos(t)));
        x = r * cos(t);
        y = r * sin(t);
        vertex(x, y);
    }
    endShape(CLOSE);
}

function face() {
    noFill();
    stroke(0);
    strokeWeight(2);
    arc(200, 190, 5, 5, radians(210), radians(30));
    arc(220, 200, 5, 5, radians(210), radians(30));
    arc(205, 210, 10, 10, radians(50), radians(190));
}

function moon() {
    //Moon/Avocado pit gets bigger as x increases with mouse
    var x = max(min(100 + mouseX, width), 10);
    var sizeX = x * 3 / 10;
    var r = 300 - mouseX;
    var g = 300 - mouseX;
    var b = 30;
    noStroke();
    fill(r, g, b);
    circle(mouseX - 100, mouseY - 30, sizeX);
}

function star() {
    fill(240, 255, 135);
    frameRate(10);
    var x = [50, 61, 83, 69, 71, 50, 29, 31, 17, 39];
    var y = [18, 37, 43, 60, 82, 73, 82, 60, 43, 37];
    var nPoints = x.length;
    beginShape();
    //Squiggly star
    for (var i = 0; i < nPoints; i++) {
        vertex (x[i] + random(-3, 3), y[i] + random(-3, 3));
    }
    endShape(CLOSE);
}

While exploring different types of curves, I was inspired by the cranioid curve, which strongly resembles an avocado shape when interacted with.

Project – 07

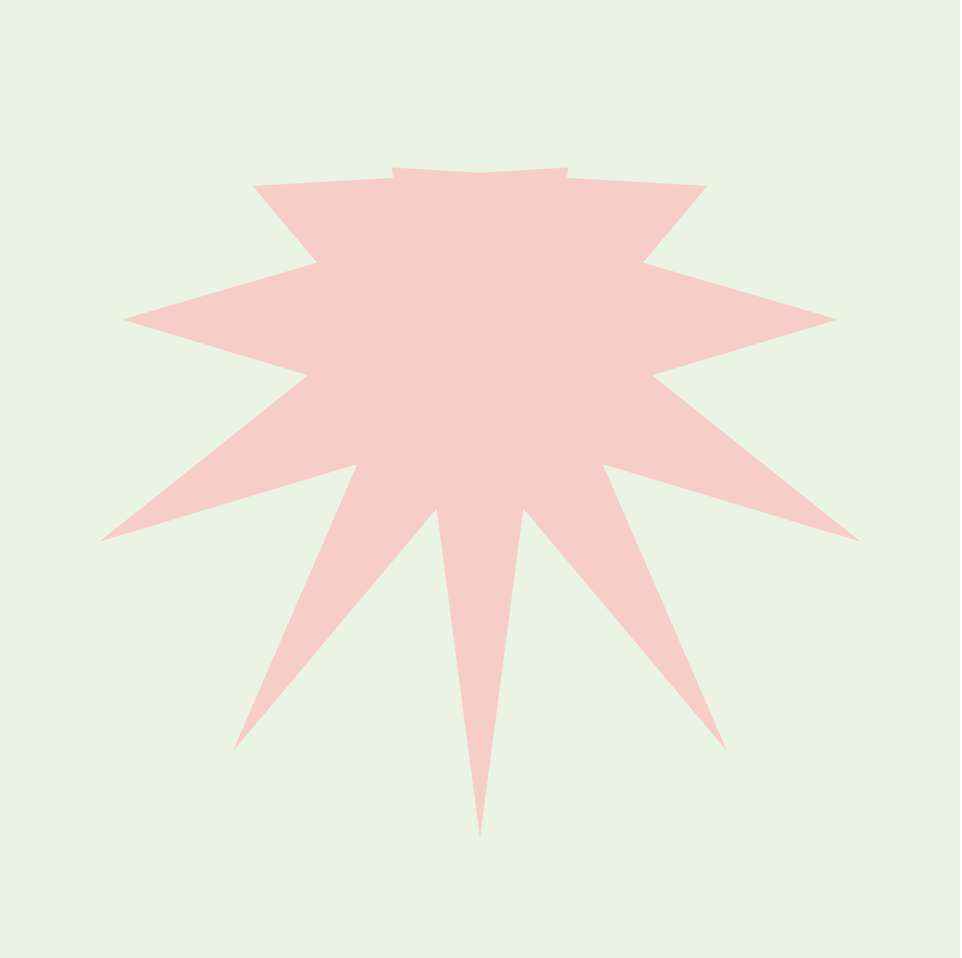
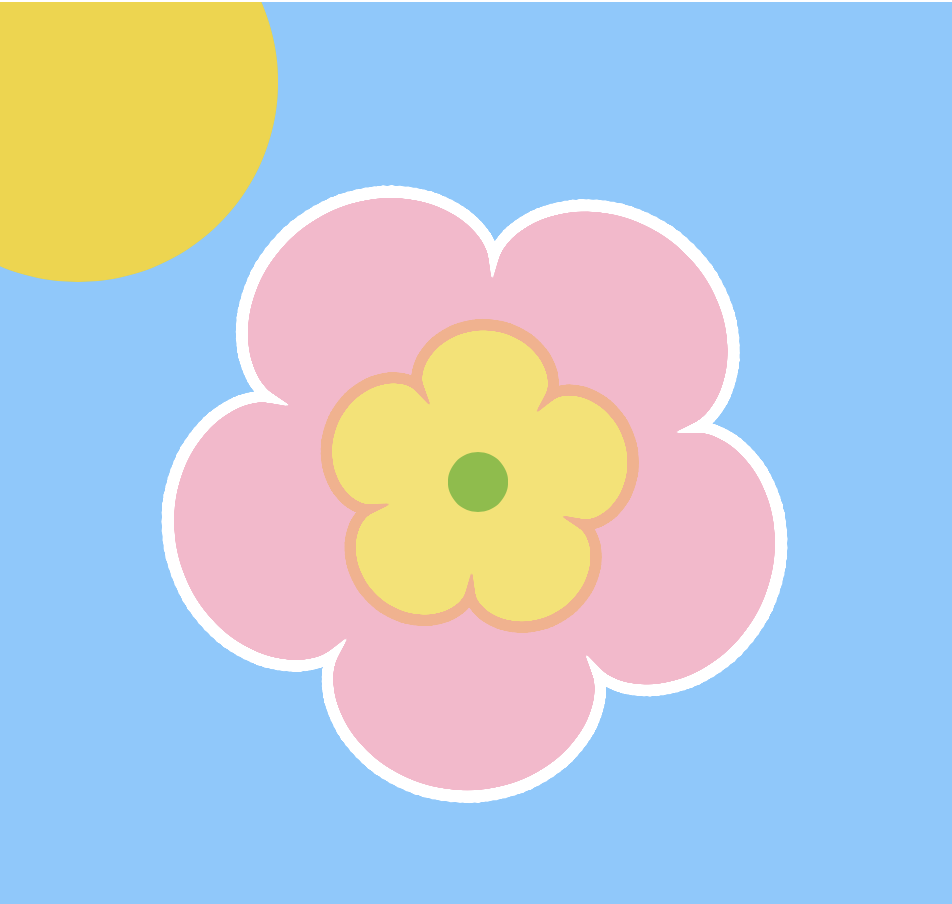
I chose to use the Ranunculoid Curve to create my project. When making it I noticed that the curve looks like a star when small with a larger stroke weight, so I set up my project to switch from day and night to see a star turn into a flower created by ranunculoid curves.

shapesDownload
var n = 50 //number of cusps
var angleRan1 = 0 //rotation of pink flower
var angleRan2 = 0 //rotation of yellow flower

function setup() {
    createCanvas(480, 480);
    background(220);
    frameRate(20);
}

function draw() {
	background(31, 45, 97); // night sky
	translate(width/2, height/2);
	//moon
	push();
    noStroke();
    fill(255);
    circle(-100, -150, 100);
    fill(31, 45, 97);
    circle(-75, -150, 100);
    pop(); 
	stroke(255);
	strokeWeight(5);
	push(); // rotate ranunculoid
	rotate(radians(angleRan1));
    angleRan1 += mouseY;
	drawRanun1();
	pop();
	push();
	rotate(radians(angleRan2));
	angleRan2 += mouseY + 90
	drawRanun2();
	pop();
	if (mouseX >= 100) {
		noStroke();
		fill(129, 191, 54);
		circle(0, 0, 30);
		//sun
		fill(240, 213, 36);
		circle(-200, -200, 200)
	}
}

//Ranunculoid Curve
function drawRanun1 () {
    //x = a[6cost-cos(6t)] y=a[6sint - sin (6t)] <- parametric equations
    var aRan1 = mouseX/50
    if (aRan1 <= 2) {
    	fill(251, 252, 182); //yellow when it is a star shape
    }else {
    	background(130, 201, 255); // day time
    	fill(252, 182, 203); //pink when its a flower shape
    }
    //curve
    beginShape();
    for(var i = 0; i < n; i += 0.1){
    	var xRan1 = aRan1 * (6 * cos(i) - cos(6 * i));
    	var yRan1 = aRan1 * (6 * sin(i) - sin(6 * i));
    	vertex(xRan1, yRan1);
    }
    endShape();
}
//inner flower
function drawRanun2 () {
	strokeWeight(5);
	fill(245, 226, 100);
	var aRan2 = mouseX/100
	if (aRan2 < 2) {
		stroke(255);
	} else {
		stroke(250, 175, 137);
	}
	//curve
	beginShape();
	for(var i = 0; i < n; i += 0.1) {
		var xRan2 = aRan2 * (6 * cos(i) - cos(6 * i));
    	var yRan2 = aRan2 * (6 * sin(i) - sin(6 * i));
    	vertex(xRan2, yRan2);
	}
	endShape();
}

LO- 07

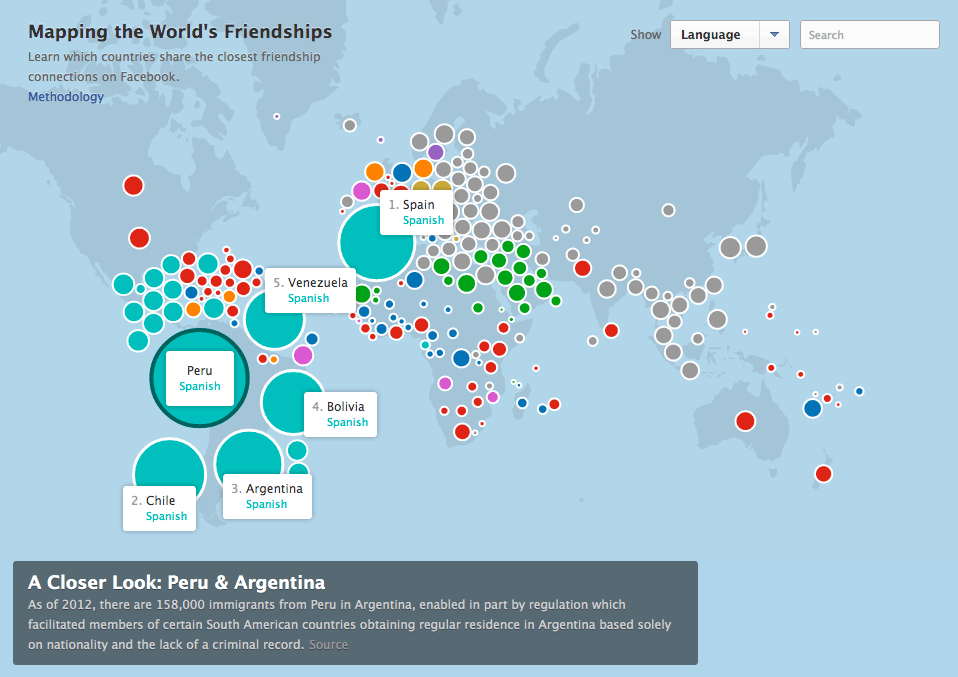
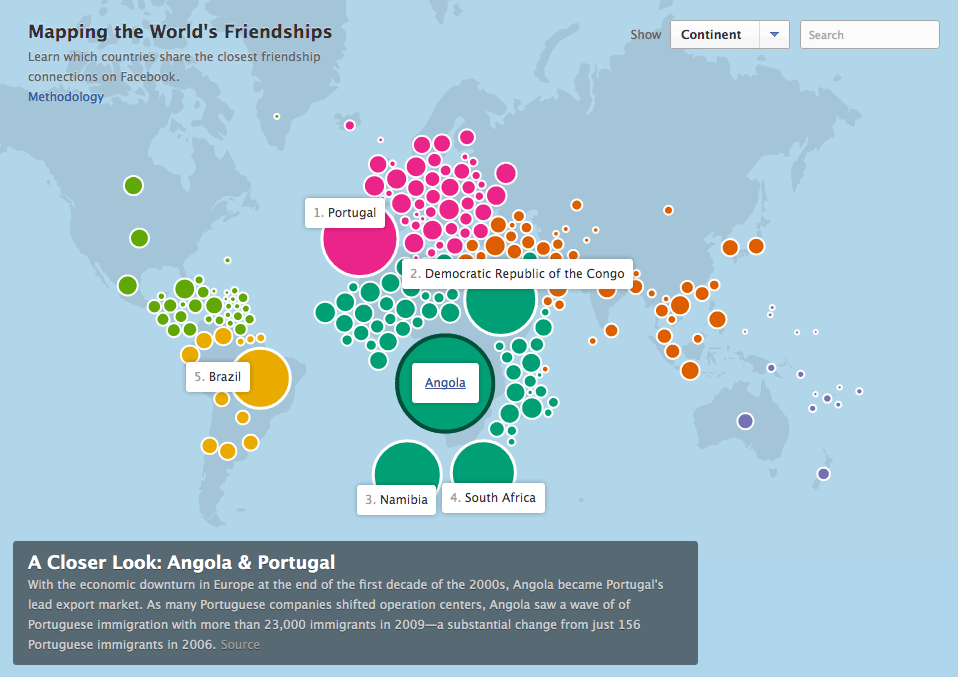
The work I chose is “Facebook: Mapping the World’s Friendships” by Stamen Designs published in June of 2020.
This project is incredibly interesting as it takes data on the interconnectedness of Facebook’s users and turns the data into clean cut visuals on a map to illustrate the world’s friendships.
The countries are sorted by a combination of how many facebook friendships there are between countries as will as the total number of facebook friendships within one county.
The data isn’t only intriguing, it is also informative. Surprisingly, you can see a lot of history within the data, such as where countries have been. If one country has occupied another you can see the connectedness through peoples friends on facebook which is extremely interesting.
I really admire this work as it condenses large quanities of data into an easily undersood visual that can tell you more than you would ever expect.

Looking Outwards 07: Information Visualization

Facebook Stories: Virality by Rachel Binx
https://rachelbinx.com/Facebook-Stories-Virality
jwesthei, Section B

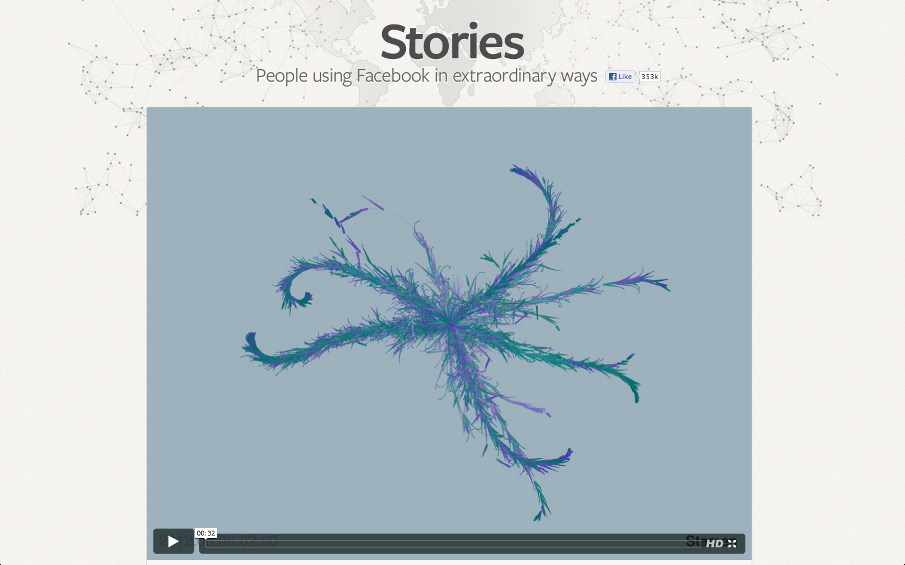
This project is a play on the concept of going “viral” and how this can be visualized. Aesthetically very similar to the “Self-Dividing Line” project I reviewed last week, this one visualizes how one a piece of media (in this case three of the most shared images on Facebook) ends up being shared hundreds of thousands of times on a social media platform.

A screenshot of one of the videos from Rachel Binx’s “Facebook Stories: Virality” project (2013).

The pieces start as a single person and split off into branches as the media is shared. As the piece becomes shared and re-shared, the project visualizes the gender of the person sharing it as well as the relative age of the share as time progresses. The artist worked with Zach Watson to create the algorithm using the WebGL framework and animate this. I could not find a lot of information about the specifics of the algorithm used, but I would imagine it is similar to that of the “Self-Dividing Line,” where instead of randomly generated midpoints to split from, the time and number of branches come from actual data defining a shared media.