Looking Outwards 06 – Randomness

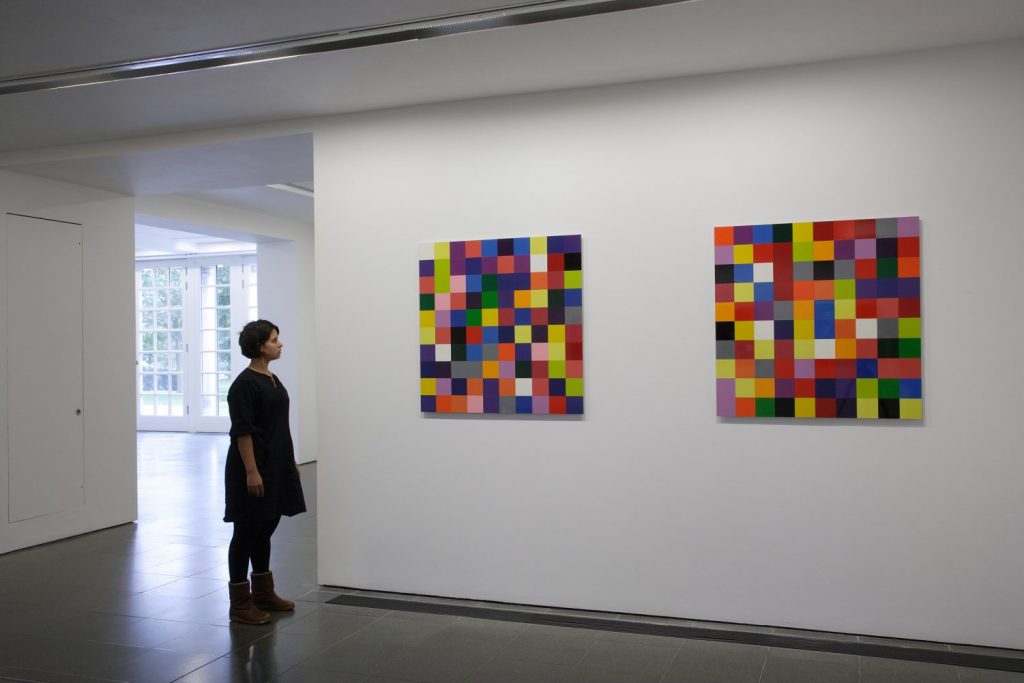
Image of “4900 Colours: Version II” in exhibition

Gerhard Richter’s “4900 Colours: Version II” is an artwork of 196 panels that is made up of 5×5 squares. The colors used in these panels are distributed randomly by a computer, and then the panels are randomly arranged by the eyes. The 196 penales can be displayed as one whole artwork together, or it can be arranged at random in sets of four panels (which forms a 10×10 square panel). What’s amazing about this artwork is that the 4,900 colors used in each block of Richter’s artwork are fully randomized by computer, yet they still look very harmonized all together. I can see how the artist incorporates the beauty of randomness into his artwork, and how the artist uses his artistic sensibilities to arrange the panels and create a harmonious and beautiful piece of artwork. I love the fact that his artworks are not limited, and shows a variety of expressions through his artwork by randomly generating colors.

Gerhard Richter’s Website: https://www.gerhard-richter.com/en/art/paintings/abstracts/colour-charts-12

Video of “4900 Colours: Version II” in exhibition

Project 6 – Clock

sketchDownload
//Se A Kim
//Section D
//seak

var x = [];
var y = [];
var dx = [];
var dy = [];
var c = [];


function setup() {
    createCanvas(400, 400);
    for (var i = 0; i < 100; i ++){
        x[i] = random(width);
        y[i] = random(height);
        dx[i] = random(-5,5);
        dy[i] = random(-5,5);
        c[i] = color(random(255), random(255), random(255));
    }
    frameRate(20);
}

function draw() {
    background(0);

    //drawing circles in the background
    noStroke();
    for(i = 0; i < 50; i++){
        fill(c[i], 100, 100);
        ellipse(x[i], y[i], 20);
        x[i] += dx[i];
        y[i] += dy[i];
        if(x[i] > width){
            x[i] = 0;
        } else if (x [i] < 0){
            x[i] = width;
        } 
        if (y[i] > height){
            y[i] = 0;
        } else if (y[i] <0){
            y[i] = height;
        }
    }

    //clock ellipses
    var s = second();
    var m = minute();
    var h = hour();

    push();
    translate(200, 200);
    noStroke();

    //second circle
    let sAngle = map(s, 0, 60, 0, 360);
    var sx = 50 * cos(radians(sAngle));
    var sy = 50 * sin(radians(sAngle));
    fill(c[i]);
    rotate(radians(-90));
    ellipse(sx, sy, 100);

    //minute circle
    let mAngle = map(m, 0, 60, 0, 360);
    var mx = 50 * cos(radians(mAngle));
    var my = 50 * sin(radians(mAngle));
    fill(255, 100, 100, 100);
    rotate(radians(90));
    ellipse(mx, my, 80);

    //hour circle
    let hAngle = map(h, 0, 60, 0, 360);
    var hx = 50 * cos(radians(hAngle));
    var hy = 50 * sin(radians(hAngle));
    fill(255, 255, 255, 100);
    rotate(radians(10));
    ellipse(hx, hy, 100);

    pop();
}

For this project, I wanted to practice some of our in class exercises/lectures and fully understand the cos and sin (polar coordinates) and on arrays. I integrated these topics with the clock.

Project – 06 – abstract clock

sketch
    // Fangzheng Zhu
    // Section D
    // jtimczyk@andrew.cmu.edu
    // Project-06-abstract clock


function setup () {
  createCanvas(480, 480);
    background(0);
}


function draw (){
    angleMode(DEGREES);
    let hr = hour();
    let mn = minute();
    let sc = second();

    push();
    translate(240,240);
    rotate (-90);
    strokeWeight(8);

    // second circle
    stroke(255,100,150);
    noFill();
    var end1 = map(sc, 0, 60, 0, 360);
    arc(0,0,300,300,0,end1);

    //minute circle
    stroke(150,100,255);
    var end2 = map(mn, 0, 60, 0, 360);
    arc(0, 0, 280, 280, 0, end2);

    //hour circle
    stroke(150,255,100);
    let end3 = map(hr%12, 0, 12, 0, 360);
    arc(0, 0, 260, 260, 0, end3);
    pop();


    //face
    //black eyebrows 
    stroke(255);
    fill(0);
    rectMode(CENTER);
    rect(170, 170, 25, 5, 15);
    rect(310, 170, 25, 5, 15);
  
    //eyes
    ellipseMode(CENTER);
    ellipse(170, 200, 20, 20);
    ellipse(310, 200, 20, 20);
  
    //nose
    noStroke();
    strokeWeight(6);
    fill(204, 95, 95);
    rect(240, 230, 15, 30, 20);
  
    //lips
    stroke(250);
    noFill();
    rect(240, 280, 60, 20, 20);
  
    //teeth
    line(240, 270, 240, 290);
    line(240 - 15, 270, 240 - 15, 290);
    line(240 + 15, 270, 240 + 15, 290);

    //face animation
    if (sc % 2 == 0) {
    //eyebrows raise
    //cover old eyebrows w white
    stroke(0);
    strokeWeight(8);
    rectMode(CENTER);
    rect(170, 170, 25, 5, 15);
    rect(310, 170, 25, 5, 15);
    //new raised eyebrows
    strokeWeight(5);
    stroke(255);
    rect(170, 170, 25, 5, 15);
    rect(310, 170, 25, 5, 15);
    
    //mouth becomes smaller
    //cover old mouth
    //lips
    strokeWeight(10);
    stroke(0);
    noFill();
    rect(width/2, 280, 60, 20, 20);
    //teeth
    line(width/2, 270, width/2, 290);
    line(width/2 - 15, 270, width/2 - 15, 290);
    line(width/2 + 15, 270, width/2 + 15, 290);
    //new small mouth
    strokeWeight(6);
    stroke(255);
    ellipse(width/2, 280, 20,20);
  }
  
}

LO 6

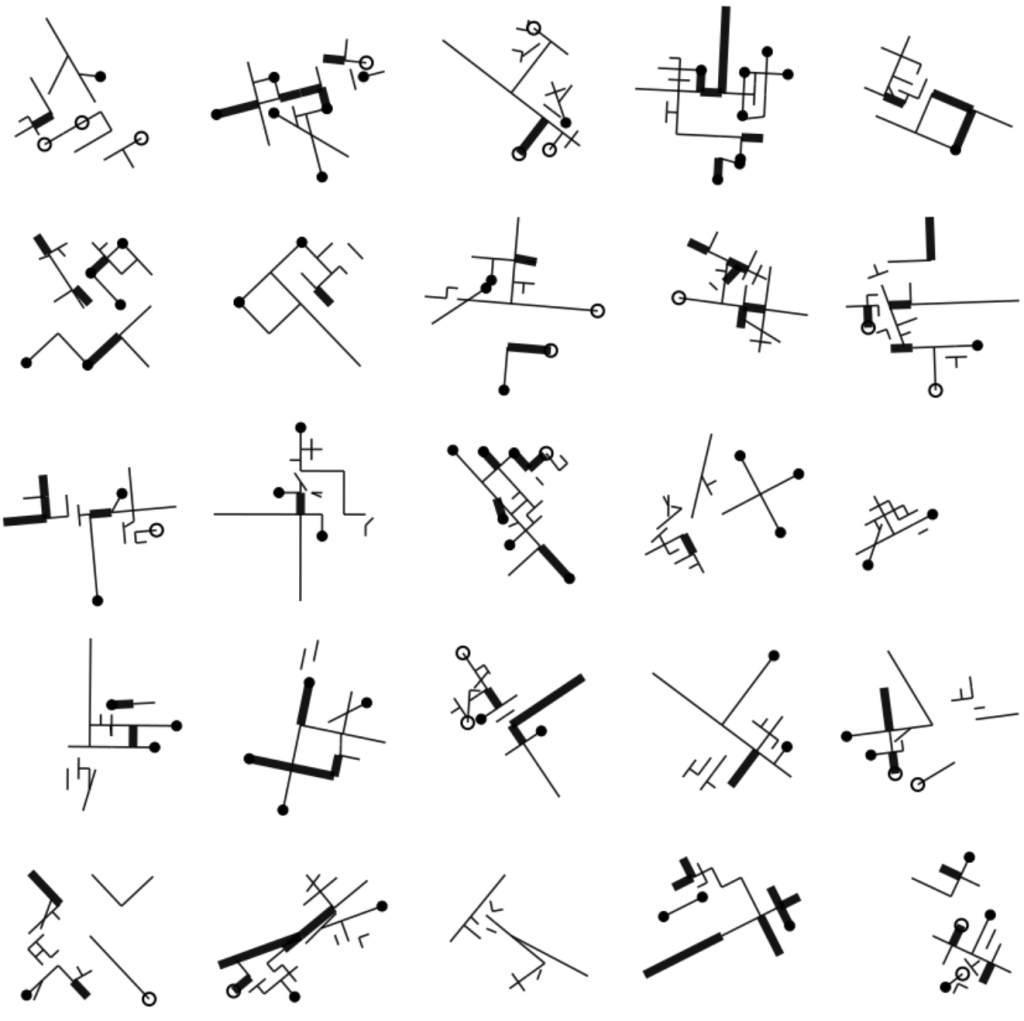
“Future Alterations” by Anders Hoff explores randomly generated art that explores future changes applied to a simple graph. He describes these changes as alterations in which these nested alterations are dependent to other alterations. He created a dependency graphs of futures. The graphs started with a single straight line or edge and then proceeds to select edges at random. The edges sometimes split in the middle or rotate around to produce new edges. I founded the implementation interesting because of its simplistic nature, but the results can be drastically different from one another. Hoff describes how having this functionality allows him to write an algorithm that almost looks like pseudo code. From my own experiences with coding, I can safely assume that he is using random variables in his functions, which result in multiple future changes.

“Future Alterations” by Anders Hoff

https://inconvergent.net/2020/future-alterations/

LookingOutwards- 06

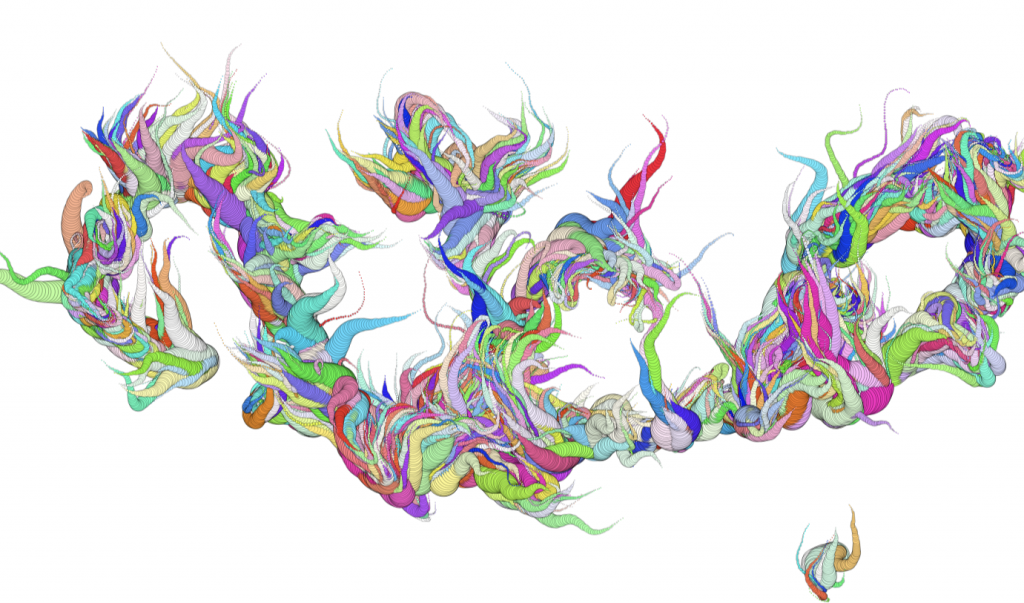
This project <Noise Turbulence Doodles >was created by Raven Work.

I really enjoy this project because it is interactive and the logic is really simple. The user just needs to drag and draw in the interface and the art is created. The artist used the noise function to create this project that the objects wander around but remain smooth and organic. This artwork reminds me of the ancient Chinese legend that the fairy is flying on the colorful clouds but is presented in a modern way. Also, the randomness of the color creates a dreamy feeling.

Abstract Clock

sketchDownload
//Ian Lippincott
//ilippinc@andrew.cmu.edu
//Section: D
//Project-06-A

var c1;
var c2;
var s = second();

function setup() {
    createCanvas(480, 480);
    //Define background colors
    c1 = color(17, 19, 42);
    c2 = color(84, 17, 102);
    
}


function draw() {
	//Background
	setGradient(c1, c2);
	//Stars
	stroke(255);
	strokeWeight(2);
	point(30, 50);
	point(400, 80);
	point(250, 30);
	point(35, 200);
	point(100, 420);
	point(10, 370);
	point(400, 400);
	point(270, 430);
	noStroke();
	//Moon base
	//Light Moon Color
	fill(253, 242, 199);
	circle(240, 240, 320);

	//Moon shadow
	//Dark Moon Color
	fill(226, 199, 145);
	beginShape();
	vertex(240, 80);
	bezierVertex(25, 87, 25, 393, 240, 400);
	bezierVertex(100, 393, 100, 87, 240, 80);
	endShape();

	//Dark Spots
	circle(220, 260, 60);
	circle(320, 200, 25);
	circle(240, 140, 10);
	circle(180, 180, 10);
	circle(200, 200, 10);
	circle(340, 270, 20);
	circle(320, 290, 8);
	circle(290, 340, 20);
	circle(180, 330, 15);

	//Light Spots
	fill(253, 242, 199);
	circle(130, 220, 50);
	circle(145, 165, 20);
	circle(155, 320, 40);

	//Hour Counting Shadow
	fill(226, 199, 145, 170);
	beginShape();
	vertex(240, 80);
	bezierVertex(25, 87, 25, 393, 240, 400);
	bezierVertex(25 + hour() * (320 / 24), 393, 25 + hour() * (320 / 24), 87, 240, 80);
	endShape();

	//Minute Counting Cloud
	drawCloud(minute() * 8, 350);

	//Second Counting Witch
	drawWitch(-60 + second() * 480 / 60, 300);


}


//Makes Gradient Background
function setGradient(c1, c2) {
	noFill();
	for (var b = 0; b < height; b++) {
		var inter = map(b, 0, height, 0, 1);
		var c = lerpColor(c1, c2, inter);
		stroke(c);
		line(0, b, width, b);
	}
}


function drawCloud (x, y) {
	push();
	fill(80, 58, 96);
	translate(x, y);
	rect(0, 0, 120, 30, 12);
	rect(10, 10, 170, 30, 10);
	rect(-20, 20, 100, 30, 15)
	rect(30, 30, 100, 30, 20);
	rect(100, 20, 100, 20, 15);
	rect(100, 30, 140, 10, 15);
	pop();
}

function drawWitch (x, y) {
	translate(x, y);
	fill(39, 27, 53);
	ellipse(36, 48, 48, 20);
	strokeCap(ROUND);
	strokeWeight(4);
	stroke(39, 27, 53);
	line(36, 48, 140, 48);
	strokeCap(SQUARE);
	strokeWeight(1);
	beginShape();
	vertex(36, 38);
	bezierVertex(27, 36, 18, 40, 0, 47);
	bezierVertex(18, 55, 27, 60, 40, 50);
	endShape();
	angleMode(DEGREES);
	push();
	rotate(30);
	ellipse(95, -5, 32, 18);
	pop();
	push();
	rotate(-35);
	ellipse(60, 75, 32, 18);
	pop();
	beginShape();
	vertex(89, 18);
	bezierVertex(82, 26, 65, 29, 50, 28);
	bezierVertex(60, 30, 70, 38, 75, 45);
	endShape();
	beginShape();
	vertex(106, 21);
	vertex(108, 28);
	vertex(110, 34);
	vertex(102, 40);
	vertex(100, 38);
	vertex(95, 21);
	endShape();
	push();
	rotate(80);
	rect(40, -98, 25, 3);
	pop();
	push();
	rotate(30);
	rect(95, -40, 5, 3);
	pop();
	push();
	rotate(20);
	ellipse(105, -29, 12, 15);
	pop();
	beginShape();
	vertex(105, 15);
	bezierVertex(98, 10, 95, 8, 95, 3);
	bezierVertex(95, 4, 100, 6, 106, 2);
	endShape();


}


For this project, I wanted to create a clock that took inspiration from the Studio Ghibli movie Kiki’s Delivery Service. I make my design first in Illustrator.

LO 06 – Randomness

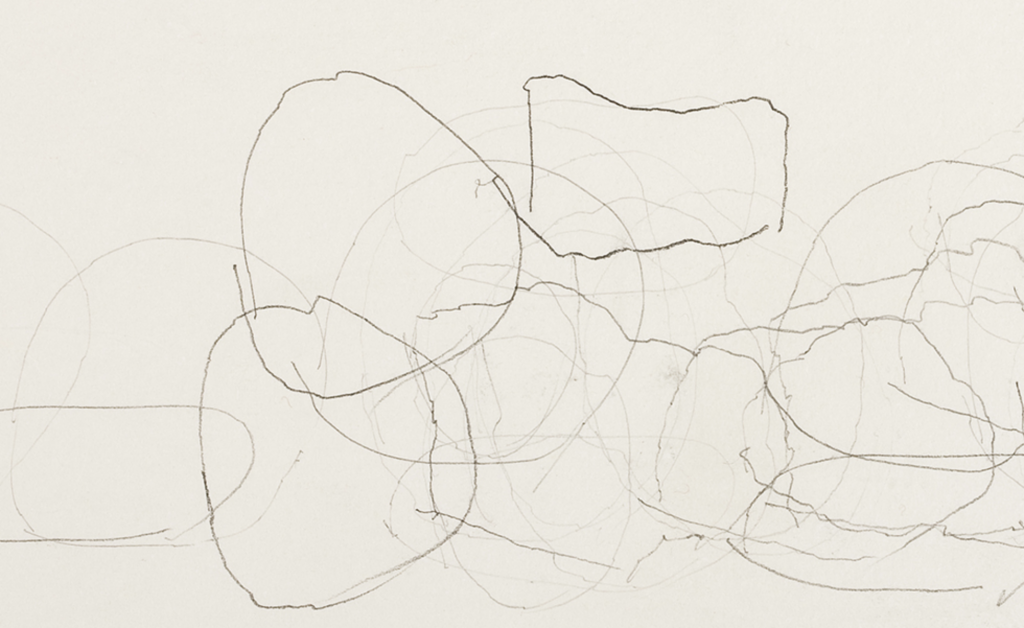
John Cage was an American composer who was one of the leading figures of the post-war avant-garde. While most of his work involved music and non-standard use of musical instruments, he also produced visual art. One project titled “Rocks” used randomness to determine the tools and placement of the objects being painted. Cage used computer-generated random numbers from a list which determined what group of stones would be used in his drawing/painting. He would then go through the same process to choose the brush/pencil he would use, and the position of the rocks. After this “seed” has been chosen, Cage would trace the rocks in their random positions. I particularly enjoy this work because of the simplicity in the randomness. While these pieces of art do not use complex algorithms to produce random results, they use random number generators to select the materials, and Cage is still able to physically contribute to the pieces. This is certainly a contrast to the work of Jackson Pollock, which appears to be completely random, but in the end, Pollock is controlling every splatter of paint. In the work of John Cage, his work looks so controlled, yet every aspect of it, aside from the shape of the rocks, is random.

Link: http://hanesgallery.wfu.edu/portfolio-item/johncagerocks/

LO: Randomness

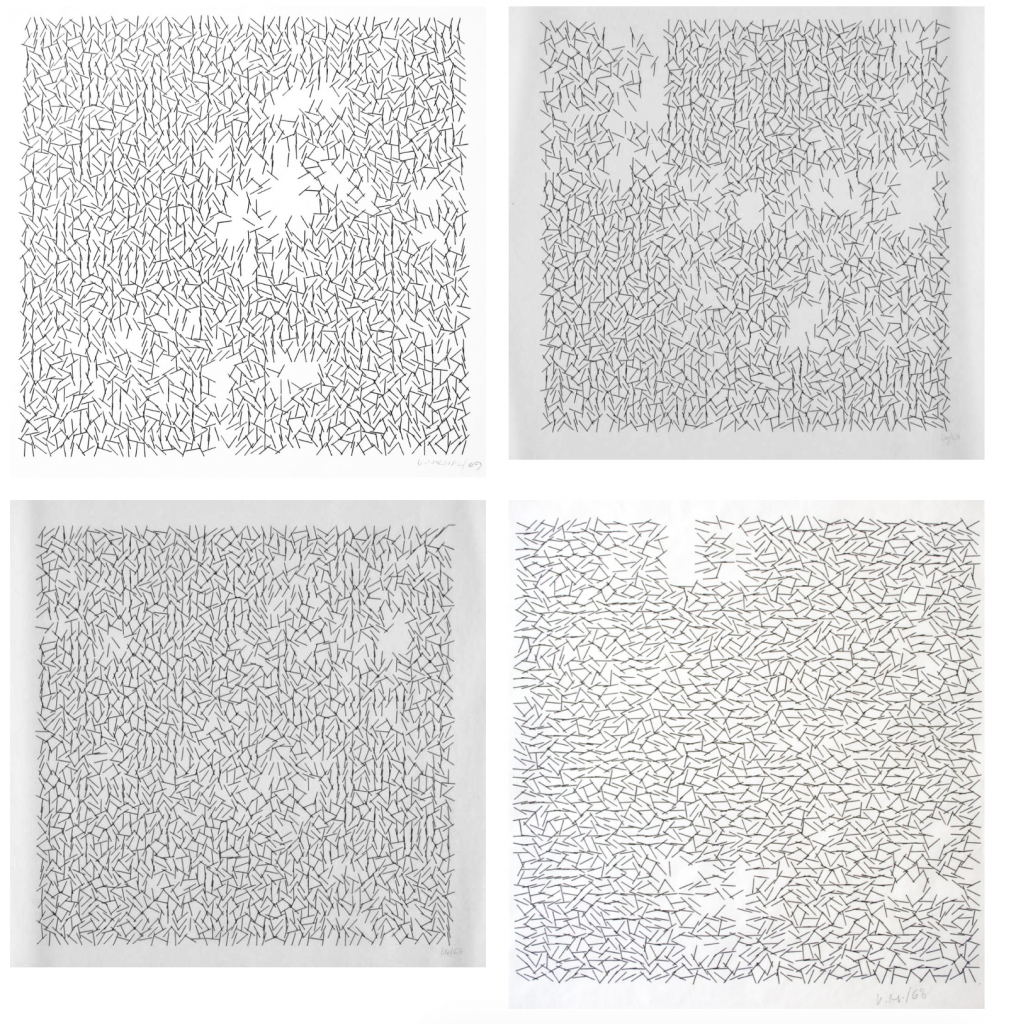
Vera Molnar’s “Interruptions” 1968-89

Vera Molnar comes to my mind when randomness in computational art is brought up. Molnar is one of the first artists who created art through code. One of her projects that really represent randomness is “Interruptions.” Molnar created these pieces by creating square grids with little lines with tilts to different tilts and then making some lines disappear to create forms. Each piece is all different as she used a limited random generator that varied x and y by two or three millimeters. I find the works very interesting as it mimics how straightly places lines can be “interrupted”, similar to a domino effect or even the lines repelling each other. She made these to create shapes with the interruption similar to how in painting there are shapes that pop out of the background. Her pieces seem fairly easy but so much more complex. As a woman, I admire her very much.

Vera Molnar: http://www.veramolnar.com/

Project 06: Abstract Clock

The idea here was to use a binary representation for a clock. Green is 1, red is 0. The clock hours with the back square as the MSB, while minutes have the back square as the LSB. If the back left square is green, that means it’s 8 o’clock, and if the back right square is green, that means it’s 8:01. The back building, tells whether it is afternoon or not. This is also the return of 3D space in my projects. Hooray.

yeeeeeeeeeeeeet

function setup() {
    createCanvas(600, 600);
    background(220);
    text("p5.js vers 0.9.0 test.", 10, 15);
}

/* 
  Idea: Create a small town that tells the time based on what's "open."
  Doors will represent a binary pattern on each side of town.
  A building in the back tells whether it is am or pm.
*/

function draw() {
    background(0);

    fill(255);
    stroke("#FF00FF");

    // fill the floor and make a road
    drawCube(-10000, 200, 1, 20000, 0, 20000);
    fill(128);
    drawCube(-200, 200, 1, 400, 0, 20000);

    // draw am pm  tower
    fill("#800080");
    drawCube(-200, -400, 2400, 400, 600, 400);
    fill(hour() < 12 ? "#800000" : "#008000");
    drawCube(-100, -300, 2400, 200, 200, 0);

    // get time and store it
    let h = hour() % 12;
    let m = minute();

    var hStr = h.toString(2);
    var mStr = m.toString(2);

    // draw cubes and doors
    for (var i = 0; i < 4; i++) {
        fill("#800080");
        drawCube(200, -400, 1800 - (i * 500), 800, 600, 400);
        drawCube(-200, -400, 1800 - (i * 500), -800, 600, 400);
        
        // hour squares
        fill(hStr[i] == 1 ? "#008000" : "#800000");
        drawCube(-200, (i * -100), 1900 - (i * 500), 100, 100, 0);

        // minute squares
        fill(mStr[i] == 1 ? "#008000" : "#800000");
        drawCube(200, (i * -100), 1900 - (i * 500), -100, 100, 0);
        if (i > 1) {
            fill(mStr[i+2] == 1 ? "#008000" : "#800000");
            drawCube(200, 200 + (i * -100), 1900 - (i * 500), -100, 100, 0);
        }
    }

    
}

// the return of the 3d projection matrix

// uses projection matrix seen in this video:
// https://www.youtube.com/watch?v=ih20l3pJoeU
// the video is mostly math about projecting 3d coordinates to 2d coordinates
function projMatrixMult(coords) {
    // aspect ratio
    var a = width / height;

    // field of view
    var fov = HALF_PI;
    f = 1 / tan(fov / 2);

    // range of view
    var zNear = 0.1;
    var zFar = 1000;

    var q = zFar / (zFar - zNear);

    if (coords.length != 3) {
        print("Improper array size.");
        return coords;
    } else {
        // this calculates the result of multiplying [x, y, z, 1]
        // with a 4x4 projection matrix (not shown for lack of use without
        // the math.js extension)
        let projMat = [a * f * coords[0], f * coords[1], 
                       coords[2] * q - zNear * q, coords[2]];
        
        if (coords[2] != 0) {
            projMat[0] /= projMat[3];
            projMat[1] /= projMat[3];
            projMat[2] /= projMat[3];
            projMat[3] /= projMat[3];
            return projMat;
        } else {
            print("z is equal to 0");
            return coords;
        }
    }
}

// self explanatory
// note to self: add rotation parameters
// note to self: generalize for any number of points greater than 4 (later)
function drawCube(x, y, z, wid, hei, d) {
    // push 3d coords to an array
    let cubePoints3D = [];
    cubePoints3D.push([x, y + hei, z]); // front bottom left            0
    cubePoints3D.push([x, y, z]); // front top left                     1
    cubePoints3D.push([x + wid, y + hei, z]); // front bottom right     2
    cubePoints3D.push([x + wid, y, z]); // front top right              3
    cubePoints3D.push([x, y + hei, z + d]); // back bottom left         4
    cubePoints3D.push([x, y, z + d]); // back top left                  5
    cubePoints3D.push([x + wid, y + hei, z + d]); // back bottom right  6
    cubePoints3D.push([x + wid, y, z + d]); // back top right           7

    // get projection and add to list of points
    let cubeProj = [];
    for (let i = 0; i < cubePoints3D.length; i++) {
        cubeProj.push(projMatrixMult(cubePoints3D[i]));
    }

    // this scales the image to be on screen
    for (let i = 0; i < cubeProj.length; i++) {
        cubeProj[i][0] += 1;
        cubeProj[i][1] += 1;

        cubeProj[i][0] *= width / 2;
        cubeProj[i][1] *= height / 2;
    }

    // need 6 quads for the 6 faces of the cube, draw the further quads first
    // realistically, without camera movement or rotation, i can draw only
    // 5 quads and still have it look find regardless of placement
    // if i add rotation, i need to add conditionals for what is drawn first
    
    // back face
    quad(cubeProj[7][0], cubeProj[7][1], cubeProj[6][0], cubeProj[6][1],
        cubeProj[4][0], cubeProj[4][1], cubeProj[5][0], cubeProj[5][1]);
    
    // bottom
    quad(cubeProj[6][0], cubeProj[6][1], cubeProj[4][0], cubeProj[4][1],
        cubeProj[0][0], cubeProj[0][1], cubeProj[2][0], cubeProj[2][1]);

    // top
    quad(cubeProj[7][0], cubeProj[7][1], cubeProj[5][0], cubeProj[5][1],
        cubeProj[1][0], cubeProj[1][1], cubeProj[3][0], cubeProj[3][1]);

    if (x > 0) {
        // left
        quad(cubeProj[5][0], cubeProj[5][1], cubeProj[4][0], cubeProj[4][1],
            cubeProj[0][0], cubeProj[0][1], cubeProj[1][0], cubeProj[1][1]);

        // right
        quad(cubeProj[7][0], cubeProj[7][1], cubeProj[6][0], cubeProj[6][1],
            cubeProj[2][0], cubeProj[2][1], cubeProj[3][0], cubeProj[3][1]);
    } else {
        // right
        quad(cubeProj[7][0], cubeProj[7][1], cubeProj[6][0], cubeProj[6][1],
            cubeProj[2][0], cubeProj[2][1], cubeProj[3][0], cubeProj[3][1]);

        // left
        quad(cubeProj[5][0], cubeProj[5][1], cubeProj[4][0], cubeProj[4][1],
            cubeProj[0][0], cubeProj[0][1], cubeProj[1][0], cubeProj[1][1]);
    }
    
    // front
    quad(cubeProj[3][0], cubeProj[3][1], cubeProj[2][0], cubeProj[2][1],
        cubeProj[0][0], cubeProj[0][1], cubeProj[1][0], cubeProj[1][1]);

    // the lines are no longer necessary
}

Project 6: Abstract Clock

sketch
/*
Bon Bhakdibhumi
bbhakdib
Section D
*/

function setup() {
    createCanvas(480, 480);
    background(0);
    frameRate(1);
}

function draw() {
    noStroke();
    var x = random(0, 480);
    var y = random(0, 480);

// every second generate 1 random white star
    fill(255);
    circle(x, y, 3);

// every minute generate 1 cyan star
  if(second() == 59) {
      fill(0, 255, 255);
      circle(x, y, 10);
  }

// every hour generate 1 yellow star
  if (minute() == 59 & second() == 59) {
      fill(255, 255, 0);
      circle(x, y, 35)
  }
// when clock reaches 24 hr reset background to black
  if (hour() == 23 & minute() == 59 && second() == 59) {
      background(0);
  }
}

For this project, I was inspired by the concept of time and the universe, which is still yet to be fully discovered or understood. In my work, a second is represented by a small “white start” appearing into the “universe.” A minute is by a “blue star”, and an hour is represented by a yellow star. When the clock reaches 24 hours, the canvas is reset to black

The Universe