![[OLD FALL 2018] 15-104 • Introduction to Computing for Creative Practice](../../../../wp-content/uploads/2020/08/stop-banner.png)
/*
Alice Fang
Section E
acfang@andrew.cmu.edu
Project-07-Curves
*/
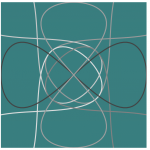
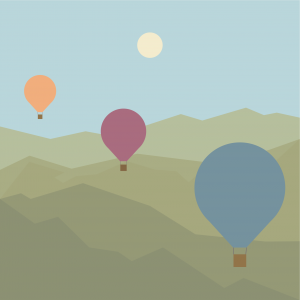
// http://mathworld.wolfram.com/EightCurve.html
// click to begin! and keep clicking to see it change!
var nPoints = 100;
var clickCount = 0;
function setup() {
createCanvas(400, 400);
frameRate(10);
strokeWeight(3);
noFill();
}
function draw() {
background(0, 128, 128);
var rad; // scale of expansion (how much wider the petal becomes)
var angle; // angle of rotation the curve is translated
for (i = 0; i < clickCount; i++) {
rad = 0.1 * i; // becomes wider with every click
angle = 30 * i; // rotates with every click
}
// curve in top right corner
push();
translate(3 * width / 4, height / 4);
rotate(radians(angle + 45));
drawCurve(random(0, 255), rad); //random color, angle
pop();
// curve in bottom left corner
push();
translate(width / 4, 3 * height / 4);
rotate(radians(angle + 45));
drawCurve(random(0, 255), rad);
pop();
// curve in top left corner
push();
translate(width / 4, height / 4);
rotate(radians(angle - 45));
drawCurve(random(0, 255), rad);
pop();
// curve in bottom right corner
push();
translate(3 * width / 4, 3 * height / 4);
rotate(radians(angle - 45));
drawCurve(random(0, 255), rad);
pop();
// center curve
push();
translate(width / 2, height / 2);
rotate(radians(angle + 90))
drawCurve(random(0, 255), rad);
pop();
// perpendicular center curve
push();
translate(width / 2, height / 2);
rotate(radians(angle));
drawCurve(random(0, 255), rad);
pop();
}
// draw eight curve
function drawCurve(c, r) {
var x;
var y;
var a = constrain(mouseX, 0, width / 2);
stroke(c);
beginShape();
for (var i = 0; i < nPoints; i++) {
var t = map(i, 0, nPoints, 0, TWO_PI); // map to unit circle
// parametric function
x = a * sin(t);
y = a * sin(t) * cos(t) * r;
vertex(x, y);
}
endShape(CLOSE);
}
function mousePressed() {
clickCount++;
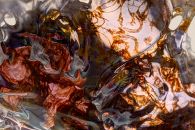
}I struggled a lot with this project in particular, because I forgot a lot of the algebra related. I found it really difficult to implement any curve at all, and I originally wanted to use a more complicated curve. However, I enjoy the simplicity of this curve and how complex it can become when layered on top of each other. This reminds me of tangled strings, especially the more you click and zoom in! The greyscale flickering happened on accident, but I really liked it so I kept it, moving away from the filled hour-glass shapes I had originally.