Alexandra Kaplan – Looking Outwards – 7


Infographic containing the map of different regions as well as the phone call map.

The project on information visualization that caught my eye was a project created by the New York Times in 2011 called “Phone Call Cartography” in which researches from MIT, AT&T, and IBM compiled research about phone calls and where they are from/to. This data is then compiled into a map in different arcs each representing thousands of phone calls. I have always enjoyed looking at maps, so seeing such interesting data being the foundation of one is fascinating. For the algorithm, it seems like they assigned the data to different regions and had regions with more data be taller and bolder. I think that it is really cool that even without the normal geographic map of the United States, it is still possible to tell what cities are where as well as a general population of different areas. I would be interested in seeing a similar map for today, I wonder if there would be a similar number of phone calls, fewer, or greater.

Alexandra Kaplan – Project 07 – Curves

curves

/* 
Alexandra Kaplan
Section C
aekaplan@andrew.cmu.edu
Project - 07 
*/


var nPoints = 400; // length of all for loops

function setup() {
    createCanvas(480, 400);
    background(220);    
}

function draw() {
	background(150, 200, 255);
	drawStem1();	
	drawEpicycloid1();
	drawCenter1();
	drawStem2();
	drawEpicycloid2();
	drawCenter2();
	drawStem3();
	drawEpicycloid3();
	drawCenter3();
}

// draws middle flower
function drawEpicycloid1() { 
	var x;
	var y;
	var b = 4 + (mouseX/50); // frequency of curves
	var a = map(mouseY, 0, 400, 200, 0); // diameter of path of curve
	var h = 10 // distance from path to outer curve

	fill(220, 200, 100);
	stroke(180, 160, 60);

    beginShape();
	for (var i = 0; i < nPoints; i += 1) {
        var t = map(i, 0, nPoints, 0, 360);
        x = (a + b) * cos(radians(t)) - h * cos((radians(a + b)/ b) * t);	
        y = (a + b) * sin(radians(t)) - h * sin((radians(a + b)/ b) * t);
        vertex(x + width / 2, y + mouseY);    
        
    }
    endShape(CLOSE);
}

// draws center of middle flower
function drawCenter1(){
	fill(50);
	var centerW1 = 1
	centerW1 = map(mouseY, 0, 400, 200, 1)
	ellipse(width / 2, mouseY, centerW1, centerW1);
}

// draws middle stem
function drawStem1(){
	fill(50, 150, 50);
	stroke(20, 120, 20);
	rect(width / 2 - 5, mouseY, 10, 1000);
}

// draws left flower
function drawEpicycloid2() {
	var x;
	var y;
	var b = 3 + (mouseX / 50); // frequency of curves
	var a = map(mouseY, 0, 400, 50, 0); // diameter of path of curve
	var h = 10 // distacne from path to outer curve

	fill(220, 200, 220);
	stroke(160, 140, 160);

    beginShape();
	for (var i = 0; i < nPoints; i += 1) {
        var t = map(i, 0, nPoints, 0, 360);
        x = (a + b) * cos(radians(t)) - h * cos((radians(a+b)/ b) * t);	
        y = (a + b) * sin(radians(t)) - h * sin((radians((a+b)/b) * t));
        vertex(x + width / 4, y + mouseY + 170);    
        
    }
    endShape(CLOSE);
}


// draws left center
function drawCenter2(){
	fill(50);
	var centerW2 = 0;
	centerW2 = map(mouseY, 0, 400, 50, 1);
	ellipse(width / 4, mouseY + 170, centerW2, centerW2);
}

// draws right stem
function drawStem2(){
	fill(150, 250, 150, 150);
	stroke(100, 200, 100);
	rect(width / 4 - 5, mouseY + 170, 10, 1000);
}

// draws right flower
function drawEpicycloid3() {
	var x;
	var y;
	var b = 2 + (mouseX / 50); // frequency of curves
	var a = map(mouseY, 0, 400, 20, 0); // diameter of path of curve
	var h = 6 // distance from path to outer curve

	fill(155, 155, 250);
	stroke(130, 130, 230);

    beginShape();
	for (var i = 0; i < nPoints; i++) {
        var t = map(i, 0, nPoints, 0, 360);
        x = (a + b) * cos(radians(t)) - h * cos((radians(a + b) / b) * t);	
        y = (a + b) * sin(radians(t)) - h * sin((radians(a + b) / b) * t);
        vertex(x + width - width/4, y + mouseY + 250);         
    }
    endShape(CLOSE);
}

// draws right center
function drawCenter3(){
	fill(50);
	var centerW3 = 0;
	centerW3 = map(mouseY, 0, 400, 20, 0);
	ellipse(width - width / 4, mouseY + 250, centerW3, centerW3);
}

// draws right stem
function drawStem3(){
	fill(100, 200, 100, 200);
	stroke(80, 180, 80);
	rect(width - width / 4 - 5, mouseY + 250, 8, 1000);
}


When looking at the description for this project, my mind immediately went to flowers and the different shapes of flower petals. It was pretty difficult at first to figure out how to insert the equations from the website into my code, but once I did it was fun to play around how I could then change the curves. Here are some screenshots of different x and y combinations:

Earlier iteration with only one flower

Alexandra Kaplan – Looking Outwards – 06

What the E-volver looks like
Illustrates the human interaction component

The concept of the project E-volver (created in 2006) is to have humans introduce the concept of randomness. It is a software that has an “image breeding machine” that a human “gardener” can collaborate with in order to create a piece of art. I am not completely sure how the algorithm works, but it seems that there are 4 animations that go into it and randomly interact with each other. Humans add another component of randomness to it by choosing an image to be left out of the algorithm until the next person comes by and chooses the image they wish to be left out. I thought that this project was really interesting in how it had an interactive component that was essential to the purpose of the piece.

Video of one of the final pieces of art.

Alexandra Kaplan – Project 06- Abstract Clock

sketch

/* Alexandra Kaplan
   aekaplan@andrew.cmu.edu
   Section C
   Project - 06
*/

var dropY = 100;
var dropX = 150
var xarray = [110];
var yarray = [105];

function setup() {
    createCanvas(400, 300); 
    frameRate(30); //each second is 30 frames
}

function draw() {
    background(230, 250, 255);
    var H = hour(); // current hour
    var M = minute(); // current minute
    var S = second(); // current second
    var milli = second(); //current millisecond
    var HWaterHeight = map(M, 0, 59, 0, height); // chages the height of the water according to the minute
    var waterColorb = map(H, 0, 23, 255, 120); // water changes from blue to grey over 24 hours
    var dropW = map(S, 0, 59, 25, 5); // water drops gets smaller as gets closer to a minute 
    
    // draw water level
    strokeWeight(0);
    fill(150, 170, waterColorb); // water changes from blue to grey over 24 hours
    rect(0, height - HWaterHeight, width, HWaterHeight);
    
    //draw water drops
    fill(170, 200, 225);    
    for(var i = 0; i < yarray.length; i++){ // draws water drop falling
    	ellipse(xarray[i], yarray[i], dropW, 20);
			yarray[i] += 5;      
    }

    if(frameCount % 30 === 0){ // every second a new drop is drawn
    	yarray.push(105);
        xarray.push(random(110, 140)) // randomizes x position of water droplets
    }

	faucet(); // draws faucet
}

function faucet(x, y){
	stroke(100);
	fill(120);
	rect(100, 80, 50, 35, 0, 0, 5, 5);
	rect(0, 40, 150, 50, 0, 10, 0, 0);
	stroke(160);
	strokeWeight(1);
	line(101, 113, 149, 109);
	line(100, 108, 149, 104);
	line(100, 103, 149, 99);
	line(100, 98, 149, 94);
}


For this project, I took inspiration from a leaky faucet. It keeps track of time by dripping once per second, the water goes from the bottom to the top every hour, and the color of the water changes from blue to green-brown throughout a 24 hour time period. It was definitely a more difficult project than I originally anticipated, as I had to draw on and combine a lot of concepts we have learned throughout the class. The part that I had the most trouble with was getting a new drop to drip at every second.

Sketch of original concept

Alexandra Kaplan – Looking Outwards – 05

Image from Nicopicto’s Duracell Advertising Campaign

Nikopinto is a global 3d animation and illustration studio. One project of theirs that really stood out to me was their Duracell print advertising campaign. It is a series of 3d graphics of a bunch of Duracell bunnies creating different shapes such as a rhino or tornado. I think that it has some really cute aspects (all of the bunnies!) as well as having an overall eye-catching image. Looking at it from a coding standpoint, I am sure that the many layers of bunnies have some sort of algorithm to have some sort of structured randomness.

Alexandra Kaplan – Project 5 – Wallpaper

sketch


function setup(){
	createCanvas (480, 480);
	background (170, 220, 250);
	strokeWeight(0);
	noLoop();
}

function draw(){

	//makes a grid for the right facing balloons
    for(var x1 = 70; x1 < width; x1 += 250){
    	for(var y1 = 50; y1 < height; y1 += 230){
	        airBalloonRight(x1, y1);
    	}
    }

    //makes a grid for the left facing balloons
    for(var x2 = 170; x2 < width; x2 += 250){
    	for(var y2 = 150; y2 < height; y2 += 230){
	        airBalloonLeft(x2, y2)
	    }
	}

    //makes a grid of the clouds
	for(var x3 = 170; x3 < width; x3 += 250){
        for(var y3 = 50; y3 < height; y3 += 230){
	       cloud(x3, y3);
        }
	}

	//makes a grid of the sun
	for(var x4 = 50; x4 < width; x4 += 250){
        for(var y4 = 160; y4 < height; y4 += 230){
	       sun(x4, y4);
	   }
	}

}

function airBalloonRight(x, y){ //draws the right facing balloons
	push();
	translate(x, y);
    rotate(radians(30));
   
    //balloon
	fill(250, 90, 90);
    ellipse(0, 0, 60, 55);
    quad(-30, 5, 30, 5, 6, 38, -6, 38);
   
    //basket
    fill(150,110,90);
    rect(-5, 45, 10, 8);
   
    //ballon decor
    strokeWeight(2);
    stroke(200, 60, 60);
    line(18, 20, -18, 20);
    line(28, 0, -29, 0);
    line(19, -20, -19, -20);
    
    //basket connectors
    strokeWeight(1);
    stroke(150,110,90);
    line(-15, 25, -5, 45);
    line(14, 25, 4, 45);
    
    pop();

}

function airBalloonLeft(x, y){ // draws the left facing balloons
	push();
	translate(x, y);
    rotate(radians(-30));

    // balloon
	fill(250, 90, 90);
    ellipse(0, 0, 60, 55);
    quad(-30, 5, 30, 5, 6, 38, -6, 38);

    // basket
    fill(150,110,90);
    rect(-5, 45, 10, 8);

    // basket connectors
    strokeWeight(1);
    stroke(150,110,90);
    line(-15, 25, -5, 45);
    line(14, 25, 4, 45);

    //ballon decor
    strokeWeight(2);
    stroke(200, 60, 60);
    line(18, 20, -18, 20);
    line(28, 0, -29, 0);
    line(19, -20, -19, -20);
    
    pop();

}

function cloud (x, y){ // draws the cloud
	push();
    fill(250);
    translate(x, y);
    ellipse(5, -5, 40, 35);
    ellipse(28, -2, 40, 28);
    rect(-28, -5, 85, 20, 10);
    pop(); 
}

function sun(x, y){ // draws the sun
	push();
    translate(x,y)
    push();
    for(var r = 0; r < 800; r += 90){ //rotates the rays around the center ellipse
    	rays();
    	rotate(radians(r));
    }
    pop();
    ellipse(0, 0, 30, 30)
    fill(245, 225, 10)
    ellipse(0, 0, 30, 30)
	pop();
}

function rays(x, y) { // draws the rays
	fill(250, 200, 10);
	triangle(0, 13, -30, 25, -15, 0);
	triangle(-5, 10, - 30, 0, -5, -10)
}


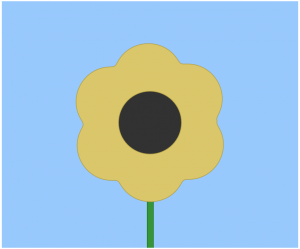
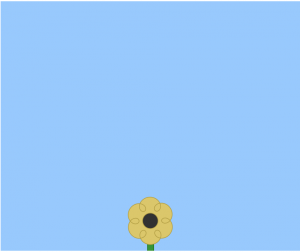
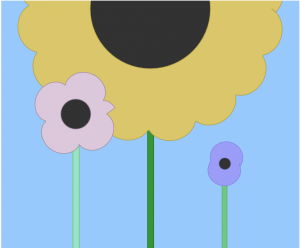
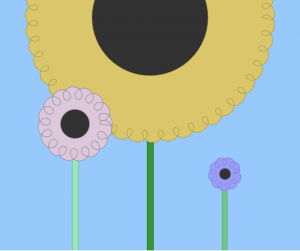
I had a lot of fun with this project, coming up with a repeating design by using for() loops and declaring my own functions. I came up with the idea of hot air balloons because I thought that they would be cute and simple. I like my final design, I think it would be good for a backpack, computer desktop screen, or wallpaper for a child’s room. In future projects, I will work on incorporating more variables into the drawings of the specific objects.

Alexandra Kaplan – Looking Outwards -04


A piece of sound art that stood out to me was Lines which was created in 2016 by composer Anders Lind. The installation is a series of lines on the floor, walls, and hanging down from the ceiling that can be interacted with by the audience to make different pitched sounds. I was really drawn to how participatory the piece is, I love it when art is accessible to its audience and promotes discovery in its viewers. It is also great in how it can be a group experience with people creating music together as well as a solo one.

I would think that the algorithm for this piece would use motion sensors to determine how far away an obstruction is and to play a certain pitch/tempo per distance.


Demonstrating part of the installation


Another part of the installation, this time activated by walking
Posts can be put down to make multiple notes at once even with just one person
This part of the installation is activated by how far up and down you are from the sensors.
A group of children plays with the installation


Alexandra Kaplan – Project 04 – String Art

sketch.js

    //variables of x and y placement of lines, to be changed under 
    //each for() statment

    var x1;
    var y1;
    var x2;
    var y2;


function setup() {
    createCanvas(400, 300);
}

function draw() {   
    background(100, 100, 130);

    // eye pupil
    strokeWeight(0);
    fill(40);
    ellipse(width / 2 - 5, 215, 60, 60); 

    // eye highlight
    fill(200);
    ellipse(width / 2 + 10, 205, 15, 15);

    // top lid
    for( var g2 = 1; g2 < width; g2 += 5){ // group 2 lines
        push();
        stroke(155, 150, 195);
        strokeWeight(1);
        translate(20, -80);
        rotate(radians(14));
        x1 = 0;
        y1 = width - g2;
        x2 = height + g2;
        y2 = g2;
        line(x1, y1, x2, y2);
        pop();
    }

    // bottom lid
    for( var g1 = 1; g1 < width; g1 += 5){ // group 1 lines
        push();
        stroke(185, 180, 225);
        strokeWeight(.5);
        translate(40, height/2 - 30);
        rotate(radians(2));
        x1 = 0;
        y1 = height - g1;
        x2 = width - g1;
        y2 = g1 ;
        line(x1, y1, x2, y2);
        pop();
    }

    // top 
    for( var g3 = 40; g3 < width; g3 += 5){ // group 3 lines 
        push();
        stroke(195, 190, 235);
        strokeWeight(1);
        translate(10, -100);
        rotate(radians(14));
        x1 = 0;
        y1 = width - g3;
        x2 = height + g3;
        y2 = g3;
        line(x1, y1, x2, y2);
        pop();
    }

    // head
    for( var g4 = .5; g4 < width; g4 += 5){ //group 4 lines
        push();
        stroke(90, 70, 130);
        strokeWeight(2);
        translate(-170, -60);
        rotate(radians(-25));
        x1 = 20;
        y1 = width - g4;
        x2 = height + g4;
        y2 = g4;
        line(x1, y1, x2, y2);
        pop();
    }
  
}


This project was a bit difficult to wrap my head around, especially how the for() loops affected the line positions.  I enjoyed manipulating the different parameters and seeing the various lines and arcs that could be created. My process was more one of discovery, as I played with the parameters to find inspiration. Once I had an idea,  I went on from there to try and get more specific in what I wanted to achieve.

Alexandra Kaplan -Project 3

/* Alexandra Kaplan
Section C
aekaplan@andrew.cmu.edu
Project 03 */


var bigCircleR = 150; //gold part of pocket watch radius
var smallCircleR = 140; // face part of pocket watch radius
var centerCircleR = 7; //center of hands radius
var topEllipseW = 20; //width of top ellipse
var topEllipseH = 15; //height of top ellipse
var minuteHand = smallCircleR / 4; // starting location of minute hand


function setup(){
	createCanvas(640, 480);
}

function draw(){
	background(30, 20, 80);
	
	//text
    var boundedTextSize = min(mouseX / 5, width);
    fill(mouseX / 3, mouseX / 2, mouseX + 150);
    textSize(boundedTextSize);
    textAlign(CENTER);
    text('you are getting sleepy', width / 2, height / 2 + 100);


	var circleX = 0; //x starting position of pocket watch
    var circleY = height / 1.3; // y starting position of pocket watch
    var swing = mouseX; // when mouse x is positive, swings left, when mouseX is negative, swings right

    if (mouseX > 90){
        swing = -swing - 180; //watch changes direction so it doesn't go off the canvas
    }
    if (mouseX > 270){
        swing = mouseX + 360; //watch changes direction so it doesn't go off the canvas
    }
    if (mouseX > 450){
        swing = -mouseX - 540; //watch changes direction so it doesn't go off the canvas
    }
    if (mouseX > 630){
        swing = mouseX + 720; //watch changes direction so it doesn't go off the canvas
    }
    
    print(mouseX); //to help me debug
    
	push();

    translate(width / 2, 0); //translates origin to center of width

	rotate(radians(-swing)); //rotates everything around translated origin (0,0)

	strokeWeight(5);
    stroke(200, 150, 30);
	line(0, 0, circleX, circleY);//line connecting watch to origin

	strokeWeight(0);

	fill(200, 150, 30);
	ellipse(circleX, circleY, bigCircleR, bigCircleR); //draws outside of watch
    
  
	fill(200, 150, 30);
	ellipse(circleX , circleY - bigCircleR / 2, topEllipseW, topEllipseH);//draws top nubbin of watch
	
	
	fill(255);
	ellipse(circleX, circleY, smallCircleR, smallCircleR); //draws face of watch
	
	fill(0);
	ellipse(circleX, circleY, centerCircleR, centerCircleR); // draws center of watch

    strokeWeight(4);
    stroke(0);
	line(circleX, circleY, 30, circleY - 30); //hour hand

	push();
	translate(circleX, circleY); //translates origin to center of watch
	line(0, 0, minuteHand, minuteHand); //draws minute hand
	pop();

  
    pop();


}


This project has definitely been the most challenging for me so far. I enjoyed the premise of it, things just got really difficult when I ran into the problem of how to make the pendulum stop spinning and change directions to swing the other way. Thank you so much to the TA’s who helped me on how I could think through the problem!

Alexandra Kaplan – Looking Outwards – 03

3D printed seashells

One project I found while looking on the Digital Fabrication Flicker that is linked to on the course website really stood out to me. It is a project created by flickr user fdecomite who 3D prints seashells. These seashells seem to be so much like the real thing that at first I couldn’t believe they were 3D printed.
I am not sure how the different code and algorithms helped to make the seashells but I think it could use some sort of random pattern generator for the color and an algorithm for the ratios for the different parts of the shell. The art really shines through in the patterns on the shells and just how natural they seem. I can imagine it must have taken hours of studying seashells to understand the complex patterns that appear upon them.

Note: I tried to find a website for the artist but was unable to.