![[OLD FALL 2018] 15-104 • Introduction to Computing for Creative Practice](../../wp-content/uploads/2020/08/stop-banner.png)
//Audrey Zheng
//Section A
//audreyz@andrew.cmu.edu


var cubex = 10;
var cubey = 20;
var cubeWidth = 20;

var cube;
var cube2;


var cx;
var cy;

var systems;


function setup() {
    createCanvas(300, 300);
    background(220);


    // osc = new p5.TriOsc();
    // osc.freq(880.0);
    // osc.amp(0.1);
    // osc.start();


    cx = width/2;
    cy = width/2;

    cube1 = new cube(200,30);
    cube2 = new cube(20,20);
    cube3 = new cube(150,150);


    systems = [];


}

function draw() {
    if (millis() > 2000) {
        //osc.stop();
        //noLoop();
    }

    //rect(cubex, cubey, cubeWidth, cubeWidth);

    cube1.display();
    cube2.display();
    cube3.display();

    for (i = 0; i <systems.length; i ++) {
        systems[i].display();
    }

    if (systems.length==0) {
        textAlign(CENTER);
        text("Click to add cubes", width/2, height/2);
    }

}

function cube(x,y) { //the cube
    this.x = x;
    this.y = y;

    this.width = 20;


    this.NW =[this.x, this.y];
    this.NE = [x+this.width, this.y];

    this.SE = [this.x+this.width, y+this.width];

    this.SW = [this.x, y+this.width];

    this.larger = new square(x,y,this.width, this.width);
    this.smaller = new square(x + (cx -x) * 0.25, y + (cy - y) *0.25, this.width * 0.75, this.width * 0.75);


    this.NWs =[(this.x + (cx - this.x) * 0.20), this.y + (cy - this.y) * 0.20];

    this.NEs = [(this.x + (cx - this.x) * 0.20) + (this.width * 0.8), this.y + (cy - this.y) * 0.20];

    this.SEs = [(this.x + (cx - this.x) * 0.20) + (this.width * 0.8), this.y + (cy - this.y) * 0.20 + (this.width * 0.8)];

    this.SWs = [(this.x + (cx - this.x) * 0.20), this.y + (cy - this.y) * 0.20 +(this.width * 0.8)];


    this.display = function() {
        rect(this.x, this.y, this.width, this.width);
        rect(this.x + (cx - this.x) * 0.20, this.y + (cy - this.y) * 0.20, this.width * 0.8, this.width * 0.8);
        line(this.NW[0], this.NW[1], this.NWs[0], this.NWs[1]);
        line(this.NE[0], this.NE[1], this.NEs[0], this.NEs[1]);
        line(this.SE[0], this.SE[1], this.SEs[0], this.SEs[1]);

        line(this.SW[0], this.SW[1], this.SWs[0], this.SWs[1]);


    };

}

function square(x,y,w,h) {
    this.x = x;
    this.y = y;
    this.width = w;
    this.height = h;

    this.getCorners = function() {
        var NW =[x-w/2,y-h/2];
        //print(NW);
        var NE = [x+w/2, y-h/2];
        var SE = [x+w/2, y-h/2];
        var SW = [x-w/2, y+h/2];

        return [NW,NE,SE,SW];
    };
}


function mousePressed() {
    this.p = new cube(mouseX,mouseY);
    systems.push(p);
    print(systems);
}


function fillFront() {

}

function fillBottom() {

}

function fillTop() {

}

function fillLeft() {

}

function fillRight() {

}Author: Audrey
Audrey Zheng – Looking Outwards – 12
![]()
This is an audio visualizer created by Willian Justen, Luis Henrique, and Marcio Ribeiro that I found on github. Music visualization, a feature found in electronic music visualizers and media player software, generates animated imagery based on a piece of music. The imagery is usually generated and rendered in real time and in a way synchronized with the music as it is played.
View the page here.
I enjoyed this project because it was cathartic just looking at the page. I liked how the low, loud beats corresponded to larger ellipses forming on the screen. From a artistic standpoint, the project is aesthetically pleasing and calming.
This is a weather visualizer made by George Edmonds. This is rather simple in execution, the site simply fetches the weather data and then chooses from a set of hardcoded icecreams to visualize. Still, I thought it was a fun idea.
Audrey Zheng – Looking Outwards – 11
The creators: Binaura is making creative coding, interaction design, experimental interfaces, sonic toys and other, reactive environments. The collective regularly gives international workshops and lectures on these topics. The collective consists of Ágoston Nagy and Bence Samu.
Atlås is an anti game environment that generates music among a conversational cognitive space. As part of its existence, there are automatically generated tasks that are solved by machine intelligence without the need of human input. It also asks questions ad infinitum: questions that are dealing with presence, human cognition and imagination, corporate driven automatisms, advanced listening practices, silence.
I picked this beautiful app because of its beautiful generative UI. I love the geometric forms, flat design with shadows, circular text and color scheme. It makes for a very aesthetically pleasing composition.
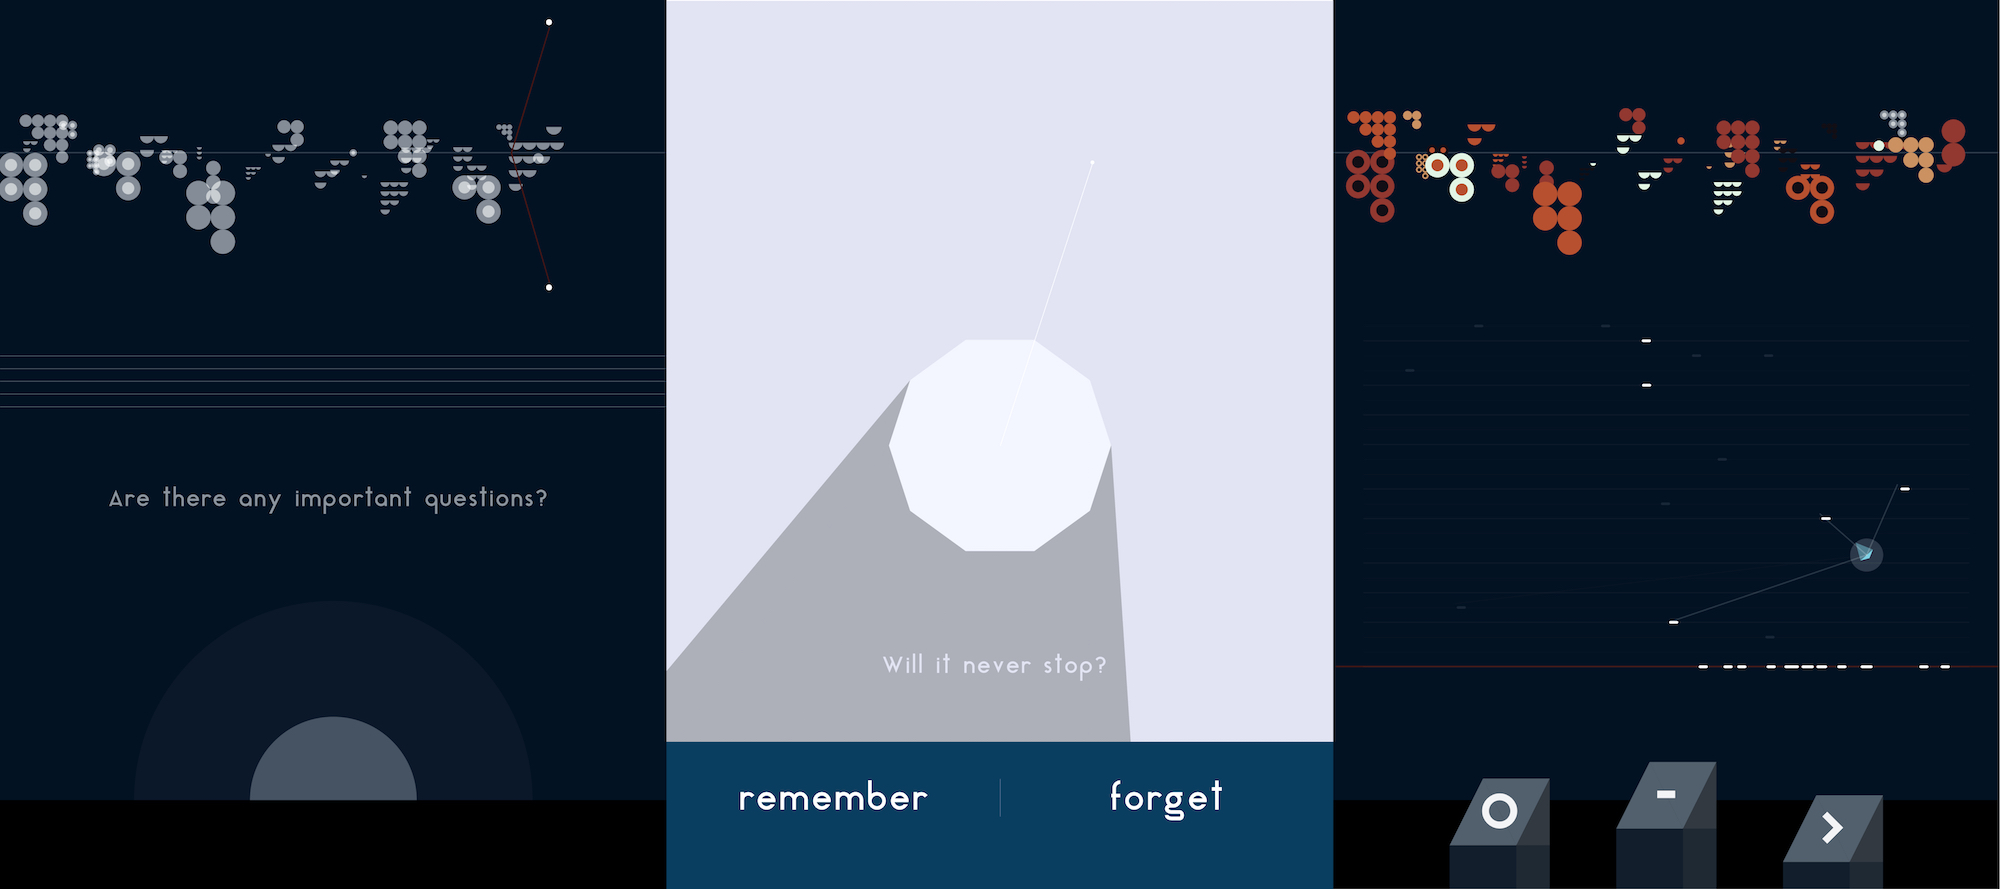
How it was made: The project is developed with free and open source tools with an educational aspect in mind. The main application is written in javascript, using the p5js library that is embedded into a regular Swift iOS application. This example template can be used to write and play with your own app using p5js within an iOS app. The sound synthesis is written in Pure Data, that is a useful graphical programming language to develop interactive sonic events. It can be integrated into all type of projects and applications using LibPd. This example template can be used to write and play with your own app using libPd within an iOS app.
Audrey Zheng – Looking Outwards – 10
Lauran McCarthy is goals: she is a new media artist and creator/lead-developer of p5.js. Her work examines how issues of surveillance, automation, and network culture affect our social relationships.
Accomplishments
Lauren’s work has been exhibited internationally, at places such as Ars Electronica, Fotomuseum Winterthur, SIGGRAPH, Onassis Cultural Center, IDFA DocLab, and the Japan Media Arts Festival. Lauren is an Assistant Professor at UCLA Design Media Arts. She is a Sundance Institute Fellow and was previously a resident at CMU STUDIO for Creative Inquiry, Eyebeam, Autodesk, NYU ITP, and Ars Electronica / QUT TRANSMIT³.
Schooling
She graduated from MIT with a BS in Computer Science and Art and Design and also holds an MFA from UCLA.
Example Project: Facebook Mood Manipulator
Facebook Mood Manipulator is a browser extension that lets you choose how you want to feel and filters your Facebook Feed accordingly.

It is based on Facebook’s research into massive-scale emotional contagion through social networks. The linguistic analysis is done with Linguistic Inquiry Word Count (LIWC), the same system used in the Facebook study. Studies show that browsing social media sites such as Facebook for extended periods can lead to a depressive mood.
For more information, visit Lauren’s website: http://lauren-mccarthy.com/
Audrey Zheng – Project 09
//Audrey Zheng
//Section A
//audreyz@andrew.cmu.edu
//Project 9

var img;

function preload() {
	var me = "https://i.imgur.com/iiz3eb4.jpg";
	img = loadImage(me);
}
function setup() {
    createCanvas(480, 480);
    background(0);
    img.loadPixels();
    frameRate(100);
}

function draw() {
	var px = random(width);
	var py = random(height);
	var ix = constrain(floor(px), 0, width);
	var iy = constrain(floor(py), 0, height);
	var color = img.get(ix,iy);

	noStroke();
	fill(color);
	shape(px,py,random(4,9),random(9,15));

}


function shape(x, y, r, n) {
  var angle = TWO_PI / n;
  beginShape();
  for (var a = 0; a < TWO_PI; a += angle) {
    var sx = x + cos(a) * r;
    var sy = y + sin(a) * r;
    vertex(sx, sy);
  }
  endShape(CLOSE);
}Audrey Zheng – Looking Outwards – 09
Yiran Xuan’s Looking Outwards 08 caught my attention because Yiran wrote about Darius Kazemi, who programs “Meme machines”. As a meme lover myself, I was surprised that there is a formula to be followed in the creation of memes. Memes have always felt so surreal and witty that only people would be able to come up and relate to them because of their shared experiences. I was confused by exactly how ConceptNet works: “ConceptNet, a program that links words with each other by their meaning.”, so I did more research. ConceptNet is a freely-available semantic network, designed to help computers understand the meanings of words that people use.ConceptNet originated from the crowdsourcing project Open Mind Common Sense, which was launched in 1999 at the MIT Media Lab. It has since grown to include knowledge from other crowdsourced resources, expert-created resources, and games with a purpose, according to ConceptNet.io. It makes more sense that using crowdsourced relations some of the Meme machine jokes are funny due to their vague nature that’s often open to interpretation.
Read about Darius Kazemi here.
Audrey Zheng – Looking Outwards -08
ROBOTIC VOICE ACTIVATED WORD KICKING MACHINE
The physical part of the piece consists of four bells of baritone horns, tubing, microphone, speakers, a mechanical foot and a projector. The software is written in openFrameworks.
When the software starts, it launches a web browser and creates a WebSocket connection to it. When someone starts speaking, the software sends a message to the browser to tell it to start speech recognition. Once the person finishes speaking, the browser sends words back as text back over the WebSocket connection. Each word is then added to a Box2D physics simulation as a series of rectangles linked together with springs. There’s a mesh for each letter and shadows are created in GLSL with a shadow map.
When a word is near the foot, the computer sends a message to an Arduino telling it to kick. The foot is actuated with a linear actuator driven by a Pololu Dual VNH5019 Motor Driver Shield. There is also a foot polygon in the physics simulation. Every time the mechanical foot starts to kick, the virtual foot in the physics engine is animated with a timeline that has been matched to the actual movement of the mechanical foot.
Neil Mendoza – Neil’s work uses digital and mechanical technologies to bring inanimate objects and spaces to life. Using this medium, he explores the absurd, the humorous, the futile and the surreal. He has an MA in math and computer science from Oxford University and an MFA in design media art from UCLA.
Neil is very accomplished: He has created digital artworks and installations for a wide range of clients including Accenture, Adidas, AntiVJ, Arcade Studios, Audi, Bentley, Brother, Burton Snowboards, Doritos, Ford, Guild LA, HTC, Jason Bruges Studio, LCF, The Light Surgeons, Moving Brands, New Angle, Nokia, Nuit Sonores, O2, Orange, Poke, Swatch, Universal Everything, Wieden & Kennedy and Wired Magazine. He was also a co-founder of is this good?
I first saw his work at The Festival of the Impossible in San Francisco. The festival of the Impossible is an event that celebrates artists who are pushing past the boundaries of Reality. The event features many brand new works in new media, including AR/VR. It’s inspirational to see the rise of new creative technologists and the blurring of medias and genres.
Audrey Zheng – Project – 07
//Audrey Zheng
//Section A
//audreyz@andrew.cmu.edu
//Project-07


function setup() {
    createCanvas(400, 600);
}

function draw() {
	background(81,60,85);
    push();
    translate(width / 2, height / 3);

	drawHypotrochoid();
	drawHypocycloid();
	drawEpicycloid();

	pop();

	drawFlower(40,20);

}

function drawFlower(x,y) {

    translate(x, y);
	drawHypotrochoid();
	drawHypocycloid();
	drawEpicycloid();


}

function drawHypotrochoid() {
	var x;
	var y;

	var a = 100; //radius
	//var a = map(mouseX,0,width, 50,90);
	var b = 20; //spirograph radius

	//var b = map(mouseX,0,width,5,20);
	 //distance pen to center of spirograph

	var h = map(mouseX, 0, width, 40,60);


	//var h = map(mouseX, 0, width, 40,60);

	angleMode(DEGREES);
	stroke(189,230,137);
	fill(82,82,115);

	beginShape();


	for (var t = 0; t < 360; t++) {
		x = (a - b) * cos(t) + h * cos(((a - b)/b) * t);
		y = (a - b) * sin(t) - h * sin(((a - b))/b * t);


		vertex(x,y);


	}

	endShape(CLOSE);


}

function drawHypocycloid() {
	var x;
	var y;

	var a = 50; //radius
	//var a = map(mouseX,0,width, 50,90);
	var b = 10; //spirograph radius
	var n =  a/b;

	angleMode(DEGREES);

	stroke(98,210,159);
	fill(57,138,166,70);

	beginShape();
	var multiple = map(mouseY,0,height, -1,1)

	for (var phi = 0; phi <360; phi ++) {

		x = (a/n) * ((n-1) * cos(phi) - cos((n-1) * phi));

		y = (a/n) * ((n-1) * sin(phi) + sin((n-1) * phi));

		vertex(multiple *x,multiple *y);

	}
	endShape(CLOSE);
}

function drawEpicycloid() {
	var x;
	var y;

	var a = 40; //radius
	//var a = map(mouseX,0,width, 50,90);
	var b = 5; //spirograph radius

	angleMode(DEGREES);


	beginShape();


	var multiple = map(mouseY, 0, height, 1,2);;

	for (var phi = 0; phi <360; phi ++) {

		x = (a+ b) * cos(phi) - b * cos(((a + b)/b) * phi);

		y = (a + b) * sin(phi) -  b * sin(((a+b)/b) * phi);

		vertex(multiple *x, multiple *y);


	}
	endShape(CLOSE);

}Audrey Zheng – Looking Outwards -07

This is an infographic created by the company Graphicacy. I thought this start up was cool because they specialize in making information visual, persuasive and shareable. Starting with an in-depth discovery process, Graphicacy builds websites and interactive applications, and produce data visualization and information graphics, motion graphic videos and data analysis. Their team specializes in open source solutions including Drupal, WordPress, and Angular.

There is something about the moving image that draws me to these statistics. It is much easier for me to visualize the difference between ethnic groups with the people, versus seeing a number (16 million). The chart allows me to toggle between ‘view as one group’ and ‘view as race’ and the people will run and change color.

this one lets you see the distribution as well
See more of Graphicacy’s work here.
Audrey Zheng- Project-06
//Audrey Zheng
//Section A
//audreyz@andrew.cmu.edu
//Assignment-06-C


function setup() {
    createCanvas(300, 300);
}

function draw() {
	background(220);

	var h = hour();
	var  m = minute();
	var s = second();

	text(h + ":" + m + ":" + s, 125, 20);

	ellipseMode(CENTER);
	ellipse(width/2,height/2,200,200)

	translate(width/2,height/2);
	rotate(3 * PI /2);


	for (var i = 0; i < 60; i++) {
		push();
		rotate(TWO_PI * i /60);

		stroke(170);
		if (i == 0) {
			stroke(255,0,0);
			line(80,0,100,0);
		}

		else if (i %5 == 0) {
			line(80,0,100,0);
		}

		else {
			line(90,0,100,0);
		}

		pop();
	}

	//second
	var x = 100 *cos(TWO_PI * s /60) ;
	var y = 100 *sin(TWO_PI * s /60) ;

	line(0,0,x,y);

	//hour
	strokeWeight(5);
	var x = 50 *cos(TWO_PI * h /12) ;
	var y = 50 *sin(TWO_PI * h /12) ;

	line(0,0,x ,y);

	//minute
	strokeWeight(3);
	var x = 80 *cos(TWO_PI * m /60) ;
	var y = 80 *sin(TWO_PI * m /60) ;

	line(0,0,x ,y );


}