Jamie Dorst Project 07 Curves

sketch

/*
Jamie Dorst
jdorst@andrew.cmu.edu
Section A
Project-07
*/

function setup() {
    createCanvas(480, 480);
}

function draw() {
    background(0);
    stroke(255);
    noFill();
    // draw graph lines
    strokeWeight(0.25);
    line(width / 2, 0, width / 2, height);
    line(0, height / 2, width, height / 2);
    // move to center of canvas
    translate(width / 2, height / 2);
    // draw graph
    strokeWeight(1);
    epispiral();
}

function epispiral() {
    var nPoints = 1000;
    var r;
    // constrain mouseX and Y to canvas borders
    // multiply to give bigger range
    var a = 20 * constrain((mouseX / width), 0, 1);
    var n = 5 * constrain((mouseY / height), 0, 1);
    /*var a = 1
    var n = 6*/
    var theta;
    var x;
    var y;

    beginShape();
    for (var i = 0; i < nPoints; i++) {
        // theta goes from 0 to two pi
        theta = map(i, 0, nPoints, 0, TWO_PI);
        // function
        r = a / cos(n * theta);
        // compute x and y
        x = r * cos(theta);
        y = r * sin(theta);
        // draw points until end shape
        vertex(x, y);
    }
    endShape();
}

For this project I chose to develop the epispiral. I really liked that this curve was open and that I had two variables I could make attached to mouseX and Y. MouseX controls how far from the center of the graph it starts, and mouseY controls n, how many “branches” there are. I think it’s really interesting to look at, especially in it’s primitive forms when it is just a circle and something that reminds me of the golden ratio.

Examples of the epispiral from Wolfram

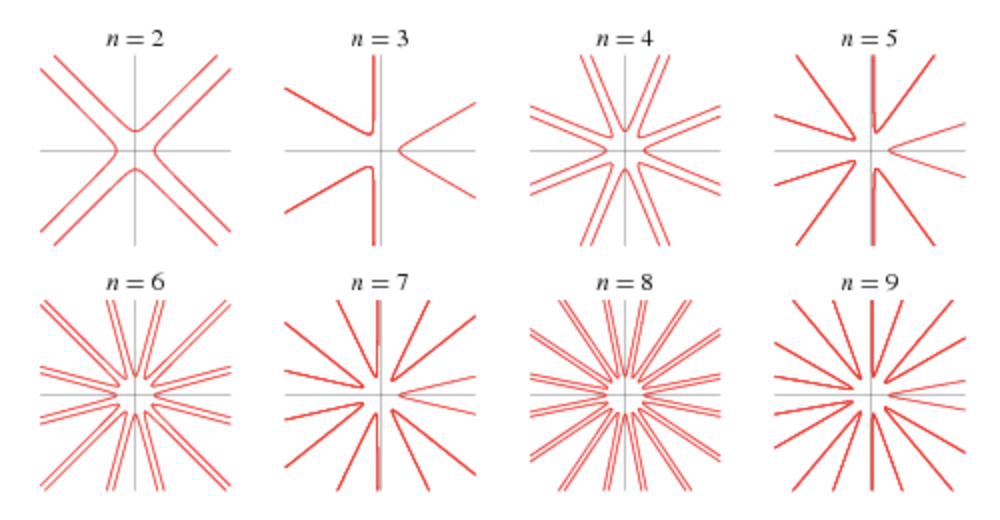
I had trouble getting started on this project, but once I figured out beginShape and endShape and examined the sample code some more, I got the hang of it. I really like how it turned out because you can see the in-betweens of these stages that Wolfram gave. You can see the lines getting longer from the center before they actually turn into this shape and I think it’s cool that you can visualize it like this and get a better idea of what’s going on behind the pictures.

Jamie Dorst Looking Outward 07

For this week’s looking outward, I am choosing to write about The Opportunity Atlas, a collaboration between Opportunity Insights and the Census Bureau. The map application was developed by Darkhorse Analytics.

A description of The Opportunity Atlas and what it can be used for.
The Opportunity Atlas looking at the country as a whole, comparing household income currently for each area of the people who grew up there.

I really liked this project because I found it extremely interesting. I grew up in the Bay Area, where it isn’t uncommon to have a six figure salary coming from both parents–but I had a very different experience. It was really interesting just exploring the website, and seeing how different areas of the map, both in all of America and my hometown, had patterns. For example, my hometown is very affluent overall, but the town just next door is exactly the opposite.

My hometown–each colored section represents a different household income today for someone who grew up here, compared locally to the area

Another interesting part of this project was to look at racial differences. Overall in the country, when you compare household income from people who grew up in certain areas, the maps are extremely different for black people than they are for white people.

The Opportunity Atlas only looking at data from white people.
The Opportunity Atlas only looking at data from black people.

I thought that this project was not only interesting, but very important. It shines light on something that a lot of people don’t notice, simply because their hometowns are usually in a slight bubble. When everyone around you is at the same place, it is much harder to notice the advantages or disadvantages you might have. It’s really inspiring to me that they were able to compute to visualize this data, because of how important I believe this is.

Jamie Dorst Project 06 Abstract Clock

sketch

/*
Jamie Dorst
jdorst@andrew.cmu.edu
Section A
Project-06
*/

//VARIABLES
//shelf height
var shelfY = [100, 220, 340, 460];

// flame vertices
var flameX1 = 35;
var flameY1 = 40;
var flameX2 = 45;
var flameX3 = 40;
var flameY3 = 20;
// candle width
var candleW = 30;
// candle x positions array
// 6 variables, same in every column, increasing by 80
var candleX = [25, 105, 185, 265, 345, 425];
// candle y positions array
// 4 variables, same in every row
var candleY = [];
// candle heights
// one for each candle
var candleH = [];
// color arrays
var flameColors = ['orange', 'gold'];
var fColor = 0;
var woodColors = ['saddlebrown', 'peru'];
var wColor = 0;

function setup() {
    createCanvas(480, 480);
    
}

function draw() {
    background('black');
    // time variables
    var h = hour();
    var m = minute();
    var s = second();
    noStroke();

    // WOOD SHELVES
    // alternate wood color every minute
    if (m % 2 === 0) {
        wColor = 0;
    } else {
        wColor = 1;
    }
    // draw four shelves
        fill(woodColors[wColor]);
        rect(0, shelfY[0], 480, 20);
        rect(0, shelfY[1], 480, 20);
        rect(0, shelfY[2], 480, 20);
        rect(0, shelfY[3], 480, 20);

    // CANDLES
    // fill in y position array with 24 values
    // groups of 6, each increasing by 120
    // will change individually later as candles melt
    for (var i = 0; i < 6; i++) {
        candleY[i] = 40;
    }
    for (var i = 6; i < 12; i++) {
        candleY[i] = 160;
    }
    for (var i = 12; i < 18; i++) {
        candleY[i] = 280;
    }
    for (var i = 18; i < 24; i++) {
        candleY[i] = 400;
    }
    // fill in height array with 24 values of 60
    for (var k = 0; k < 24; k++) {
        candleH[k] = 60;
    }
    // one candle melts per hour
    for (var p = 0; p < 24; p++) {
        if (p < h) {
            candleH[p] = 0;
            candleY[p] = 0;
        } else if (p === h) {
            candleH[p] = candleH[p] - (candleH[p] * (m / 60));
            if (h < 6) {
                candleY[p] = shelfY[0] - candleH[p];
            }
            if (h >= 6 & h < 12) {
                candleY[p] = shelfY[1] - candleH[p];
            }
            if (h >= 12 & h < 18) {
                candleY[p] = shelfY[2] - candleH[p];
            }
            if (h >= 18 & h < 24) {
                candleY[p] = shelfY[3] - candleH[p];
            }
        }
    }
    // make four groups of six to draw the candles
    fill('white');
    // first row
    rect(candleX[0], candleY[0], candleW, candleH[0]);
    rect(candleX[1], candleY[1], candleW, candleH[1]);
    rect(candleX[2], candleY[2], candleW, candleH[2]);
    rect(candleX[3], candleY[3], candleW, candleH[3]);
    rect(candleX[4], candleY[4], candleW, candleH[4]);
    rect(candleX[5], candleY[5], candleW, candleH[5]);
    // second row
    rect(candleX[0], candleY[6], candleW, candleH[6]);
    rect(candleX[1], candleY[7], candleW, candleH[7]);
    rect(candleX[2], candleY[8], candleW, candleH[8]);
    rect(candleX[3], candleY[9], candleW, candleH[9]);
    rect(candleX[4], candleY[10], candleW, candleH[10]);
    rect(candleX[5], candleY[11], candleW, candleH[11]);
    // third row
    rect(candleX[0], candleY[12], candleW, candleH[12]);
    rect(candleX[1], candleY[13], candleW, candleH[13]);
    rect(candleX[2], candleY[14], candleW, candleH[14]);
    rect(candleX[3], candleY[15], candleW, candleH[15]);
    rect(candleX[4], candleY[16], candleW, candleH[16]);
    rect(candleX[5], candleY[17], candleW, candleH[17]);
    // fourth row
    rect(candleX[0], candleY[18], candleW, candleH[18]);
    rect(candleX[1], candleY[19], candleW, candleH[19]);
    rect(candleX[2], candleY[20], candleW, candleH[20]);
    rect(candleX[3], candleY[21], candleW, candleH[21]);
    rect(candleX[4], candleY[22], candleW, candleH[22]);
    rect(candleX[5], candleY[23], candleW, candleH[23]);

    // FLAMES
    // alternate flame color every second
    // draw flames
    if (s % 2 === 0) {
        fColor = 0;
    } else {
        fColor = 1;
    }
    fill(flameColors[fColor]);
    // move flames to follow candles
    for (var j = 0; j < 6; j++) {
        if (j === h) {
            flameX1 = candleX[j] + 10;
        }
    }
    for (var j = 6; j < 12; j++) {
        if (j === h) {
            flameX1 = candleX[j - 6] + 10;
        }
    }
    for (var j = 12; j < 18; j++) {
        if (j === h) {
            flameX1 = candleX[j - 12] + 10;
        }
    }
    for (var j = 18; j < 24; j++) {
        if (j === h) {
            flameX1 = candleX[j - 18] + 10;
        }
    }
    flameY1 = candleY[h];
    flameX2 = flameX1 + 10;
    flameX3 = flameX1 + 5;
    flameY3 = flameY1 - 20;
    triangle(flameX1, flameY1, flameX2, flameY1, flameX3, flameY3);
}

For this week’s project, I made a clock based on 24 candles, where the flame changes color every second, the wooden shelves change color every minute, and one candle melts per hour. I wanted to show time as something that we run out of every day, to give perspective on how we use it. I struggled a lot with this project; I didn’t realize how complicated it would be. But, I think I also learned a lot from it and I’m very satisfied that I got it to work in the end.

Jamie Dorst Looking Outwards 06

For this week’s looking outward, I found my piece of random art on a website called the ReCode Project. The ReCode Project is a “community-driven effort to preserve computer art by translating it into a modern programming language (Processing). Every translated work will be available to the public to learn from, share, and build on.” The piece I am focusing on is based on Untitled 4, by various artists, recoded by Corneel Cannaerts.

Untitled 4, a piece of computer generated art that takes in random values every time it is clicked.

Every time the mouse is clicked, the lines/rectangles generate in a new way. I liked this piece because it is very geometric and everyone would see something different in it (especially because it is random). I also liked how the vertical lines almost look like a background, and the horizontal ones seem to pop out as if they are 3D on top of the vertical lines. This was made with Processing, which I also liked because it is similar to what we are using in this class. I thought that the ReCode project overall was also a great idea, I like that it is focused on helping the society as a whole learn from these projects.

Jamie Dorst Project 05 Wallpaper

sketch

/*
Jamie Dorst
jdorst@andrew.cmu.edu
Section A
Project-05
*/

var xPosition = -25;
var yPosition = -10;
var r = 133;
var g = 198;
var b = 199;

function setup() {
    createCanvas(600, 400);
    background(255);
}

function concentricCircle() {
    // draw concentric circles with diameter 50
    var diam = 50;
    // draw circles inside the previous circle until 0
    for(var i = 50; i > 0; i -= 10) {
        fill(r, g, b);
        ellipseMode(CENTER);
        ellipse(xPosition, yPosition, diam, diam);
        diam -= 10;
    }
}

function draw() {
    // make an offset grid of concentric circles
    for(var j = 0; j < 625; j += 50) {
        xPosition += 25;
        r += 5;
        g -= 2;
        for(var k = 0; k < 825; k += 50){
            concentricCircle()
            yPosition += 25;
            b -= 1;
        }
        yPosition = -10;
    }
}

This project was pretty cool once I started going. I drew inspiration from this picture, and the scale-like texture it has.

I had trouble figuring out how to get the for loops to work at first, but once I figured that out it went pretty smoothly. I took the concept from the lab this week of making a color gradient, and then also tried defining my own variable to actually make the concentric circles. Overall I’m happy with how it turned out, and I think I learned from this.

Jamie Dorst Looking Outward 05

For this looking outward, I chose this project titled Back to School, drawn by Vivien Bertin and modeled by Patrick Evrard in 2015. I chose this project because I have a good amount of experience with 3D modeling using Autodesk Maya, and I know how hard it can be. I was really impressed with the lighting and the detail achieved in this model, including how dynamic the hair is, how there are even little drops of saliva coming out of her mouth, and the texture of the sweater. I thought it was really great how they managed to bring her to life even though she is a static image–she has a lot of personality. I would’ve loved to see a wireframe of this model to see how it was made. I also would’ve loved to know what software they used to make this, and see more pictures of the process itself.

Jamie Dorst Project 04 String Art

sketch

/*
Jamie Dorst
Section A
jdorst@andrew.cmu.edu
Project-04
*/

function setup() {
    createCanvas(400, 300);
    background(0);
}

function draw() {
    // variables
    var x1 = 10;
    var y1 = 10;
    var x2 = 20;
    var y2 = 20;
    var x3 = 350;
    var y3 = 15;
    var x4 = 10;
    var y4 = 295;
    var x5 = 10;
    var y5 = 10;
    var x6 = 20;
    var y6 = 20;  
    var x7 = 350;
    var y7 = 15; 
    var x8 = 10;
    var y8 = 295;
// BOTTOM LEFT CORNER

    // draw bottom left white background lines
    // change y coordinate of first point
    // change x coordinate of second point
    for (var i = 0; i < 50; i++) {
        stroke('white');
        x5 += 9;
        y5 += 11;
        line(0, y5, x5, 300);
    }
    // draw bottom left blue lines
    // change y coordinate of first point
    // change x coordinate of second point
    for (var i = 0; i < 50; i++) {
        stroke('blue');
        x1 += 10;
        y1 += 12;
        line(0, y1, x1, 300);
    }

// TOP RIGHT CORNER

    // draw top right white background lines
    // change y coordinate of first point
    // change x coordinate of second point
    for (var i = 0; i < 50; i++) {
        stroke('white');
        x6 += 19;
        y6 += 22;
        line(400, y6, x6, 0);
    }
    // draw top right green lines
    // change y coordinate of first point
    // change x coordinate of second point
    for (var i = 0; i < 50; i++) {
        stroke('green');
        x2 += 20;
        y2 += 23;
        line(400, y2, x2, 0);
    }

// TOP LEFT CORNER

    // draw top left white background lines
    // change y coordinate of first point
    // change x coordinate of second point
    for (var i = 0; i < 50; i++) {
        stroke('white');
        x7 -= 26;
        y7 += 24;
        line(x7, 0, 0, y7);
    }
    // draw top left red lines
    // change y coordinate of first point
    // change x coordinate of second point
    for (var i = 0; i < 50; i++) {
        stroke('red');
        x3 -= 27;
        y3 += 25;
        line(x3, 0, 0, y3);
    }

// BOTTOM RIGHT CORNER

    // draw bottom right yellow lines
    // change y coordinate of first point
    // change x coordinate of second point
    for (var i = 0; i < 50; i++) {
        stroke('white');
        x8 += 16;
        y8 -= 18;
        line(400, y8, x8, 300);
    }
    // draw bottom right yellow lines
    // change y coordinate of first point
    // change x coordinate of second point
    for (var i = 0; i < 50; i++) {
        stroke('yellow');
        x4 += 15;
        y4 -= 19;
        line(400, y4, x4, 300);
    }
}

For this project I wanted to practice doing for loops. I had trouble figuring out how to move the lines from the bottom left corner, especially getting them into the top left and bottom right corners, because I had to make some values negative. After I figured that out, I wanted to emphasize the shapes of the lines so I made the background black, and added background lines to each corner to make them pop. Overall I found this project sort of difficult, but it was cool once it finally worked.

Jamie Dorst Looking Outward 04

For this week’s Looking Outward post, I chose to write about The Classyfier. The Classyfier is a table that recognizes sounds from beverages (the clink of a wine glass, a can opening, a spoon stirring tea, etc.) and automatically plays appropriate music.

The Classyfier–a sound detecting music automator.

I admire this project because I think it’s a really creative use of AI. Even though I don’t think this is the most urgent or influential project, I think it’s cool that we can use this technology to create more projects in the future; A smart music playing table might not change the world, but we can use this technology to make something that will. In the article linked above, it says that they used Wekinator, Processing, and the OFX Collection. I also found it cool that they used processing because that’s similar to p5.js. It’s inspiring that projects like this are being made in a language very similar to the one that we’re learning, meaning that we are that much closer to creating this type of stuff ourselves.

Video demonstrating The Classyfier in action

Jamie Dorst Project 03 Dynamic Drawing

sketch

/*
Jamie Dorst
Section A
jdorst@andrew.cmu.edu
Project-03
*/

// variables
var saturation1 = 50
var hue1 = 0
var radius = 50
var lineX1 = 100

var ballX1 = 320
var ballY1 = 240
var ballX2 = 240
var ballY2 = 320
var ballX3 = 150
var ballY3 = 300


function setup() {
    createCanvas(640, 480);
    text("p5.js vers 0.7.1 test.", 10, 15);
}

function draw() {
    stroke(255);
    strokeCap(PROJECT);
    colorMode(HSB);
    background(hue1, saturation1, 100);

    // change background color as mouse moves
    // change mouseY to change hue
    // change mouseX to change saturation
    if (mouseX >= 0 & mouseX <= width && mouseY >= 0 && mouseY <= height) {
        saturation1 = mouseX / 5
        hue1 = mouseY
    }

    // draw white line when mouse goes over it
    // lines are 30 away from each other, all the same length
    // stroke increases by 0.2 with each line
    if (mouseX >= 70) {
        line(70, 40, 70, 440);
        strokeWeight(2);
    }
    if (mouseX >= 100) {
        line(100, 40, 100, 440);
        strokeWeight(2.2);
    }
    if (mouseX >= 130) {
        line(130, 40, 130, 440);
        strokeWeight(2.4);
    }
    if (mouseX >= 160) {
        line(160, 40, 160, 440);
        strokeWeight(2.6);
    }
    if (mouseX >= 190) {
        line(190, 40, 190, 440);
        strokeWeight(2.8);
    }
    if (mouseX >= 220) {
        line(220, 40, 220, 440);
        strokeWeight(3);
    }
    if (mouseX >= 250) {
        line(250, 40, 250, 440);
        strokeWeight(3.2);
    }
    if (mouseX >= 280) {
        line(280, 40, 280, 440);
        strokeWeight(3.4);
    }
    if (mouseX >= 310) {
        line(310, 40, 310, 440);
        strokeWeight(3.6);
    }
    if (mouseX >= 340) {
        line(340, 40, 340, 440);
        strokeWeight(3.8);
    }
    if (mouseX >= 370) {
        line(370, 40, 370, 440);
        strokeWeight(4);
    }
    if (mouseX >= 400) {
        line(400, 40, 400, 440);
        strokeWeight(4.2);
    }
    if (mouseX >= 430) {
        line(430, 40, 430, 440);
        strokeWeight(4.4);
    }
    if (mouseX >= 460) {
        line(460, 40, 460, 440);
        strokeWeight(4.6);
    }
    if (mouseX >= 490) {
        line(490, 40, 490, 440);
        strokeWeight(4.8);
    }
    if (mouseX >= 520) {
        line(520, 40, 520, 440);
        strokeWeight(5);
    }
    
    // erase black line when mouse goes over it
    // lines are 30 away from each other, 15 away from the white lines, all the same length
    stroke(0, 0, 0);

    if (mouseX <= 115) {
        line(115, 40, 115, 440);
    }
    if (mouseX <= 145) {
        line(145, 40, 145, 440);
    }
    if (mouseX <= 175) {
        line(175, 40, 175, 440);
    }
    if (mouseX <= 205) {
        line(205, 40, 205, 440);
    }
    if (mouseX <= 235) {
        line(235, 40, 235, 440);
    }
    if (mouseX <= 265) {
        line(265, 40, 265, 440);
    }
    if (mouseX <= 295) {
        line(295, 40, 295, 440);
    }
    if (mouseX <= 325) {
        line(325, 40, 325, 440);
    }
    if (mouseX <= 355) {
        line(355, 40, 355, 440);
    }
    if (mouseX <= 385) {
        line(385, 40, 385, 440);
    }
    if (mouseX <= 415) {
        line(415, 40, 415, 440);
    }
    if (mouseX <= 445) {
        line(445, 40, 445, 440);
    }
    if (mouseX <= 475) {
        line(475, 40, 475, 440);
    }
    if (mouseX <= 505) {
        line(505, 40, 505, 440);
    }
    if (mouseX <= 535) {
        line(535, 40, 535, 440);
    }
    if (mouseX <= 565) {
        line(565, 40, 565, 440);
    }

    // draw medium ball
    // same as background color
    noStroke();
    fill(hue1, saturation1, 100);
    ellipse(ballX1, ballY1, 100, 100);
    // ball coordinates relative to mouse coordinates
    ballX1 = mouseX + 150
    ballY1 = mouseY * 3 - 400

    // draw biggest ball
    // same as background color
    ellipse(ballX2, ballY2, 180, 180);
    // ball coordinates relative to mouse coordinates
    ballX2 = mouseX / 2 + 200
    ballY2 = mouseY / 4 + 200

    // draw smallest ball
    // same as background color
    ellipse(ballX3, ballY3, 60, 60);
    // ball relative to mouse coordinates
    ballX3 = mouseX * 3 - 300
    ballY3 = mouseY / 2
}

I started this project by making the background change and then adding the lines. Then I had the idea to add the circles so that it looked like they weren’t really there, it was just their silhouettes matching the background. I first made the balls bounce around because I thought that looked cool, but then I realized we weren’t supposed to have any elements that were random, so I changed it so that they are attached to the mouse coordinates. I also tried making the line position a variable so that I wouldn’t have to type in numbers for every line, but I couldn’t figure out a way to make that work.

Jamie Dorst Looking Outward 03

For this week’s Looking Outward post, I decided to write about a project called Zero/Fold Screen made in 2010 by a design studio called Matsys.

Zero/Fold Screen–a light filtering undulating wooden screen.
A different view of Zero/Fold Screen, showing its interesting dimensions.

This screen is made of wood, and is light-filtering. It was placed in a gallery in Canada. I was inspired by this project because they used digital fabrication to help reduce their material waste. A lot of times when building these types of projects, the size of the material is considered at the end, resulting in a lot of wasted material. This project generated components based on the size of their materials, reducing waste. It wasn’t clear what software they used to create the components, but they were cut on a CNC.

Some of the components of Zero/Fold Screen, demonstrating how they were cut so as to fit the original piece of wood.

I think it’s really cool that they’re using this technology to create something that is practical for use and for sustainability. It inspires me to use technology to create things that are beneficial for the world. It shows me that it is possible to be mindful of the implications of what I am creating, so that I can make the best thing possible.