![[OLD FALL 2018] 15-104 • Introduction to Computing for Creative Practice](../../wp-content/uploads/2020/08/stop-banner.png)
/*
Jamie Dorst
jdorst@andrew.cmu.edu
Final Project
Section A
*/
// global variables
// weather
var weather;
var weatherUrl;
var temp;
var currentLocation;
var condition;
var city;
var rainConditions = ["Patchy light drizzle", "Light drizzle", "Freezing drizzle",
"Heavy freezing drizzle", "Patchy light rain", "Light rain",
"Moderate rain at times", "Moderate rain",
"Heavy rain at times", "Heavy rain", "Light freezing rain",
"Moderate or heavy freezing rain", "Light sleet",
"Moderate or heavy sleet", "Ice pellets", "Light rain shower",
"Torrential rain shower", "Light sleet showers",
"Moderate or heavy sleet showers", "Light showers of ice pellets",
"Moderate or heavy showers of ice pellets"];
var cloudyConditions = ["Cloudy", "Overcast", "Mist", "Patchy rain possible",
"Patchy snow possible", "Patchy sleet possible",
"Patchy freezing drizzle possible", "Thundery outbreaks possible",
"Fog", "Freezing fog"];
var snowyConditions = ["Blowing snow", "Blizzard", "Patchy light snow", "Light snow",
"Patchy moderate snow", "Moderate snow", "Patchy heavy snow", "Heavy snow"];
// custom variables
var button;
var cityInput;
var myFont;
// rain
var rainArray = [];
var rainAmount;
var rainSpeed;
var visibleR = false;
// snow
var snowflakeImg;
var snowArray = [];
var snowAmount;
var snowSpeed;
var visibleS = false;
// clouds
var cloudCover;
var cloudArray = [];
var cloudAmount;
var wind;
var rightWind = ["S", "SE", "E", "NE", "NNE", "ENE", "ESE", "SSE"];
var leftWind = ["N", "NW", "W", "SW", "SSW", "WSW", "WNW", "NNW"];
// preload weather API and snowflake image
function preload() {
weatherUrl = 'https://api.apixu.com/v1/current.json?key=8f4b2cd0980d46aba2e201006182511&q=Pittsburgh';
loadJSON(weatherUrl, getWeather);
snowflakeImg = loadImage('https://i.imgur.com/VADyEQ9.png');
}
function setup() {
createCanvas(480, 480);
// case insensitive
var lowCon = condition.toLowerCase();
// make rain/snow relative to how heavy it is
if (lowCon.indexOf('light') > -1) {
rainAmount = 10;
rainSpeed = 2;
snowAmount = 10;
snowSpeed = 1;
} else if (lowCon.indexOf('moderate') > -1) {
rainAmount = 15;
rainSpeed = 3;
snowAmount = 15;
snowSpeed = 2;
} else if (lowCon.indexOf('heavy') > -1) {
rainAmount = 20;
rainSpeed = 4;
snowAmount = 20;
snowSpeed = 3;
} else {
rainAmount = 30;
rainSpeed = 5;
snowAmount = 30;
snowSpeed = 4;
}
// make amount of clouds relative to cloud cover
cloudAmount = map(cloudCover, 0, 100, 0, 30);
// prepare for rain/snow/clouds by filling array
for (var i = 0; i < rainAmount; i++) {
rainArray[i] = makeRain(random(170, 313), random(0, 315));
}
for (var i = 0; i < snowAmount; i++) {
snowArray[i] = makeSnow(random(175, 305), random(0, 315));
}
for (var i = 0; i < cloudAmount; i++) {
cloudArray[i] = makeCloud(random(-75, width + 75), random(320, height),
random(100, 170), 175);
}
// let user name a city with input and button
cityInput = createInput();
cityInput.position(width - cityInput.width - 40, 20);
button = createButton('GO');
button.position(cityInput.x + cityInput.width + 5, 20);
button.mouseClicked(changeCity);
}
// function to allow enter key to also submit input
async function keyPressed() {
if (keyCode === ENTER) {
changeCity();
}
}
// function to change the weather to the user-inputted city
function changeCity() {
// give variable a default
city = 'Pittsburgh'
// change city to inputted city
city = cityInput.value();
cityInput.value('');
// reload weather data
weatherUrl = 'https://api.apixu.com/v1/current.json?key=8f4b2cd0980d46aba2e201006182511&q=' + city;
loadJSON(weatherUrl, getWeather);
}
async function cloudUpdate() {
// make amount of clouds relative to cloud cover
cloudAmount = map(cloudCover, 0, 100, 0, 30);
// refill arrays so animations change
for (var i = 0; i < rainAmount; i++) {
rainArray[i] = makeRain(random(170, 313), random(0, 315));
}
for (var i = 0; i < snowAmount; i++) {
snowArray[i] = makeSnow(random(175, 305), random(0, 315));
}
for (var i = 0; i < cloudAmount; i++) {
cloudArray[i] = makeCloud(random(-75, width + 75), random(320, height),
random(100, 170), 175);
}
}
// get weather data
function getWeather(weather) {
temp = Number(weather.current.temp_f);
condition = weather.current.condition.text;
currentLocation = weather.location.name;
cloudCover = weather.current.cloud;
wind = weather.current.wind_mph;
windDir = weather.current.wind_dir;
cloudUpdate();
}
async function draw() {
// background is light during day, dark during night
if (hour() > 8 & hour() < 18) {
background("#0077CC");
} else {
background("#00487C");
}
// font and size
noStroke();
textFont("Sans-serif");
textAlign(CENTER);
fill("EBF2FA");
textSize(30);
text(currentLocation, width / 2, 88);
textSize(100);
text(temp + "°", width / 2, 220);
textSize(18);
text(condition, width / 2, 120);
textSize(12);
text("Enter a city name or zip code to change location", 145, 28);
// draw based on weather conditions
if (condition === "Sunny") {
sunny();
} else if (condition === "Clear") {
clearSky();
} else if (condition === "Partly cloudy") {
sunny();
cloudy();
} else if (rainConditions.some(weatherTest) == true) {
rainy();
} else if (cloudyConditions.some(weatherTest) == true) {
cloudy();
} else if (snowyConditions.some(weatherTest) == true) {
snowy();
} else if (condition === ("Patchy light rain with thunder") ||
("Moderate or heavy rain with thunder")) {
rainy();
thunder();
} else if (condition === ("Patchy light snow with thunder") ||
("Moderate or heavy snow with thunder")) {
snowy();
thunder();
}
}
// test weather conditions
function weatherTest(value) {
return value == condition;
}
function directionTest(value) {
return value == windDir;
}
//======================SUNNY=========================
function sunny() {
// color of sun mapped to how hot it is
// redder when hotter, yellower when cooler
var sunColorG = map(temp, 0, 110, 230, 155);
noStroke();
fill(255, sunColorG, 0);
// draw sun
ellipse(width / 2, 350, 100, 100);
// draw sun rays
push();
angleMode(DEGREES);
translate(width / 2, 350);
for (var i = 0; i < 10; i++) {
fill ("orange");
triangle(0, -80, -10, -60, 10, -60);
rotate(36);
}
pop();
}
//======================CLEAR=========================
// function to draw moon
function clearSky() {
noStroke();
fill("#EBF2FA");
ellipse(width / 2, 350, 150, 150);
fill("#E3E9F2");
ellipse(270, 330, 20, 20);
ellipse(220, 360, 60, 60);
ellipse(200, 300, 10, 10);
ellipse(277, 400, 25, 25);
ellipse(250, 291, 30, 30);
}
//=====================CLOUDY=========================
// function to make rain drop objects
function makeCloud(x, y, cloudColor) {
var cloudObj = {
x: x,
y: y,
cc: cloudColor,
move: cloudMove,
render: renderCloud
};
return cloudObj;
}
// function to draw clouds
function renderCloud() {
noStroke();
fill(this.cc);
ellipse(this.x, this.y, 75, 75);
ellipse(this.x + 60, this.y - 17, 100, 100);
ellipse(this.x + 110, this.y + 5, 50, 50);
}
// function to make clouds move
// based on wind speed and direction
function cloudMove() {
if (leftWind.some(directionTest) == true) {
if (this.x > -160) {
this.x -= map(wind, 0, 50, 0, 10);
} else if (this.x <= -37.5) {
this.x = width + 160;
}
} if (rightWind.some(directionTest) == true) {
if (this.x < width + 37.5) {
this.x += map(wind, 0, 50, 0, 10);
} else if (this.x >= width + 37.5) {
this.x = -160;
}
}
}
// weather condition function
function cloudy() {
for (var i = 0; i < cloudAmount; i++) {
cloudArray[i].render();
cloudArray[i].move();
}
}
//======================THUNDER=======================
// function to draw thunder
function thunder() {
stroke("yellow");
noFill();
angleMode(DEGREES);
arc(300, 320, 60, 60, 280, 0);
arc(300, 320, 70, 70, 280, 0);
arc(190, 315, 85, 85, 180, 285);
arc(190, 315, 95, 95, 180, 285);
}
//======================RAIN==========================
// function to make rain drop objects
function makeRain(x, y) {
var raindrop = {
x: x,
y: y,
fall: rainFall,
render: renderRain,
visibleR: visibleR
};
return raindrop;
}
// function to draw rain
function renderRain() {
noStroke();
// only display raindrops when they are below the cloud
if (this.visibleR == false) {
ellipse(this.x, this.y, 0, 0);
} else {
ellipse(this.x, this.y, 7, 13);
}
}
// function to make rain fall
function rainFall() {
if (this.y < height) {
this.y += rainSpeed
} else if (this.y >= height) {
this.y = random(300, 315);
}
if (this.y < 315) {
this.visibleR = false;
} else {
this.visibleR = true;
}
}
// weather condition function
function rainy() {
// case insensitive
var lowCon = condition.toLowerCase();
// make rain relative to how heavy it is
if (lowCon.indexOf('light') > -1) {
rainAmount = 10;
rainSpeed = 2;
} else if (lowCon.indexOf('moderate') > -1) {
rainAmount = 15;
rainSpeed = 3;
} else if (lowCon.indexOf('heavy') > -1) {
rainAmount = 20;
rainSpeed = 4;
} else {
rainAmount = 30;
rainSpeed = 5;
}
// color of rain dependent upon temperature
fill(0, map(temp, 32, 100, 255, 0), 255);
for (var i = 0; i < rainAmount; i++) {
rainArray[i].render();
rainArray[i].fall();
}
var rainCloud = makeCloud(190, 315, 100);
rainCloud.render();
}
//=======================SNOW=========================
// function to make snowflake objects
function makeSnow(x, y) {
var snowflake = {
x: x,
y: y,
fall: snowFall,
render: renderSnow,
visibleS: visibleS
};
return snowflake;
}
// function to draw snow
function renderSnow() {
if (this.visibleS == false) {
image(snowflakeImg, -5, -5, 1, 1);
} else {
image(snowflakeImg, this.x, this.y, 15, 15);
}
}
// function to make snow fall
function snowFall() {
if (this.y < height) {
this.y += snowSpeed;
} else if (this.y >= height) {
this.y = 315;
}
if (this.y < 315) {
this.visibleS = false;
} else {
this.visibleS = true;
}
}
// weather condition function
function snowy() {
// case insensitive
var lowCon = condition.toLowerCase();
// make snow relative to how heavy it is
if (lowCon.indexOf('light') > -1) {
snowAmount = 10;
snowSpeed = 1;
} else if (lowCon.indexOf('moderate') > -1) {
snowAmount = 15;
snowSpeed = 2;
} else if (lowCon.indexOf('heavy') > -1) {
snowAmount = 20;
snowSpeed = 3;
} else {
snowAmount = 30;
snowSpeed = 4;
}
fill(255);
for (var i = 0; i < snowAmount; i++) {
snowArray[i].render();
snowArray[i].fall();
}
var snowCloud = makeCloud(190, 315, 100);
snowCloud.render();
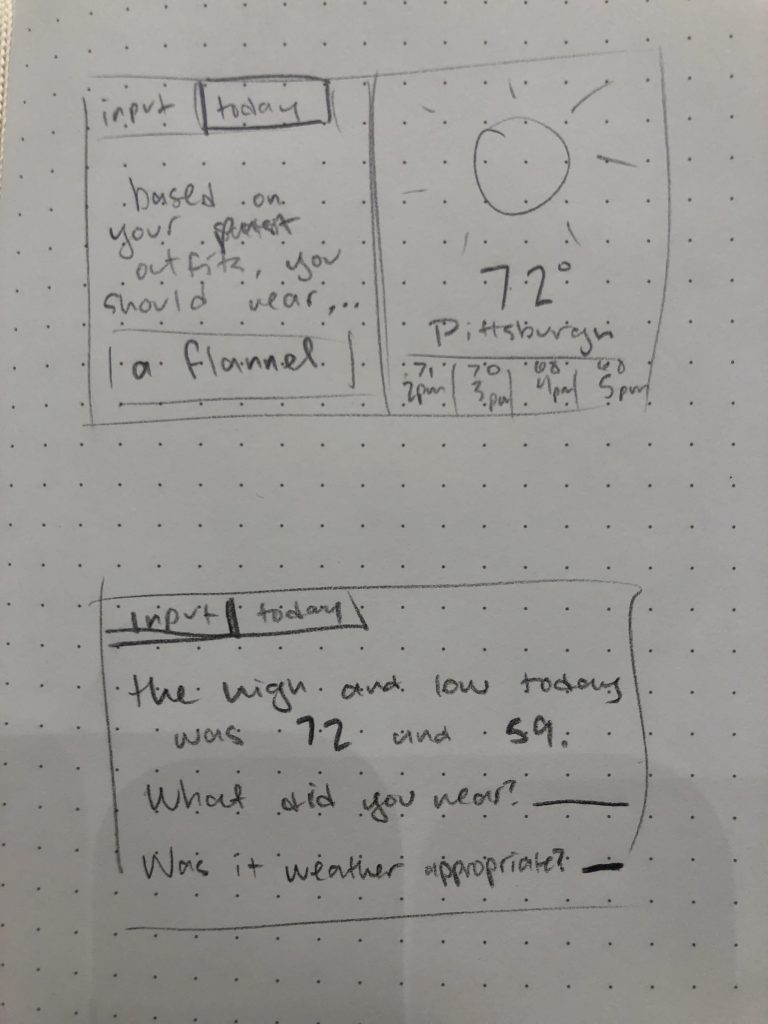
}For my final project, I created a weather app. It defaults to Pittsburgh, but you can enter in any city or zip code you like and get the weather there. All of the animations are relative to some function of the weather such as the amount of rain, percent of cloud coverage, wind direction, and/or temperature. I learned a lot through making this project, from coming up with a plausible idea to figuring out how to get it to upload, and I’m happy with what I was able to produce.