Jamie Dorst Final Project

sketch

/*
Jamie Dorst
jdorst@andrew.cmu.edu
Final Project
Section A
*/

// global variables
// weather
var weather;
var weatherUrl;
var temp;
var currentLocation;
var condition;
var city;
var rainConditions = ["Patchy light drizzle", "Light drizzle", "Freezing drizzle",
                      "Heavy freezing drizzle", "Patchy light rain", "Light rain",
                      "Moderate rain at times", "Moderate rain",
                      "Heavy rain at times", "Heavy rain", "Light freezing rain",
                      "Moderate or heavy freezing rain", "Light sleet",
                      "Moderate or heavy sleet", "Ice pellets", "Light rain shower",
                      "Torrential rain shower", "Light sleet showers",
                      "Moderate or heavy sleet showers", "Light showers of ice pellets",
                      "Moderate or heavy showers of ice pellets"];
var cloudyConditions = ["Cloudy", "Overcast", "Mist", "Patchy rain possible",
                        "Patchy snow possible", "Patchy sleet possible",
                        "Patchy freezing drizzle possible", "Thundery outbreaks possible",
                        "Fog", "Freezing fog"];
var snowyConditions = ["Blowing snow", "Blizzard", "Patchy light snow", "Light snow",
                       "Patchy moderate snow", "Moderate snow", "Patchy heavy snow", "Heavy snow"];
// custom variables
var button;
var cityInput;
var myFont;
// rain
var rainArray = [];
var rainAmount;
var rainSpeed;
var visibleR = false;
// snow
var snowflakeImg;
var snowArray = [];
var snowAmount;
var snowSpeed;
var visibleS = false;
// clouds
var cloudCover;
var cloudArray = [];
var cloudAmount;
var wind;
var rightWind = ["S", "SE", "E", "NE", "NNE", "ENE", "ESE", "SSE"];
var leftWind = ["N", "NW", "W", "SW", "SSW", "WSW", "WNW", "NNW"];


// preload weather API and snowflake image
function preload() {
    weatherUrl = 'https://api.apixu.com/v1/current.json?key=8f4b2cd0980d46aba2e201006182511&q=Pittsburgh';
    loadJSON(weatherUrl, getWeather);
    snowflakeImg = loadImage('https://i.imgur.com/VADyEQ9.png');
}

function setup() {
    createCanvas(480, 480);
    // case insensitive
    var lowCon = condition.toLowerCase();
    // make rain/snow relative to how heavy it is
    if (lowCon.indexOf('light') > -1) {
        rainAmount = 10;
        rainSpeed = 2;
        snowAmount = 10;
        snowSpeed = 1;
    } else if (lowCon.indexOf('moderate') > -1) {
        rainAmount = 15;
        rainSpeed = 3;
        snowAmount = 15;
        snowSpeed = 2;
    } else if (lowCon.indexOf('heavy') > -1) {
        rainAmount = 20;
        rainSpeed = 4;
        snowAmount = 20;
        snowSpeed = 3;
    } else {
        rainAmount = 30;
        rainSpeed = 5;
        snowAmount = 30;
        snowSpeed = 4;
    }
    // make amount of clouds relative to cloud cover
    cloudAmount = map(cloudCover, 0, 100, 0, 30);
    // prepare for rain/snow/clouds by filling array
    for (var i = 0; i < rainAmount; i++) {
        rainArray[i] = makeRain(random(170, 313), random(0, 315));
    }
    for (var i = 0; i < snowAmount; i++) {
        snowArray[i] = makeSnow(random(175, 305), random(0, 315));
    }
    for (var i = 0; i < cloudAmount; i++) {
        cloudArray[i] = makeCloud(random(-75, width + 75), random(320, height),
                                  random(100, 170), 175);
    }
    // let user name a city with input and button
    cityInput = createInput();
    cityInput.position(width - cityInput.width - 40, 20);
    button = createButton('GO');
    button.position(cityInput.x + cityInput.width + 5, 20);
    button.mouseClicked(changeCity);
}

// function to allow enter key to also submit input
async function keyPressed() {
    if (keyCode === ENTER) {
        changeCity();
    }
}

// function to change the weather to the user-inputted city
function changeCity() {
    // give variable a default
    city = 'Pittsburgh'
    // change city to inputted city
    city = cityInput.value();
    cityInput.value('');
    // reload weather data
    weatherUrl = 'https://api.apixu.com/v1/current.json?key=8f4b2cd0980d46aba2e201006182511&q=' + city;
    loadJSON(weatherUrl, getWeather);
}

async function cloudUpdate() {
    // make amount of clouds relative to cloud cover
        cloudAmount = map(cloudCover, 0, 100, 0, 30);
        // refill arrays so animations change
        for (var i = 0; i < rainAmount; i++) {
            rainArray[i] = makeRain(random(170, 313), random(0, 315));
        }
        for (var i = 0; i < snowAmount; i++) {
            snowArray[i] = makeSnow(random(175, 305), random(0, 315));
        }
        for (var i = 0; i < cloudAmount; i++) {
            cloudArray[i] = makeCloud(random(-75, width + 75), random(320, height),
                                      random(100, 170), 175);
        }
}

// get weather data
function getWeather(weather) {
    temp = Number(weather.current.temp_f);
    condition = weather.current.condition.text;
    currentLocation = weather.location.name;
    cloudCover = weather.current.cloud;
    wind = weather.current.wind_mph;
    windDir = weather.current.wind_dir;
    cloudUpdate();
}

async function draw() {
        // background is light during day, dark during night
        if (hour() > 8 & hour() < 18) {
            background("#0077CC");
        } else {
            background("#00487C");        
        }
        // font and size
        noStroke();
        textFont("Sans-serif");
        textAlign(CENTER);
        fill("EBF2FA");
        textSize(30);
        text(currentLocation, width / 2, 88);
        textSize(100);
        text(temp + "°", width / 2, 220);
        textSize(18);
        text(condition, width / 2, 120);
        textSize(12);
        text("Enter a city name or zip code to change location", 145, 28);
        // draw based on weather conditions
        if (condition === "Sunny") {
            sunny();
        } else if (condition === "Clear") {
            clearSky();
        } else if (condition === "Partly cloudy") {
            sunny();
            cloudy();
        } else if (rainConditions.some(weatherTest) == true) {
            rainy();
        } else if (cloudyConditions.some(weatherTest) == true) {
            cloudy();
        } else if (snowyConditions.some(weatherTest) == true) {
            snowy();
        } else if (condition === ("Patchy light rain with thunder") ||
                                 ("Moderate or heavy rain with thunder")) {
            rainy();
            thunder();
        } else if (condition === ("Patchy light snow with thunder") ||
                                 ("Moderate or heavy snow with thunder")) {
            snowy();
            thunder();
        }
}

// test weather conditions
function weatherTest(value) {
    return value == condition;
}
function directionTest(value) {
    return value == windDir;
}


//======================SUNNY=========================
function sunny() {
    // color of sun mapped to how hot it is
    // redder when hotter, yellower when cooler
    var sunColorG = map(temp, 0, 110, 230, 155);
    noStroke();
    fill(255, sunColorG, 0);
    // draw sun
    ellipse(width / 2, 350, 100, 100);
    // draw sun rays
    push();
    angleMode(DEGREES);
    translate(width / 2, 350);
    for (var i = 0; i < 10; i++) {
        fill ("orange");
        triangle(0, -80, -10, -60, 10, -60);
        rotate(36);
    }
    pop();
}

//======================CLEAR=========================
// function to draw moon
function clearSky() {
    noStroke();
    fill("#EBF2FA");
    ellipse(width / 2, 350, 150, 150);
    fill("#E3E9F2");
    ellipse(270, 330, 20, 20);
    ellipse(220, 360, 60, 60);
    ellipse(200, 300, 10, 10);
    ellipse(277, 400, 25, 25);
    ellipse(250, 291, 30, 30);
}


//=====================CLOUDY=========================
// function to make rain drop objects
function makeCloud(x, y, cloudColor) {
    var cloudObj = {
        x: x,
        y: y,
        cc: cloudColor,
        move: cloudMove,
        render: renderCloud
    };
    return cloudObj;
}

// function to draw clouds
function renderCloud() {
    noStroke();
    fill(this.cc);
    ellipse(this.x, this.y, 75, 75);
    ellipse(this.x + 60, this.y - 17, 100, 100);
    ellipse(this.x + 110, this.y + 5, 50, 50);
}

// function to make clouds move
// based on wind speed and direction
function cloudMove() {
    if (leftWind.some(directionTest) == true) {
        if (this.x > -160) {
            this.x -= map(wind, 0, 50, 0, 10);
        } else if (this.x <= -37.5) {
            this.x = width + 160;
        }
    } if (rightWind.some(directionTest) == true) {
        if (this.x < width + 37.5) {
            this.x += map(wind, 0, 50, 0, 10);
        } else if (this.x >= width + 37.5) {
            this.x = -160;
        }
    }
}

// weather condition function
function cloudy() {
    for (var i = 0; i < cloudAmount; i++) {
        cloudArray[i].render();
        cloudArray[i].move();
    }
}


//======================THUNDER=======================
// function to draw thunder
function thunder() {
    stroke("yellow");
    noFill();
    angleMode(DEGREES);
    arc(300, 320, 60, 60, 280, 0);
    arc(300, 320, 70, 70, 280, 0);
    arc(190, 315, 85, 85, 180, 285);
    arc(190, 315, 95, 95, 180, 285);
}


//======================RAIN==========================
// function to make rain drop objects
function makeRain(x, y) {
    var raindrop = {
        x: x,
        y: y,
        fall: rainFall,
        render: renderRain,
        visibleR: visibleR
    };
    return raindrop;
}

// function to draw rain
function renderRain() {
    noStroke();
    // only display raindrops when they are below the cloud
    if (this.visibleR == false) {
        ellipse(this.x, this.y, 0, 0);
    } else {
        ellipse(this.x, this.y, 7, 13);
    }
}

// function to make rain fall
function rainFall() {
    if (this.y < height) {
        this.y += rainSpeed
    } else if (this.y >= height) {
        this.y = random(300, 315);
    }
    if (this.y < 315) {
        this.visibleR = false;
    } else {
        this.visibleR = true;
    }
}

// weather condition function
function rainy() {
    // case insensitive
    var lowCon = condition.toLowerCase();
    // make rain relative to how heavy it is
    if (lowCon.indexOf('light') > -1) {
        rainAmount = 10;
        rainSpeed = 2;
    } else if (lowCon.indexOf('moderate') > -1) {
        rainAmount = 15;
        rainSpeed = 3;
    } else if (lowCon.indexOf('heavy') > -1) {
        rainAmount = 20;
        rainSpeed = 4;
    } else {
        rainAmount = 30;
        rainSpeed = 5;
    }
    // color of rain dependent upon temperature
    fill(0, map(temp, 32, 100, 255, 0), 255);
    for (var i = 0; i < rainAmount; i++) {
        rainArray[i].render();
        rainArray[i].fall();
    }
    var rainCloud = makeCloud(190, 315, 100);
    rainCloud.render();
}

//=======================SNOW=========================
// function to make snowflake objects
function makeSnow(x, y) {
    var snowflake = {
        x: x,
        y: y,
        fall: snowFall,
        render: renderSnow,
        visibleS: visibleS
    };
    return snowflake;
}

// function to draw snow
function renderSnow() {
    if (this.visibleS == false) {
        image(snowflakeImg, -5, -5, 1, 1);
    } else {
        image(snowflakeImg, this.x, this.y, 15, 15);
    }
}

// function to make snow fall
function snowFall() {
    if (this.y < height) {
        this.y += snowSpeed;
    } else if (this.y >= height) {
        this.y = 315;
    }
    if (this.y < 315) {
        this.visibleS = false;
    } else {
        this.visibleS = true;
    }
}

// weather condition function
function snowy() {
        // case insensitive
    var lowCon = condition.toLowerCase();
    // make snow relative to how heavy it is
    if (lowCon.indexOf('light') > -1) {
        snowAmount = 10;
        snowSpeed = 1;
    } else if (lowCon.indexOf('moderate') > -1) {
        snowAmount = 15;
        snowSpeed = 2;
    } else if (lowCon.indexOf('heavy') > -1) {
        snowAmount = 20;
        snowSpeed = 3;
    } else {
        snowAmount = 30;
        snowSpeed = 4;
    }
    fill(255);
    for (var i = 0; i < snowAmount; i++) {
        snowArray[i].render();
        snowArray[i].fall();
    }
    var snowCloud = makeCloud(190, 315, 100);
    snowCloud.render();
}

For my final project, I created a weather app. It defaults to Pittsburgh, but you can enter in any city or zip code you like and get the weather there. All of the animations are relative to some function of the weather such as the amount of rain, percent of cloud coverage, wind direction, and/or temperature. I learned a lot through making this project, from coming up with a plausible idea to figuring out how to get it to upload, and I’m happy with what I was able to produce.

Jamie Dorst Looking Outward 12

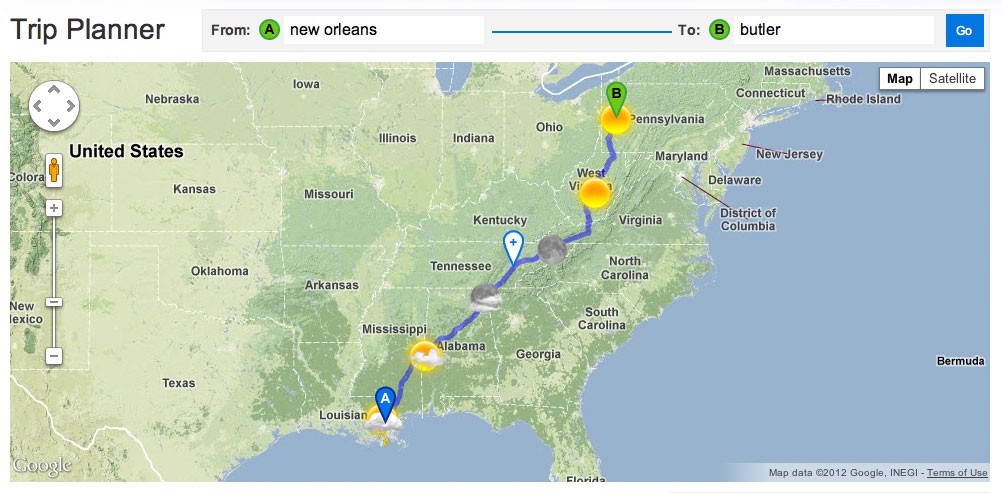
For this week’s looking outward post, I found two different projects that have inspired my final project. The first one is a travel planner by Stamen Design that helps you plan a road trip, but also tells you what the weather is like along the way so you can plan better. After making your plan, you can drag around the stops on your trip and see how the weather changes if you take a different route. I think this is a good way to interact with weather and make the basic numbers more understandable and approachable.

An image of the trip showing the weather along the way
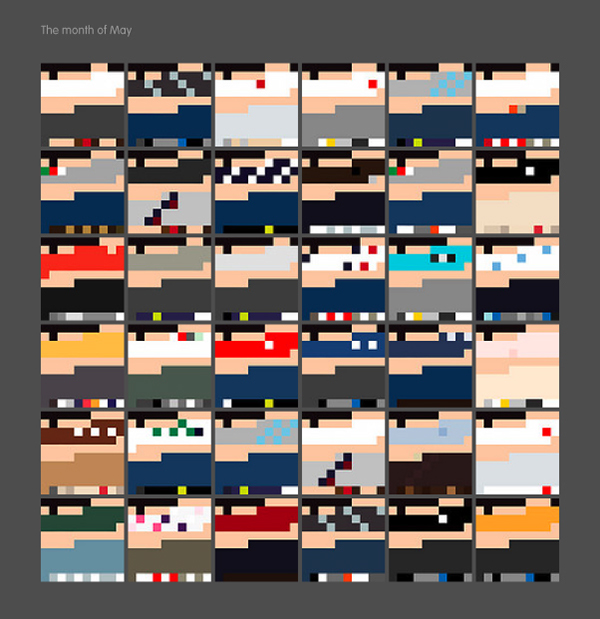
The other project I found was My Daily Color Palette by Jacobo Zanella. He made an image every day for the entirety of 2010 showing the color palette of his clothes and how much skin was showing. I thought this was a really cool project that would let you see patterns in what you wear, and see as the year goes by how that changes.
These are all of his color palettes for the month of May in 2010

Jamie Dorst Project Proposal

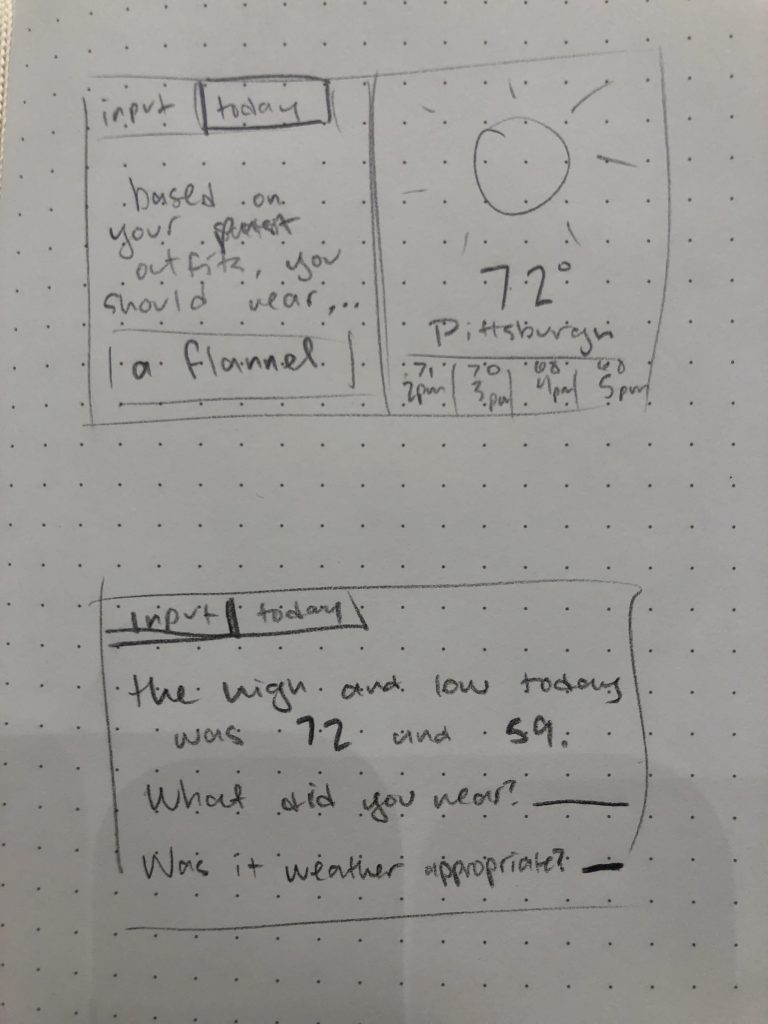
For this project, I had the idea to create some sort of weather app, but in addition to telling the forecast, it will suggest what to wear based on inputs you’ve given in the past. I’m not totally sure if this project will work, because it seems pretty complicated, involving some sort of basic machine learning and a weather API, but I’m interested to see if I could get it working on some basic level. I know this is something I’d love to have, and even though my final product may not be perfect, I think it’ll teach me a lot. The basic things I’ll need are a way for the user to input data, including what they wore and if it was good, a way to store, retrieve, and display that data later, and a forecast display.

A simple image of what I imagine my project looking like.

Jamie Dorst Project 11

sketch

/*
Jamie Dorst
jdorst@andrew.cmu.edu
Section A
Project-11
*/

var turtlesArray = [];
var mouseClicks = [];

function setup() {
    createCanvas(460, 480);
    background(0);
}

function draw() {
    // change frame rate slower
    frameRate(5);
    // make turtle in center of screen
    var turtle1 = makeTurtle(width / 2, height / 2);
    turtle1.setColor(255);
    turtle1.goto(random(0, 460), random(0, 460));
    // make another same turtle in center of screen
    var turtle2 = makeTurtle(width / 2, height / 2);
    turtle2.setColor(255);
    turtle2.goto(random(0, 460), random(0, 460));
    // make another same turtle in center of screen
    var turtle3 = makeTurtle(width / 2, height / 2);
    turtle3.setColor(255);
    turtle3.goto(random(0, 460), random(0, 460));
    // draw new turtles on a loop too
    for (var i = 0; i < turtlesArray.length; i++) {
        turtlesArray[i].goto(random(0, 460), random(0, 460));
    }
    // stop updating turtles past 10 clicks by removing them from the array
    if (turtlesArray.length > 10) {
        turtlesArray.shift();
    }
    // put translucent black screen over canvas every 10 clicks
    // not when there have been 0 clicks
    if (mouseClicks.length === 0 & mouseClicks.length < 10) {
        textAlign(CENTER);
        noStroke();
        fill(0);
        rect(0, 460, 460, 480);
        fill(255);
        text("keep clicking to start fading", width / 2, 470);
    } else if (mouseClicks.length % 10 === 0) {
        // translucent box over canvas
        fill(0, 0, 0, 30);
        noStroke();
        rect(0, 0, 460, 460);
        // instructions text
        noStroke();
        fill(0);
        rect(0, 460, 460, 480);
        fill(255);
        text("click to stop fading", width / 2, 470);
    } else if (mouseClicks.length === 11) {
        // clear array so it never exceeds 10 items
        for (var j = 0; j < 11; j++) {
            mouseClicks.shift();
        }
    }
    print(mouseClicks.length)
}

function mousePressed() {
    // new turtle when mouse is pressed at location mouse was pressed
    var newTurtle = makeTurtle(mouseX, mouseY);
    // color and weight are random
    newTurtle.setColor(color(random(255), random(255), random(255)));
    newTurtle.setWeight(random(1, 5));
    // push the new turtle onto the turtles array
    turtlesArray.push(newTurtle);
    // count how many clicks there have been total
    mouseClicks.push("click")
}


//-----------TURTLE-----------//
function turtleLeft(d) {
    this.angle -= d;
}


function turtleRight(d) {
    this.angle += d;
}


function turtleForward(p) {
    var rad = radians(this.angle);
    var newx = this.x + cos(rad) * p;
    var newy = this.y + sin(rad) * p;
    this.goto(newx, newy);
}


function turtleBack(p) {
    this.forward(-p);
}


function turtlePenDown() {
    this.penIsDown = true;
}


function turtlePenUp() {
    this.penIsDown = false;
}


function turtleGoTo(x, y) {
    if (this.penIsDown) {
      stroke(this.color);
      strokeWeight(this.weight);
      line(this.x, this.y, x, y);
    }
    this.x = x;
    this.y = y;
}


function turtleDistTo(x, y) {
    return sqrt(sq(this.x - x) + sq(this.y - y));
}


function turtleAngleTo(x, y) {
    var absAngle = degrees(atan2(y - this.y, x - this.x));
    var angle = ((absAngle - this.angle) + 360) % 360.0;
    return angle;
}


function turtleTurnToward(x, y, d) {
    var angle = this.angleTo(x, y);
    if (angle < 180) {
        this.angle += d;
    } else {
        this.angle -= d;
    }
}


function turtleSetColor(c) {
    this.color = c;
}


function turtleSetWeight(w) {
    this.weight = w;
}


function turtleFace(angle) {
    this.angle = angle;
}


function makeTurtle(tx, ty) {
    var turtle = {x: tx, y: ty,
                  angle: 0.0, 
                  penIsDown: true,
                  color: color(128),
                  weight: 1,
                  left: turtleLeft, right: turtleRight,
                  forward: turtleForward, back: turtleBack,
                  penDown: turtlePenDown, penUp: turtlePenUp,
                  goto: turtleGoTo, angleto: turtleAngleTo,
                  turnToward: turtleTurnToward,
                  distanceTo: turtleDistTo, angleTo: turtleAngleTo,
                  setColor: turtleSetColor, setWeight: turtleSetWeight,
                  face: turtleFace};
    return turtle;
}

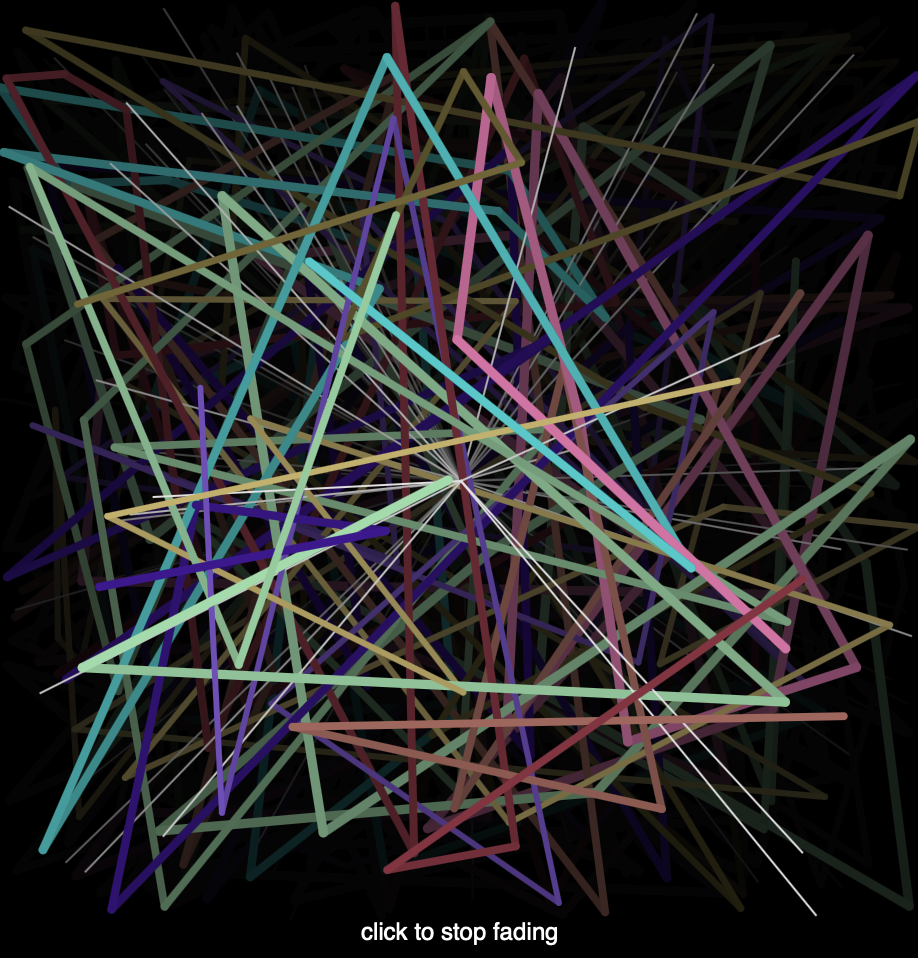
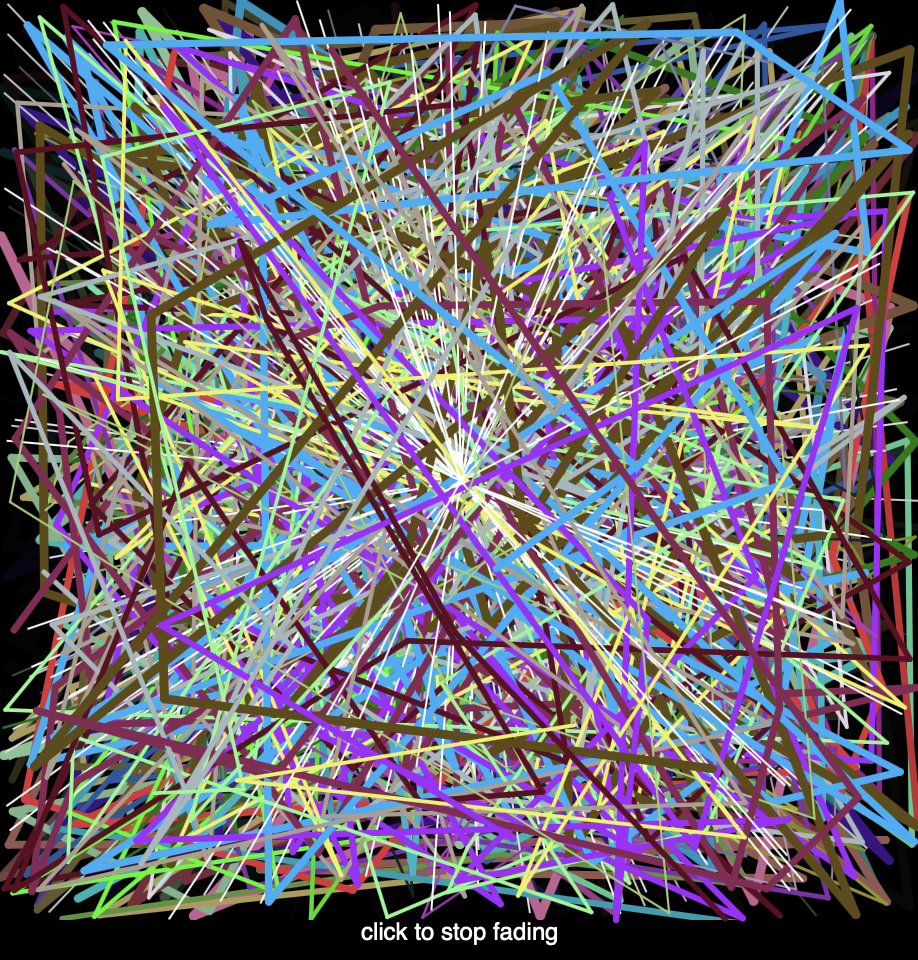
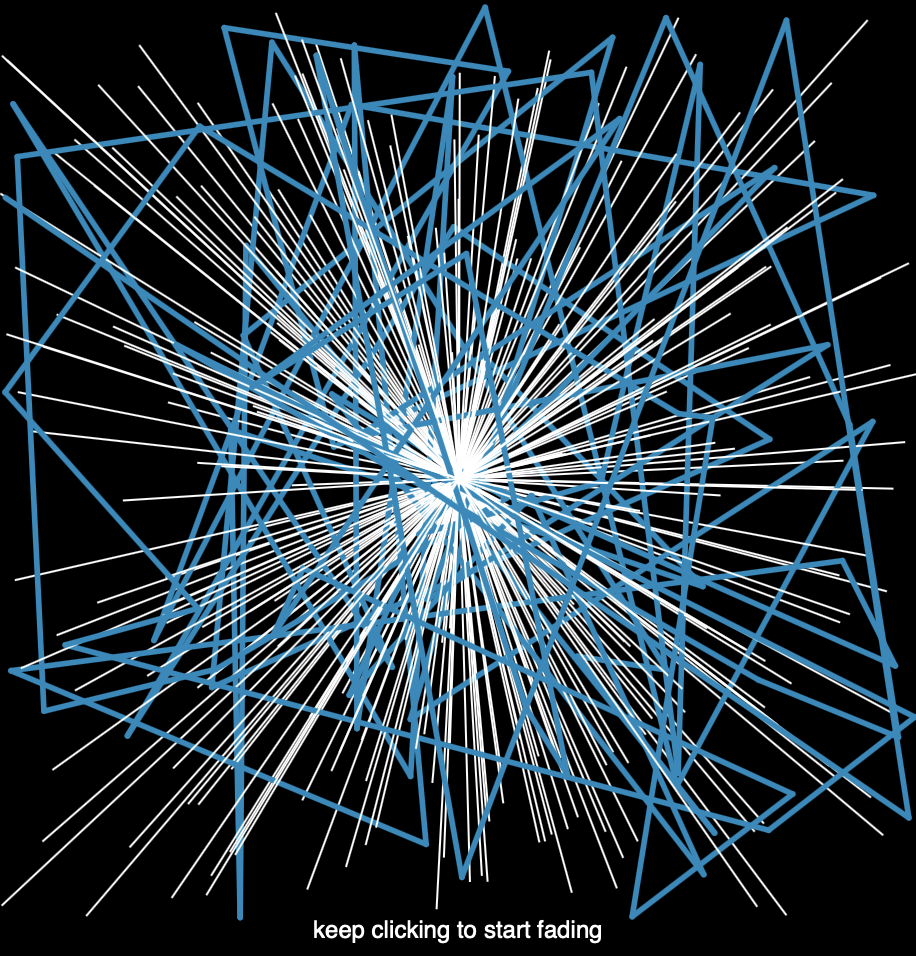
For this project, I started with the base white star type thing, where the turtle starts at the center of the canvas but then always spreads out a random amount.  I then wanted to let the user click to add more turtles, where they would have a new random stroke and color, and they would move around randomly within the canvas. Every 10 clicks, a faded black screen is added over the canvas. I implemented this because I felt that the lines became overwhelming at a certain point, and this would help tame them.

A screenshot of my project while the fading is going on
A screenshot of my project when the fading is not going on, and it has run for a while
A screenshot of my project when you’ve only clicked once, and it hasn’t run for too long

Jamie Dorst Looking Outward 11

For this week’s looking outward, I am writing about a project done by Pierry Jacquillard, Prélude in ACGT – Sonification of personal (DNA) data, where he converted his own DNA into a musical piece. He wanted to see how nature’s core structure (DNA) could collide with the artificial and man-made (Code). He created five interfaces to help achieve this project. Two of them drive the remote, which allows you to change parameters like Tempo, the musical arrangement or even the type of conversion and the chromosomes’ library where you can choose which one to play and where inside it. The three other are used to visualize the sound, the type of algorithm and his raw DNA – all in search for understanding the process.

Some images of the setup of his project

This project was really interesting to me because it’s something I probably never would have thought about, but it is actually a really creative idea as a way to compare natural and synthetic things. I’m also very surprised at how the music doesn’t sound too eclectic or random–it sounds very well like a contemporary piece that could have been made without the DNA.

Jamie Dorst Project 10

sketch

/*
Jamie Dorst
jdorst@andrew.cmu.edu
Section A
Project-10
*/

var trees = [];
// noise variables
var terrainSpeed1 = 0.0005;
var terrainDetail1 = 0.002;
var terrainSpeed2 = 0.0003;
var terrainDetail2 = 0.004;
var terrainSpeed3 = 0.0001;
var terrainDetail3 = 0.006;

function setup() {
    createCanvas(480, 480);
    // create an initial collection of trees
    for (var i = 0; i < 7; i++){
        var rx = random(width);
        trees[i] = makeTree(rx);
    }
    frameRate(10);
}

function draw() {
    background('#E0F7FA');
    // draw sun
    fill('gold');
    noStroke();
    ellipse(100, 100, 100, 100);
    // draw clouds
    fill(255);
    ellipse(340, 80, 50, 50);
    ellipse(360, 90, 60, 60);
    ellipse(380, 70, 75, 75);
    ellipse(400, 80, 50, 50);

    ellipse(220, 200, 50, 50);
    ellipse(250, 210, 60, 60);
    ellipse(260, 190, 75, 75);
    ellipse(280, 200, 50, 50);

    drawHills();
    updateAndDisplayTrees();
    removeTreesThatHaveSlippedOutOfView();
    addNewTreesWithSomeRandomProbability(); 
}

function drawHills() {
    // blue hills
    beginShape(); 
    stroke('#3949AB');
    for (var q = 0; q < width; q++) {
        var t = (q * terrainDetail3) + (millis() * terrainSpeed3);
        var y = map(noise(t), 0,1, 25, height)
        line(q, y, q, height); 
    }
    endShape();
    // pink hills
    beginShape(); 
    stroke('#E91E63');
    for (var a = 0; a < width; a++) {
        var t = (a * terrainDetail2) + (millis() * terrainSpeed2);
        var y = map(noise(t), 0,1, height / 2, height)
        line(a, y, a, height); 
    }
    endShape();

    // yellow hills
    beginShape(); 
    stroke('#FFEB3B');
    for (var x = 0; x < width; x++) {
        var t = (x * terrainDetail1) + (millis() * terrainSpeed1);
        var y = map(noise(t), 0,1, 2 * height / 3, height)
        line(x, y, x, height); 
    }
    endShape();
}

function updateAndDisplayTrees() {
    // update the trees' positions and display them
    for (var i = 0; i < trees.length; i++){
        trees[i].move();
        trees[i].display();
    }
}

function removeTreesThatHaveSlippedOutOfView() {
    // if a tree has dropped off the left edge remove it from the array
    // copy all the trees we want to keep into a new array
    var treesToKeep = [];
    for (var i = 0; i < trees.length; i++){
        if (trees[i].x + trees[i].breadth > 0) {
            treesToKeep.push(trees[i]);
        }
    }
    trees = treesToKeep;
}

function addNewTreesWithSomeRandomProbability() {
    // add a new tree to the end, 20% chance
    var newTreeLikelihood = 0.2; 
    if (random(0,1) < newTreeLikelihood) {
        trees.push(makeTree(width));
    }
}

// draw the tree
function treeDisplay() {
    if (this.colors < 0.5) {
        var fillColor = 255;
        var strokeColor = 0;
    } else {
        fillColor = 0;
        strokeColor = 255;
    }
    fill(fillColor);
    noStroke();
    ellipseMode(CENTER);
    ellipse(this.x, height - this.trunkHeight, this.treeSize, this.treeSize);
    stroke(strokeColor);
    strokeWeight(3);
    line(this.x, height - this.trunkHeight - 5, this.x, height);
    line(this.x, height - this.trunkHeight + 5, this.x - 7, height - this.trunkHeight - 2);
    line(this.x, height - this.trunkHeight + 10, this.x + 7, height - this.trunkHeight + 3);
}

function makeTree(birthLocationX) {
    var tree = {
        trunkHeight: random(40, 80),
        treeSize: random(30, 50),
        colors: random(0, 1),
        x: birthLocationX,
        sizes: 50,
        breadth: 50,
        speed: -20.0,
        move: treeMove,
        display: treeDisplay
    }
    return tree;
}

// method to update position of building every frame
function treeMove() {
    this.x += this.speed;
}

For this project, I just wanted to make a fun landscape and then have a lot of contrasting colors, which is why I made the trees randomize to be black with white or white with black. I had a lot of trouble at the beginning figuring out how to get the trees to stay on the page, and then later, move. I also struggled with getting the hills to be different heights, but when I figured it out it was a pretty simple change. I think that overall though I ended up learning a lot more about objects, and I’m happy with how it turned out.

Jamie Dorst Looking Outward 10

For this week’s Looking Outward post I’ve chosen to write about Kate Hollenbach, an artist, programmer, and educator based in Chicago and Los Angeles. The project that really interested me by her is called phonelovesyoutoo. The project was done over one month, where she recorded her own cell phone front camera every time she used her phone. In her database, she put together all the videos arranged like a calendar, and played each tile proportional to the time of day it was recorded.

A video showing phonelovesyoutoo.

I was intrigued by this project because I think our phone usage is something that we hardly notice albeit it being one of the things we do most. I thought it was interesting to note the similarities and differences between clips in the project–a lot of her facial expressions are very similar, while the scenery around her changes. I think that has implications as to how we are spending our time–when we are on our phones, we have no emotion despite the changing world around us.


Jamie Dorst Project 09 Portrait

sketch

/*
Jamie Dorst
jdorst@andrew.cmu.edu
Project 09
Section A
*/

var underlyingImage;

function preload() {
    var myImageURL = "https://i.imgur.com/Dd4CnQI.jpg";
    underlyingImage = loadImage(myImageURL);
}

function setup() {
    createCanvas(360, 480);
    background(0);
    underlyingImage.loadPixels();
    frameRate(30);
}

function draw() {
    // variables
    // first line coordinates
    var x1 = random(width);
    var y1 = random(height);
    // make line stroke bigger further from the face (slightly above center)
    var distBtwn = dist(width / 2, (height / 2) - 100, x1, y1);
    var sw = map(distBtwn, 0, 350, 2, 10);
    // picture colors
    var ix = constrain(floor(x1), 0, width-1);
    var iy = constrain(floor(y1), 0, height-1);
    var theColorAtLocationXY = underlyingImage.get(ix, iy);
    // second line coordinates
    // make lines shorter closer to the center
    var xy = map(distBtwn, 0, 350, 5, 30);
    var x2 = x1 + xy * random(-2, 2);
    var y2 = y1 + xy * random(-2, 2);
    // randomize stroke caps
    var num = random(2);
    var sCap;

    // assign stroke values
    if (floor(num) === 0) {
        sCap = SQUARE;
    } else if (floor(num) === 1) {
        sCap = ROUND;
    }
    strokeCap(sCap);
    strokeWeight(sw);
    stroke(theColorAtLocationXY);
    // draw lines
    line(x1, y1, x2, y2);
}


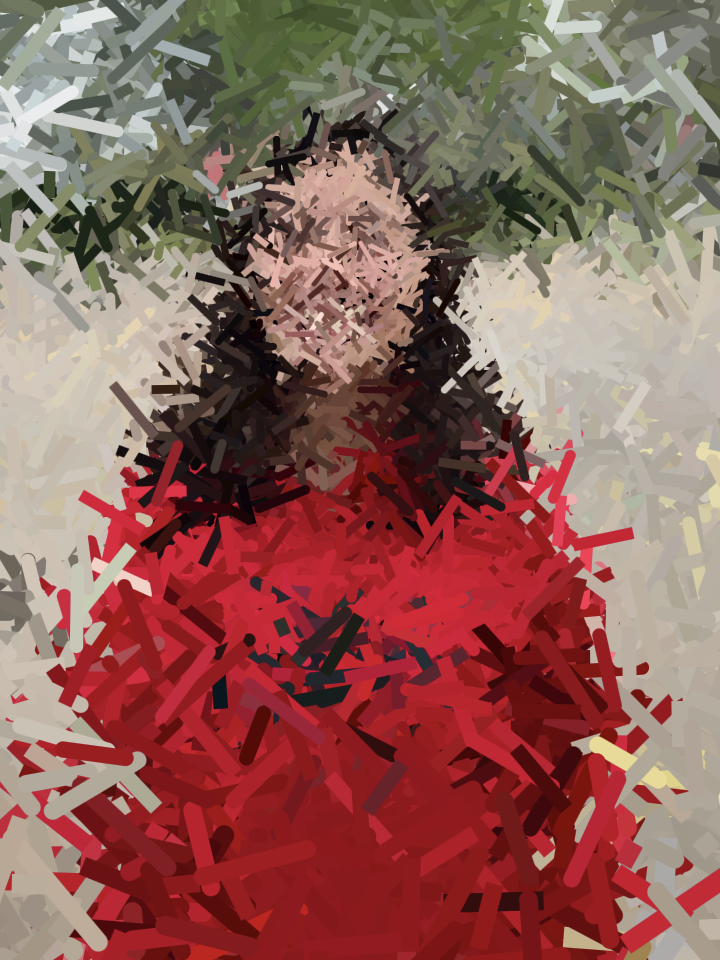
For this project, I was inspired by the idea of a painting. I decided to make it draw using lines, and I had it randomly select a stroke cap to emulate even more a random brush stroke. I also made it so that closer to the face, the strokes are shorter and thinner, so that more detail can be achieved. Toward the outside of the canvas, the strokes get longer and thicker. Overall I thought this project was pretty fun to do and try out with different photographs.

A screenshot of the (possible) finished product

Jamie Dorst Looking Outward 09

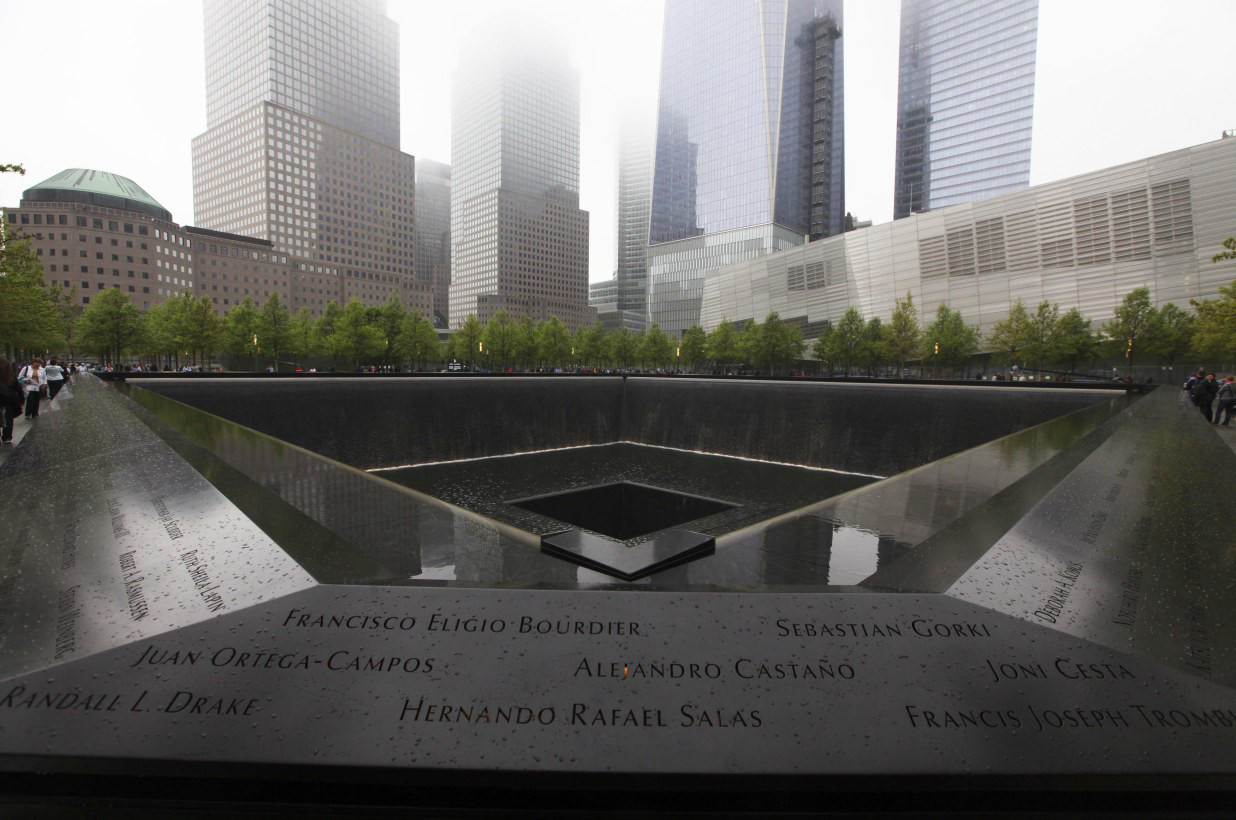
As I was browsing past Looking Outward posts, this one by Liz Maday about the 9/11 memorial caught my eye. I had no idea that the names on the memorial were organized in such a thoughtful and calculated way. The project was done by Jer Thorp, and he created an algorithm that would cluster names based on adjacency and relationships.

The 9/11 Memorial
A visualization of the clustering algorithm


Liz mentioned that she thought “this is an amazing example of how a program is able to reflect very human emotions and intentions while also utilizing a precision and complexity that is above human ability,” and I completely agree. I think it’s amazing that we are able to use technology to determine such personal connections, and create something so meaningful. Before seeing this project, I never imagined that something like this was possible–I never thought relationships between humans could be computed in any way.

Jamie Dorst Looking Outward 08

This week I watched the Eyeo talk from Moritz Stefaner. Stefaner is a German data visualization specialist. He studied Cognitive Science at the University of Osnabrueck) and Interface Design at the University of Applied Sciences Potsdam. He describes himself as a “truth and beauty operator,” as a reference to his skills balancing aesthetics and analytics.

Moritz Stefaner’s talk at the Eyeo Festival 2011

I wasn’t expecting his talk to be as interesting as it was. He used a lot of humor and was casual with his audience, which I liked. I think it made it a lot easier to pay attention, and made it feel more interactive even though it was just him talking the whole time. Even though there were times when he stumbled, he continued to go with the flow and not let that slow him down, which I think is a really effective presentation strategy–especially since it’s rare that you give a flawless presentation.

He has a lot of projects involving visualization of large-scale human activity. One of my favorites of his is called Multiplicity. This project looked at social media, and how pictures posted represent the place they were posted at. He looked for similar pictures–if it’s possible for two people to take the same picture–similar outfits, similar actions, etc. I thought it was interesting that you could see what most people present the place as, what it is to them, and how that compares to how you see it normally.

A video demonstrating how Multiplicity works