JasonZhu-LookingOutwards-07


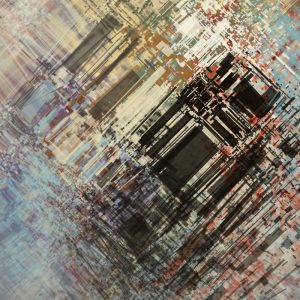
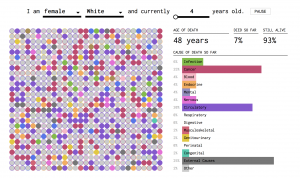
This is a screenshot of the data visualization chart for the many ways to die by Nathan Yau, It is titled How You Will Die and is published on FlowingData.com.

https://flowingdata.com/2016/01/19/how-you-will-die/
Created by Nathan Yau; Date Unknown.

I have long admired this project for several reasons. First and foremost it allows for the right amount of customization. Often times, data visualizations will overdo the interactivity component or not include it at all. This project is in the goldilocks zone of interactivity and customizability. I also very much admire how the information is presented. It takes a simple approach (using circles) to convey a complex amount of statistical data. Fascinating to say the least. I think this plays nicely into how Nathan Yau uses a very computational method visualization in his work. In many ways his artistic sensibilities are nested within the final product. As for the algorithms used, it seems to be various algorithms that pull from a statistical database.

JasonZhu-Project-07-Curves

I liked this project a lot because it began to delve into more abstract realms. While the execution was difficult, I had a lot of fun in the process exploring various types of graphing functions and applications. In trying to determine how to build my proposed idea, I was able to rekindle a long held interest in computational art as well as explore the mathematical side of computing. I believe this project has a host of potential applications that will bode well for me in future projects and courses.

sketch

/* Jason Zhu
jlzhu@andrew.cmu.edu
Section E
Project 07-Curves
*/

function setup() {
    createCanvas(480, 480);
}

function draw() {
	// define constrain variables
	var cx = constrain(mouseX, 0, 480);
	var cy = constrain(mouseY, 0, 480);
	// define color variables
  	var red = cx * .3
  	var green = cy * .3
  	var blue = 100
  	// define additional variables and draw shapes
	background(red * .3 - 15, green * .3 - 15, blue * .3 - 15);
	drawhypotrochoid();
	drawhypotrochoid2();
	drawflowerellipse();
	drawflowerellipse2();
	frameRate(999);
}

function drawhypotrochoid() {
	push();
	translate(width / 2, height / 2);
	noFill();
	// define constraint function
    var cy = constrain(mouseY, 0, 480);
	var cx = constrain(mouseX, 0, 480);
	// define draw variables
	var r1 = 360;
    var a1;
    var b1;
	// define color variables
  	var red = cx * .25
  	var green = cy * .25
  	var blue = 100
  	// define stroke
    strokeWeight(10);
	stroke(red, green, blue);
  	// define shape parameters
    // define alternation parameters
    var a1 = map(cx, 0, width, 0, 25);
    var b1 = map(cy, 0, height, 0, 1);
    // define shape parameters
    beginShape();
    rotate(radians(angle));
		for(var t = 0; t < 360; t += 2) {
			var angle = map(t, 0, 360, 0, 360);
        // equation
			var x = (a1 - b1) * cos(angle) + r1 * cos((a1 - b1) * angle);
			var y = (a1 - b1) * sin(angle) - r1 * sin((a1 - b1) * angle);
			curveVertex(x, y);
			}
		endShape();
    pop();
}
function drawflowerellipse(){
	translate(width / 2, height / 2);
	noFill();
  	// define constrain variables
	var cx = constrain(mouseX, 0, 480);
	var cy = constrain(mouseY, 0, 480);
	// define draw variables
  	var angle = map(cx, 0, width, 0, 360);
  	var a2 = 100 + (.2 * cx);
  	var b2 = 100 + (.2 * cx);
  	// define color variables
  	var red = cx * .6
  	var green = cy * .6
  	var blue = 100
  	// define stroke
    strokeWeight(1);
	stroke(red, green, blue);
  	// define shape parameters
  	beginShape();
	rotate(radians(angle));
  	for (var t = 0; t < 160; t +=2.8){
	    var x = a2 * (cos(t));
	    var y = b2 * (sin(t));
	    curveVertex(x,y);
		}
	endShape();
}

function drawflowerellipse2(){
	noFill();
  	// define constrain variables
	var cx = constrain(mouseX, 0, 480);
	var cy = constrain(mouseY, 0, 480);
	// define draw variables
  	var angle = map(cx, 0, width, 0, 360);
  	var a2 = 30 + (.2 * cx);
  	var b2 = 30 + (.2 * cx);
  	// define color variables
  	var red = cx * .6
  	var green = cy * .6
  	var blue = 100
  	// define stroke
    strokeWeight(1);
	stroke(red, green, blue);
  	// define shape parameters
  	beginShape();
	rotate(radians(angle));
  	for (var t = 0; t < 160; t +=3.8){
	    var x = a2 * (cos(t));
	    var y = b2 * (sin(t));
	    curveVertex(x,y);
		}
	endShape();
}

function drawhypotrochoid2(){
	push();
	translate(width / 2, height / 2);
	noFill();
	// define constraint function
    var cy = constrain(mouseY, 0, 480);
	var cx = constrain(mouseX, 0, 480);
	// define draw variables
	var r1 = 360;
    var a1;
    var b1;
	// define color variables
  	var red = cx * .3
  	var green = cy * .3
  	var blue = 100
  	// define stroke
    strokeWeight(5);
	stroke(red * .3 - 15, green * .3 - 15, blue * .3 - 15);
  	// define shape parameters
    // define alternation parameters
    var a1 = map(cx, 0, width, 0, 25);
    var b1 = map(cy, 0, height, 0, 1);
    // define shape parameters
    beginShape();
    rotate(radians(angle));
		for(var t = 0; t < 360; t += 2) {
			var angle = map(t, 0, 360, 0, 360);
        // equation
			var x = (a1 - b1) * cos(angle) + r1 * cos((a1 - b1) * angle);
			var y = (a1 - b1) * sin(angle) - r1 * sin((a1 - b1) * angle);
			curveVertex(x, y);
			}
		endShape();
    pop();
}


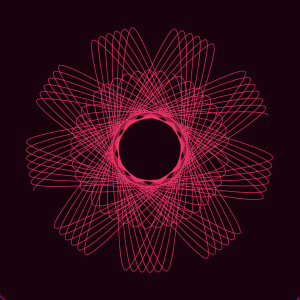
screenshot at the maximum width and minimum height of the canvas.
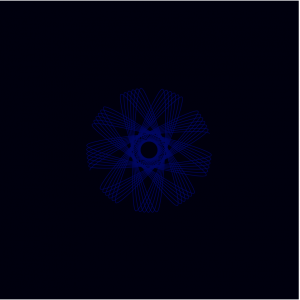

mouse X and mouse Y at the minimum width and height of the canvas.
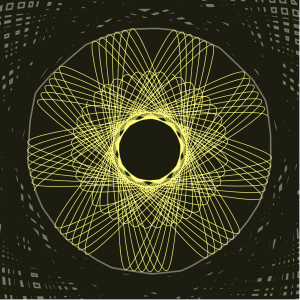

mouse X and mouse Y at the maximum width and height of the canvas.
Jason zhu-Project-06-Abstract Clock

sketch

/* Jason Zhu
jlzhu@andrew.cmu.edu
Section E
Project Abstract Clock
*/

var prevSec;
var millisRolloverTime;

function setup() {
    createCanvas(400, 355);
    background(8, 7, 17);
    millisRolloverTime = 0;
}

function draw() {
    noStroke();
    // Fetch the current time
    var H = hour();
    var M = minute();
    var S = second();
    var MS = millis();

    // predetermined function
    if (prevSec != S) {
        millisRolloverTime = millis();
    }
    prevSec = S;
    var mils = floor(millis() - millisRolloverTime);

    // display hour bar
    if (H==0){
        fill(8, 7, 17);
        rect(30,0,60,360);
    } else {
        for(i=0;i<H;i++){
            var r = (i*(255/23));
            var g = (0);
            var b = (0);
            fill(r,g,b);
            rect(30,(i*(300/23)),60,60);
        }
    }

    // display minute bar
    if (M==0){
        fill(8, 7, 17);
        rect(130,0,60,360);
    } else {
        for(i=0;i<M;i++){
            var r = (0);
            var g = (i*(255/59));
            var b = (0);
            fill(r,g,b);
            rect(130,i*(300/59),60,60);
        }
    }

    // display second bar
    if (S==0){
        fill(8, 7, 17);
        rect(230,0,60,360);
    } else {
        for(i=0;i<S;i++){
            var r = (0);
            var g = (0);
            var b = (i*(255/59));
            fill(r,g,b);
            rect(230,i*(300/59),60,60);
        }
    }

    // display milli/second bar
    if (S==1 || S ==3 || S==5 || S ==7 || S==9 || S ==11 || S==13 || S ==15 || S==17 || S ==19 || S==21 || S ==23 || S==25 || S ==27 || S==29 || S ==31 || S==33 || S ==35 || S==37 || S ==39 || S==41 || S ==43 || S==45 || S ==47 || S==49 || S ==51 || S==53 || S ==55 || S==57 || S ==59){
        fill(8, 7, 17);
        rect(330,0,60,360);
    } else {
            fill(255);
            rect(330,0,60,360);
        }
    
}

For this project I hoped to visualize clocks in a linear and color way. I wanted to represent the individual component of my clock with different R,G,B values. By using color, in addition to slight position cues, the goal was to create another more abstract method of keeping track of the time of the day. I developed the idea by trying to think of other ways that people visualized things. Naturally, color was something that was at the precipice of my mind. Overall, I think I learned a good amount about pulling various information from the world into my code. I imagine additional applications to be things such as pulling weather data or humidity data.

Jason Zhu-LookingOutwards-06


This is an image of Tyler Hobbs work, Community 5, created with various algorithms.

http://www.tylerlhobbs.com/writings/probability-distributions-for-artists. Created in 2014 by Tyler Hobbs.

Community 5 is an artwork derived from various algorithmic work. In this case, the artist, Tyler Hobbs, used pseudo-Pareto distribution to vary the length of width of polygons used in the piece. He does this quite successfully in my opinion as it neither seems overly generated or overly humanistic; achieving the right balance of algorithmic work and human effort. The Pareto distribution is a form of power law distribution and is useful in situations where one wants to create balanced objects of various sizes. Other applications of the Pareto distribution include in Hobbs words “the population of cities (many small cities, few very large cities) and the wealth of individuals (many poor indiviuals, few very rich).”

Jason Zhu Project 05

sketch

/* Jason Zhu
jlzhu@andrew.cmu.edu
Section E
Project 5
*/

// setup variables
function setup() {
    createCanvas(600, 400);
    background(10, 15, 35);
    var tw = 60/sqrt(3); //triangle width (adjusted)
    var th = 60; //triange height
    var oy = 50; //origin y of circles
    var ox = 50; //origin x of circles
    var r = 0;

    for (var y = 0; y < 6; y++) {
        //distinguishes even rows
        if (y % 2 == 0){
                //even rows: create 6 moon shapes
                for (var x = 0; x < 6; x++) {
                //position of moons x and y
                noStroke()
                fill(255);
                var py = oy + y * th;
                var px = ox + x * 103;
                ellipse(px, py, 50, 50);
                // create moon shadows and positions x and y
                push()
                fill(10, 15, 35)
                var py = oy + y * th;
                var px = ox + x * 93.5;
                ellipse(px+50, py, 50, 50);
                pop()
                }

             } else {
                //odd rows: create 5 main rectangle lines
                for (var x = 0; x < 5; x++) {
                var py = oy + y * th;
                push()
                //set random color and position variables
                var r = random(-50,50);
                var r2 = random(1, 5);
                var red = random(100, 255);
                var blue = random(100, 255);
                var green = random(100, 255);
                //offset origin x by an additional tw
                var px = ox + tw + x * 100;
                push()
                stroke(red, blue, green);
                // create 5 offset rectangle lines
                rect(px, py, 50, 1);
                rect(px +25, py +10, 45, 1)
                rect(px -25, py -10, 45, 1)
                pop()
                // create stars and set color
                fill(red, blue, green);
                ellipse(px+r, py+r, r2, r2);
                }
            }
        }
    noLoop();
}

function draw() {
    // draw is not called due to noLoop() in setup()
}

For this project I was inspired to create something that reminded me of stargazing as a child. When prompted to create something I would wear I interpreted that as to create something that I found meaningful to me and my own human experience. I wanted to create a wallpaper that conveyed a sense of time and wonder. Thus, I chose to demonstrate a very implied version of the moon cycle along with some colorful lines and stars that would tie the composition together. In terms of code, I tried to incorporate features from past classes–I added a basic random function to help create a slightly different experience upon each reload. Overall, I am fairly satisfied with the outcome and what I was able to learn from this project.

Jason Zhu Looking Outwards 05

https://www.theverge.com/2017/7/18/15988096/war-for-the-planet-of-the-apes-joe-letteri-visual-effects-interview

View post on imgur.com

Created by Visual FX team for the Planet of the Apes film series (2011-2017). When lookin at computational artwork, I thought about the trilogy for the movies series Planet of the Apes. I thought it was amazing how well a computer was able to create apelike faces from human expression. In order to create such realistic renderings, it seems that the actors are wearing specialized motion tracking devices to capture facial expressions and movements as well as a slew of cameras to capture motions from various angles. The computer is then able to stitch together this data into overlays that take into account muscle, size, and movement. I find it fascinating how computer generated graphics have evolved over the years in order to create such realism and intimacy and I think it is only a matter of time until the technique is completely perfected and indistinguishable from reality.

Jason Zhu-Project-04-String-Art

sketch

/* Jason ZHu
Section E
http://jlzhu.cmu.edu
Project-04-String-Art
*/

function setup() {
    createCanvas(400, 300);
    background(240,30,30);

    //twisted white lines
    for (var a = 0; a <300; a += 10){
        stroke(255);
        var x1 = 0 - a * 10
        var y1 = height - a * 10
        var x2 = a + 300
        var y2 = a + height/2
        line(x1,y1,x2,y2);
    }

    //blue curved lines
    for (var b = 50; b < width; b += 10) {
        strokeWeight(5);
        stroke(65,101,172);
        line(b, 0, 150, b);
    }

    // light orange rectangle
    for (var c = 250; c < 400; c += 5){
        strokeWeight(2);
        stroke(150,150,30);
        line(c,75,c,height);
    }

    //orange rays
    for (var d = 0; d < width; d += 15) {
        strokeWeight(1);
        stroke(241,157,56);
        line(250,75, d, 0);
    }

    // yellow lower left warp
    for (var e = width; e > 0; e -= 15) {
        strokeWeight(1);
        stroke(241,240,56);
        line(e,300, 0, e);
    }

     // yellow lower left warp
    for (var f = width; f > 0; f -= 15) {
        strokeWeight(1);
        stroke(241,240,56);
        line(400,f, f, 0);
    }
}

For this assignment, I wanted to push my boundaries by exploring variations in color and form. As someone who tends to be more conservative and narrowed in my thinking (aesthetically speaking), I wanted to see what I could come up with if those preconditions were tossed aside. I contrasted blues with reds and mixed in some yellows as well. I also wanted the white lines to serve to divide the campus and create a dynamic centerpiece that underlaid the red and yellow portions. In this way, I think I pushed myself further in terms of coding and aesthetics. By going against my norms, I was able to reinforce what I thought looks good while also exploring new means.

Jason Zhu – Looking Outwards 04

View post on imgur.com

Created by Robert Henke. Titled Fall. Published April 2016 at the L.E.V. Festival.

Fall, by Robert Henke, is a work that details an abstract view of 1950 Bavaria which disappeared underwater following the construction of a newly built Sylvenstein reservoir. The technology employs a randomizing algorithm to generate patterns. I think it’s really cool because it is not only conceptually strong, but also because it incorporate many elements of the senses. From changing colors to prickling sound, the technology is very well integrated.

From what I understand, the algorithm generates randomly from a set amount of patterns. The randomness of the installation has much more to do with how the light refracts than with how the algorithm generates. Creating these complex yet beautiful overlays seems to have been a daunting computing task.

View post on imgur.com

Jason Zhu-Project-03-Dynamic-Drawing

sketch

/* Jason Zhu
Section E
jlzhu@andrew.cmu.edu
Assignment-03
*/

// This code demonstrates the Sunset!

// Easing Variables
var easing = .05
var x = 1;
var y = 1;

function setup() {
    createCanvas(640,480);  
}

function draw() {
    // Max Min Function
    noStroke();
    var mX = max(min(mouseX, 640), 0);
    var mY = max(min(mouseY, 480), 0);

    // Background Change
    var g = (480-mY)*(.309)+85;
    var g2 = (480-mY)*(.309)+85;
    background(255,g,100);
    
    // Ease Sun Function
    var tarY = mY;
    var dy = tarY - y;
    y += dy * easing;

    // Sun Shadow Large
    fill (360,g-20,140)
    ellipse(x + width / 2,y,mouseY / .35 +20,mouseY / .35 +20);
    if (y> 395) {
        y=395
    }

    // Sun Shadow Medium
    fill (330,g-20,100)
    ellipse(x + width / 2,y,mouseY / .55 +20,mouseY / .55 +20);
    if (y> 395) {
        y=395
    }

    // Sun Shadow Small
    fill (270,g-20,60)
    ellipse(x + width / 2,y,mouseY / .9 +20,mouseY / .9 +20);
    if (y> 395) {
        y=395
    }

    // Sun  
    fill (250,g-40,40)
    ellipse(x + width / 2,y,100,100);
    if (y> 395) {
        y=395
    }

    // Grass 
    var g2 = (480-mY)*(.309)+85;
    fill(135,g2,100);
    rect(0,410,640,120)

    // Right Shade
    fill(0);
    rect(640, 0, -.815*y, 480);

    // Left Shade
    fill(0);
    rect(0, 0, .815*y, 480);

}

This project was incredibly hard but rewarding. For me, thins project is when concepts really came together. It was a struggle to figure out how various variables interacted, but I eventually was able to resolve most issues. I had a particularly hard time with rotations and angles. I eventually figured out how to troubleshoot some of these issues, though a few questions linger. Overall, I am fairly satisfied.

Jason Zhu-LookingOutwards-03


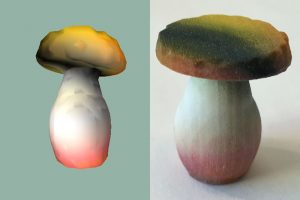
This image is a computer’s take on a mushroom!

This project was created by Joel Lehman, an assistant professor at the IT University of Copenhagen. The work is untitled, but it was created in 2016. Link: https://www.popsci.com/creative-ai-learns-to-sculpt-3d-printable-objects.

I really liked this project because I thought it did a good job of incorporating a human touch to a rigid process. In fact, the algorithm mimicked the human learning process via deep neural networks.

From what I can tell through the use of image recognition, the computer can get fairly close to something that resembles an object. Though not perfect, this is something unique. The computer is in essence drawing an object in its own style. In a way the algorithm is generating objects at random and through many many repetitions is able to produce something close to the object it has been trying to draw.

The artistic sensibilities are manifested in the creation algorithm. While the algorithm is random, the process in which it is generated (better versions serve as starting points for future generations) helps to determine the style of the content being produced. In fact, one can tell that all the final images were created by the same algorithm.