My final project is going to be focused on typography and type interactions. I want to explore different ways I can enhance the reading experience of a poem on screens. I looked around for artists who worked with text interactions within javascript, and found some pretty interesting people.
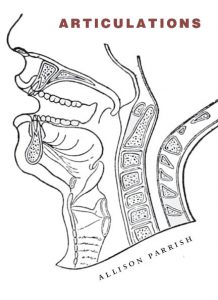
The first project I want to talk about is programmer and poet Allison Parrish’s Articulations, which scans over a ton of open source poetry and generates smaller poems based on them. Her work is an art piece and a critique on social norms, since it points out trends in poetry that highlight what humans are most compelled to write expressively about. Articulations is a compiled book, which I also find inspiring that something as technical as coded poetry can be published into a physical book.
The cover of Parrish’s book, which was released early 2018.
The other project I found was a lot different. Artist Bruce Luo creates processing sketches that imitate natural and organic movements, such as wind and rock formations and waves. One of his sketches in particular, Ripples (shown below) is just a really beautiful animation that relies on mouse activity.
(caption) Ripples is an interactive sketch that creates both randomized movement and movement dependent on mouse position.
In our final project, I want to synthesize ideas from both of these projects. Parrish’s generative poetry is a really interesting way to combine the use of code and type, and as we continue to brainstorm how we implement our chosen poem into our project, I’ll continually think of how she did this as inspiration. I also want to use a similar interaction to Luo’s, except with our project I plan to make moving objects all based on type.
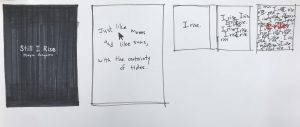
I am planning to work with my classmate Alice Fang to create an interactive poem. We plan to use one of our favorite poems, “Still I Rise” by Maya Angelou, not only because it’s an excellent piece of writing but also because her message feels especially pertinent in today’s political and social climate. The poem is 43 lines and 9 stanzas long, and we plan to figure out a way to break it up and display it on separate slides, which the user can move through as they continue to read and interact. We want to create interactions specific the different lines (or couplets, or stanzas). For example, the line “I’m a black ocean, leaping and wide,/Welling and swelling I bear in the tide”, we plan to animate the text based on the mouse position to imitate waves.
We were inspired by the work of programmer and poet Allison Parish, who creates a lot of work involving interactive text and generative poetry.
Some sketches and storyboards for the ways users can interact with the lines of text
/* Jaclyn Saik
Section E
jsaik@andrew.cmu.edu
Assignment-00-A
*/

var peter; //my variables for my turler started out with some names
var steven;
var greg;
var robin;
var carol;
var SPACE = 400/6 //spacing for the lazers
var Swish = 1; //variable for switching states
var spoke;

function setup() {
    createCanvas(400, 400);

    peter = makeTurtle(SPACE, 20);
    steven = makeTurtle(SPACE*2, 20);
    greg = makeTurtle(SPACE*3, 20);
    robin = makeTurtle(SPACE*4, 20);
    carol = makeTurtle(SPACE*5, 20);
}
function draw() {
    background("black");
    if(Swish == 1){
        pDrop();
        peter.setWeight(random(5, 14));
        peter.setColor(color(200, 160, random(30, 255)));
        steven.setColor(color(180, 200, random(30, 255)));
        steven.setWeight(random(5, 14));
        greg.setColor(color(190, 240, random(30, 255)));
        greg.setWeight(random(5, 14));
        robin.setColor(color(200, 200, random(30, 255)));
        robin.setWeight(random(5, 14));
        carol.setColor(color(160, 230, random(30, 255)));
        carol.setWeight(random(5, 14));
    }
    if(Swish == 2) {
        slow();
    }

}


function pDrop() { //all the lazers
        //first lazer
        background("black");
        fill("green")
        text("a great nightclub", 150, 30);

        peter.penDown();
        peter.face(90);
        peter.forward(30);
        peter.forward(frameCount/10);

        if (peter.distanceTo(SPACE, 20) > 500) {
            peter.goto(SPACE, 20);
        }

        //second lazer
        steven.penDown();
        steven.face(90);
        steven.forward(30);
        steven.forward(frameCount/10);

        if (steven.distanceTo(SPACE*2, 20) >500) {
            steven.goto(SPACE*2, 20);
        }

        //third lazer
        greg.penDown();
        greg.face(90);
        greg.forward(30);
        greg.forward(frameCount/10);

        if (greg.distanceTo(SPACE*3, 20) >500) {
            greg.goto(SPACE*3, 20);
        }

        //fourth lazer
        robin.penDown();
        robin.face(90);
        robin.forward(30);
        robin.forward(frameCount/10);

        if (robin.distanceTo(SPACE*4, 20) >500) {
            robin.goto(SPACE*4, 20);
        }

         //fifth lazer
        carol.penDown();
        carol.face(90);
        carol.forward(30);
        carol.forward(frameCount/10);

        if (carol.distanceTo(SPACE*5, 20) >500) {
            carol.goto(SPACE*5, 20);
        }

}

function slow(){
    background("Darkslategray");
    fill("red");
    text("a quieter, but still fun nightclub", 130, 30);
    spoke = makeTurtle(width / 2 + random(-100, 100), height / 2 + random(-100, 100));
    spoke.penDown();
    spoke.setColor("red");
    spoke.goto(mouseX, mouseY);


}

function mousePressed() {
    Swish++;
    if (Swish > 2) {
        Swish = 1;
    }
}


function turtleLeft(d){this.angle-=d;}function turtleRight(d){this.angle+=d;}
function turtleForward(p){var rad=radians(this.angle);var newx=this.x+cos(rad)*p;
var newy=this.y+sin(rad)*p;this.goto(newx,newy);}function turtleBack(p){
this.forward(-p);}function turtlePenDown(){this.penIsDown=true;}
function turtlePenUp(){this.penIsDown = false;}function turtleGoTo(x,y){
if(this.penIsDown){stroke(this.color);strokeWeight(this.weight);
line(this.x,this.y,x,y);}this.x = x;this.y = y;}function turtleDistTo(x,y){
return sqrt(sq(this.x-x)+sq(this.y-y));}function turtleAngleTo(x,y){
var absAngle=degrees(atan2(y-this.y,x-this.x));
var angle=((absAngle-this.angle)+360)%360.0;return angle;}
function turtleTurnToward(x,y,d){var angle = this.angleTo(x,y);if(angle< 180){
this.angle+=d;}else{this.angle-=d;}}function turtleSetColor(c){this.color=c;}
function turtleSetWeight(w){this.weight=w;}function turtleFace(angle){
this.angle = angle;}function makeTurtle(tx,ty){var turtle={x:tx,y:ty,
angle:0.0,penIsDown:true,color:color(128),weight:1,left:turtleLeft,
right:turtleRight,forward:turtleForward, back:turtleBack,penDown:turtlePenDown,
penUp:turtlePenUp,goto:turtleGoTo, angleto:turtleAngleTo,
turnToward:turtleTurnToward,distanceTo:turtleDistTo, angleTo:turtleAngleTo,
setColor:turtleSetColor, setWeight:turtleSetWeight,face:turtleFace};
return turtle;}
For this project, I was inspired by this really interesting room I got to experience at an art museum that would change states based on crowd movement. I like that I could use the turtles to relate their position to frame rate, so I played around with that.
Changxi Zheng is a professor at Columbia University who leads a team of researchers looking at ways to use computers to modify the sound of existing acoustic instruments.
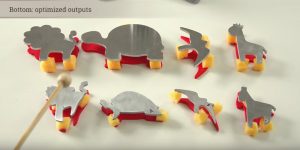
One project that really caught my eye is called “zoolophone.” Zheng and his team studied the ways that professional tuners adjust glockenspiel keys–by digging into the material and making divits that allow it to vibrate at the exact desired frequency. Zheng looked into the ways that computers could make this process easier, and discovered that by modeling this same interaction on a computer, they could calculate the exact vibration that the keys would make based on their shape. In this way, he was able to manipulate the shape of the keys, something that isn’t done usually with traditionally made instruments since it’s hard enough to tune rectangular shapes.
(video caption): The metallophone contact sounds is a project the team worked on to manipulate different within set algorithms in order to maintain a certain tone.
The zoolophones on display. Each shape plays a different specific note.
This allowed his team to have more fun with the shapes, too. He wrote a program that asks the computer o start with a certain shape, such as a t-rex, and then text vibrations against it and manipulate it’s form slightly until it makes the right particular sound they were looking for.
I found this very interesting because I am always interested in tools that designers make in order to educate children, and this seems like a useful tool for teaching about different notes.
Heather Dewey-Hagborg is a self described “transdisciplinary artist and educator”: basically, she’s doing a lot. I was drawn to her because she is interested in using art as research, something I really don’t hear that much about since most of the time people separate these two worlds. She is most well known for “biopolitical art”, where she will use biological research to inform her practice or activist art. Dewey-Haborg is well-known for controversial projects where she uses found human DNA and her own algorithms to create sculptures and figures.
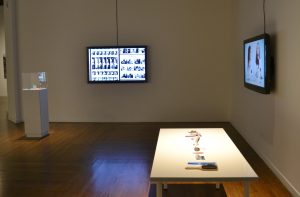
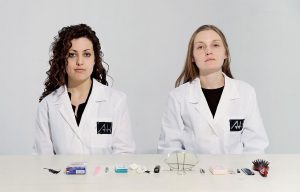
One project of hers that stood out to me is called “DNA Spoofing”. I picked it because I don’t think I’ve seen many people make jokes out of human DNA before, so this was intriguing. She takes a “playful” approach to genetic surveillance by discussing the different ways that humans shed their genetic material in public, and the ways in which is could possibly be harvested and used. She created an entire exhibit (which was shown in a lot of museums across the US and Europe) that includes a video example of how human’s shed DNA, as well as a display of the daily common objects that facilitate this.
I love this work because it sits at the intersection between science and art, particularly biology, which I’ve always been interested in. I also like how she is identifying the ways in which we accidentally volunteer our own genetic information to strangers, something I’ve never really thought about before and makes me a little uncomfortable (I think good art should do that). From a technology standpoint, this project is interesting because it’s talking about something she herself does as an artist/researcher.
The exhibit on display at the Ohio Museum of Contemporary Art, where users can interact with these objects while viewing the video.The actresses in the video, posed in front of the everyday objects they then demonstrate with
var sheep = [];
var terrainSpeed = 0.0005;
var terrainSpeedB = 0.0002;
var terrainSpeedS = 0.0001;

var terrainDetail = 0.02;
var terrainDetailB = 0.01;
var terrainDetailS = 0.03;

function setup() {
    createCanvas(480, 480);

    for (var i = 0; i < 10; i++){ //fills the array with sheep
        var rx = random(width);
        sheep[i] = makeSHEEPS(rx);
    }
    frameRate(10);
}

function draw() {
    background("PaleTurquoise"); //the sky
    noStroke();
    fill("coral"); //sun
    ellipse(130, 100, 30, 30)

    //darkest green hills
    beginShape();
    stroke("darkgreen");
    for (var x = 0; x < width; x++) {
        var t = (x * terrainDetail) + (millis() * terrainSpeedS); //creates detail in terrain
        //based on milliseconds that pass
        var y = map(noise(t), 0,1, 170, height/2);
        line(x, y, x, height); //I used this in order to fill my hills with color
    }
    endShape();

    //darker green hills
    beginShape();
    stroke("forestgreen");
    for (var x = 0; x < width; x++) {
        var t = (x * terrainDetail) + (millis() * terrainSpeedB); //terrain speeds differ as object appear closer
        //or further away
        var y = map(noise(t), 0,1, 210, height/2);
        line(x, y, x, height);
    }
    endShape();

    //green hills
    beginShape();
    stroke("darkseagreen");
    for (var x = 0; x < width; x++) {
        var t = (x * terrainDetailB) + (millis() * terrainSpeedB);
        var y = map(noise(t), 0,1, 280, height/2);
        line(x, y, x, height);
    }
    endShape();

    showSHEEP();
    byeOLDsheep(); //removes old sheep when they leave the frame
    addNewSHEEPS(); //adds more sheep

    //road bushes
    beginShape();
    stroke("olivedrab");
    for (var x = 0; x < width; x++) {
        var t = (x * terrainDetailB) + (millis() * terrainSpeed);
        var y = map(noise(t), 0,1, 430, 400);
        line(x, y, x, height);
    }
    endShape();
    noStroke();

    displayROAD();

}

function showSHEEP() {
    // prints and moves the sheep
    for (var i = 0; i < sheep.length; i++){
        sheep[i].move();
        sheep[i].display();
    }
}

function byeOLDsheep(){
    var sheepToKeep = [];
    for (var i = 0; i < sheep.length; i++){
        if (sheep[i].x + sheep[i].breadth > 0) {
            sheepToKeep.push(sheep[i]);
        }
    }
    sheep = sheepToKeep; //fills with remaining sheeps so they continue to print
}

function addNewSHEEPS() {
    var newSHEEPLikelihood = 0.009;
    if (random(0,1) < newSHEEPLikelihood) {
        sheep.push(makeSHEEPS(width));
    }
}

//makes the sheep move forward with each frame, depending on var speed
function sheepMove() {
    this.x += this.speed;
}

// the physical build of each sheep
function SheepDisplay() {
    var floorHeight = 20;
    var bHeight = this.nFloors * floorHeight;
    push();
    noStroke();
    translate(this.x, height - 40);
    //legs of sheep
    fill("wheat");
    rect(-7, -bHeight+3, 3, 16);
    rect(-1, -bHeight+5, 3, 16);
    rect(7, -bHeight+5, 3, 16);
    rect(12, -bHeight+3, 3, 16);

    //body of sheep
    fill(255);
    ellipse(0, -bHeight, 10, 10);
    ellipse(10, -bHeight+10, 10, 10);
    ellipse(5, -bHeight+10, 10, 10);
    ellipse(10, -bHeight+5, 10, 10);
    ellipse(10, -bHeight+5, 15, 15);
    ellipse(-5, -bHeight+5, 15, 15);
    ellipse(-5, -bHeight+10, 10, 10);
    ellipse(0, -bHeight+12, 10, 10);
    ellipse(10, -bHeight, 10, 10);
    fill("wheat");
    ellipse(-10, -bHeight+7, 12, 8);
    ellipse(-7, -bHeight+3, 2, 5);
    ellipse(-10, -bHeight+3, 2, 5);
    fill("black");
    ellipse(-10, -bHeight+7, 2, 2);

    pop();
}

function makeSHEEPS(birthLocationX) { //creates sheeep at their randomized locations within reason
    var lilsheep = {x: birthLocationX,
                breadth: 10,
                speed: -2.5,
                nFloors: round(random(2,8)),
                move: sheepMove,
                display: SheepDisplay}
    return lilsheep;
}

function displayROAD(){ //function for printing the road in the foreground
    noStroke();
    fill("silver");
    rect(0,height-50, width, height-50);
    fill("dimgray");
    rect(0,height-45, width, height-50);
}
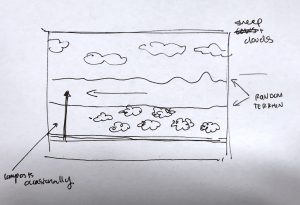
For this landscape, I wanted to make something that was idellic and nice to look at. When I was little, I would always try to draw the landscape outside when I was sitting in the car on road trips (especially when there are livestock to admire!) but I never could capture it accurately since it’s moving by so quickly. This is hardly an accurate description of what I would remember, but I like that this medium allows me to create moving animations that at least capture that aspect of my memory. I also had fun choosing colors.
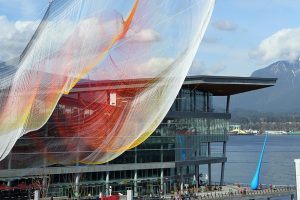
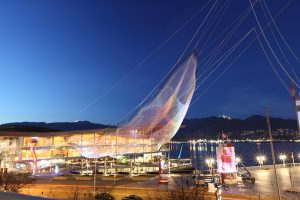
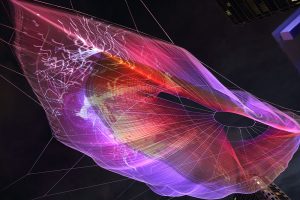
This week, I chose to look at an artist that Sophia Kim found in week 7. “Unnumbered Sparks” is a giant interactive installation that was made by artists Janet Echelman, Aaron Koblin and the rest of the people at Google Creative Lab. The installation was made to celebrate TED’s 30th anniversary, and was installed in Vancouver, Canada from March 15-22, 2014. It was most effective at night, when it was illuminated.
I was interested in this piece not only because it’s absolutely beautiful and something I would definitely pay to see in real life, but also since it is work fromthe Creative Lab and I’ve always been interested in what they put out.
Sophia did a really good job talking about how interactive the sculpture is with devices like tablets and smartphones. I found it interesting that the sculpture is a representation of Google Chrome: since the lighting represents a “single fullscreen Google Chrome window over 10 million pixels in size”. This is also a pretty obvious way for Google to brag about their own web browser, but nevertheless, it’s pretty to look at.
Something that I want to look further into the the library Polymer, which the entire project is based on. Polymer is an open source library that lets you make unique, customized HTML elements. As a future digital designer, I find it interesting that there are libraries like this where you can create data that’s open to the public to use. In a way, it makes this art feel more approachable and easier to fathom.
Daytime, when the translucent materials are most obvious.At dusk, when you can really start to see the colors.Illuminated at night.
/* Jaclyn Saik
Section E
project 09
*/
var ryder;
function preload(){
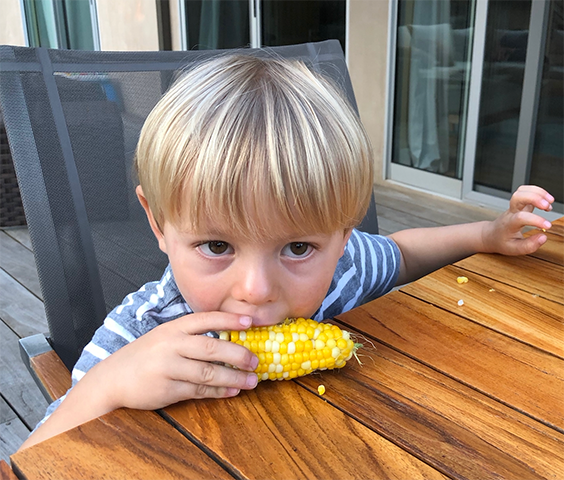
var buddy = "https://i.imgur.com/PGxudTG.png"; //my brother eating corn!
ryder = loadImage(buddy); //variable to contain the pixels in image
}
function setup() {
createCanvas(480, 470);
background("goldenrod");
ryder.loadPixels(); //loads actual pizels into program
frameRate(1000);
}
function draw() {
var px = random(width); //randomized variable for x position
var py = random(height);//randomized variable for y position
var ix = constrain(floor(px), 0, width-1); //var for grabbing pixel data
var iy = constrain(floor(py), 0, height-1);
var theColorAtLocationXY = ryder.get(ix, iy);
var rando = random(-30, 30); //variable to randomize stroke weight later
var stro = random(1, 5); //variable to randomize stroke weight later
var stroTwo = random(1, 10);
noStroke();
fill(theColorAtLocationXY); //fills with the color at that particular pizel
stroke(theColorAtLocationXY);
strokeWeight(stro); //randomized stroke weight so stars are unique
drawStar(px, py); //draws star at random x and y position each time draw is called
line(px, py, px+rando, py+rando); //pritns "tails" connected to stars
var theColorAtTheMouse = ryder.get(mouseX, mouseY);
stroke(theColorAtTheMouse);
strokeWeight(stroTwo); //makes a line that changes stroke weight
line(pmouseX, pmouseY, mouseX, mouseY); //draws line with the mouse,
//so you can paint on the canvas a little bit
}
function drawStar(x, y) {
textSize(random(20, 70)); //randomizes size of star
text("*", x, y); //creates object that can be manipulated by position later
}
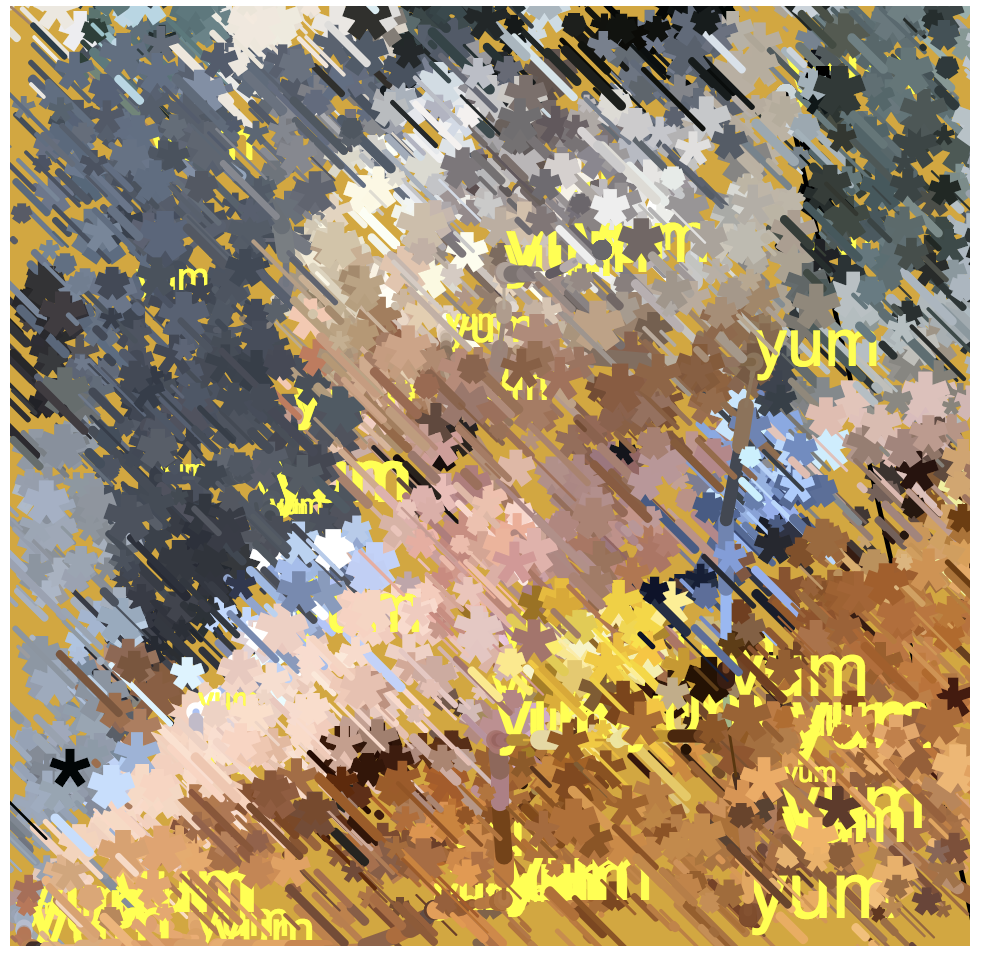
function mousePressed() { //draws "yum" when mouse is pressed
noStroke();
textSize(random(10, 40)); //alternates size of text
fill("yellow");
text("yum", mouseX, mouseY);
}
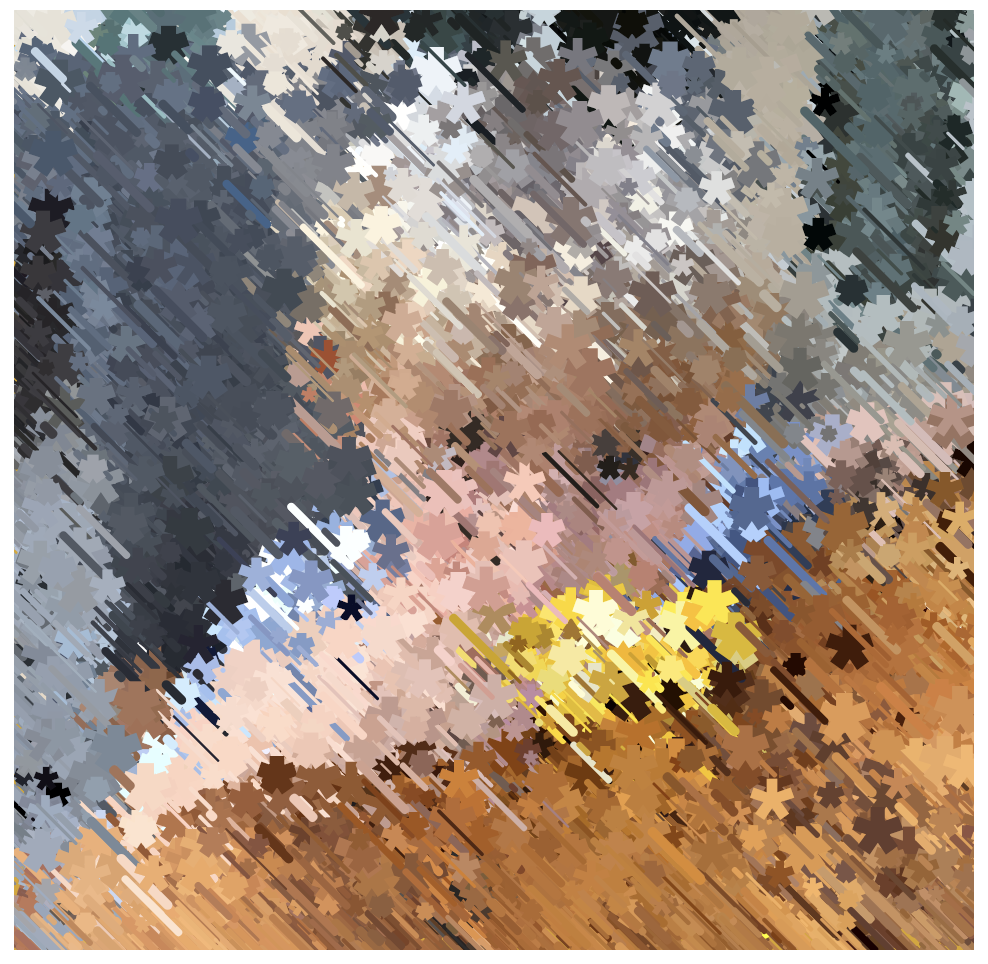
For this project, I instantly though of my little brother: he is always posing for funny photos and I especially miss him right now. I chose to use an asterisk to color in his image, since I think it adds a whimsical touch to the image. I added some randomized tails to each asterisk is order to try to create this oil-painting technique where the image looks like it has some motion to it. I also edited the mouse function so that the stroke is randomized each millisecond, so that it appears like your mouse is a brush that is applying varying amounts of paint. Since my brother Ryder is eating corn in this image, when you click your mouse, the word “yum” pops around. It makes him somewhat of a meme, which is how I see him a lot so it makes sense to me.
The original image: my little brother RyderWhen the image is just starting outAs it continues, you can decorate it with yellow “yums” and draw with the mouse to create a line.Somewhat finished, with yums includedAfter being left alone for about 3 minutes.
I watched the speech by Kate Hollenbach, is a programmer and new media artist from LA who works with a lot of technologies that and compute human gestures and the relationships between the human body and the objects in space around them. I chose her because a lot of her work is inspired by the idea of looking at humans through the perspective of the machines that they use, mainly phone and computers, and this reminded me of assignment 08-A and the eye tracking software we looked at. Coincidentally, I am learning about eye-tracking right now in an entirely separate design-studies course, so it seems like this topic is spanning almost every different discipline/topic I am studying right now!
Kate was a very good presenter. She was very comfortable on stage and utilized video examples of people interacting with the products that Oblong, her design agency, built. I especially liked the example she showed with a near-360 surrounding display of screens that allowed a person to stand in the center and interact with programs from a full-circle perspective.
I also was interested in the software Kate designs to enable this rapid-time spatial analysis. One program her agency built, “greenhouse”, allows coders to prototype using space and incorporating users into their design immediately, which sounds like something I want to do!
Below is another project she made, about human life through the perspective of our laptops and phones.
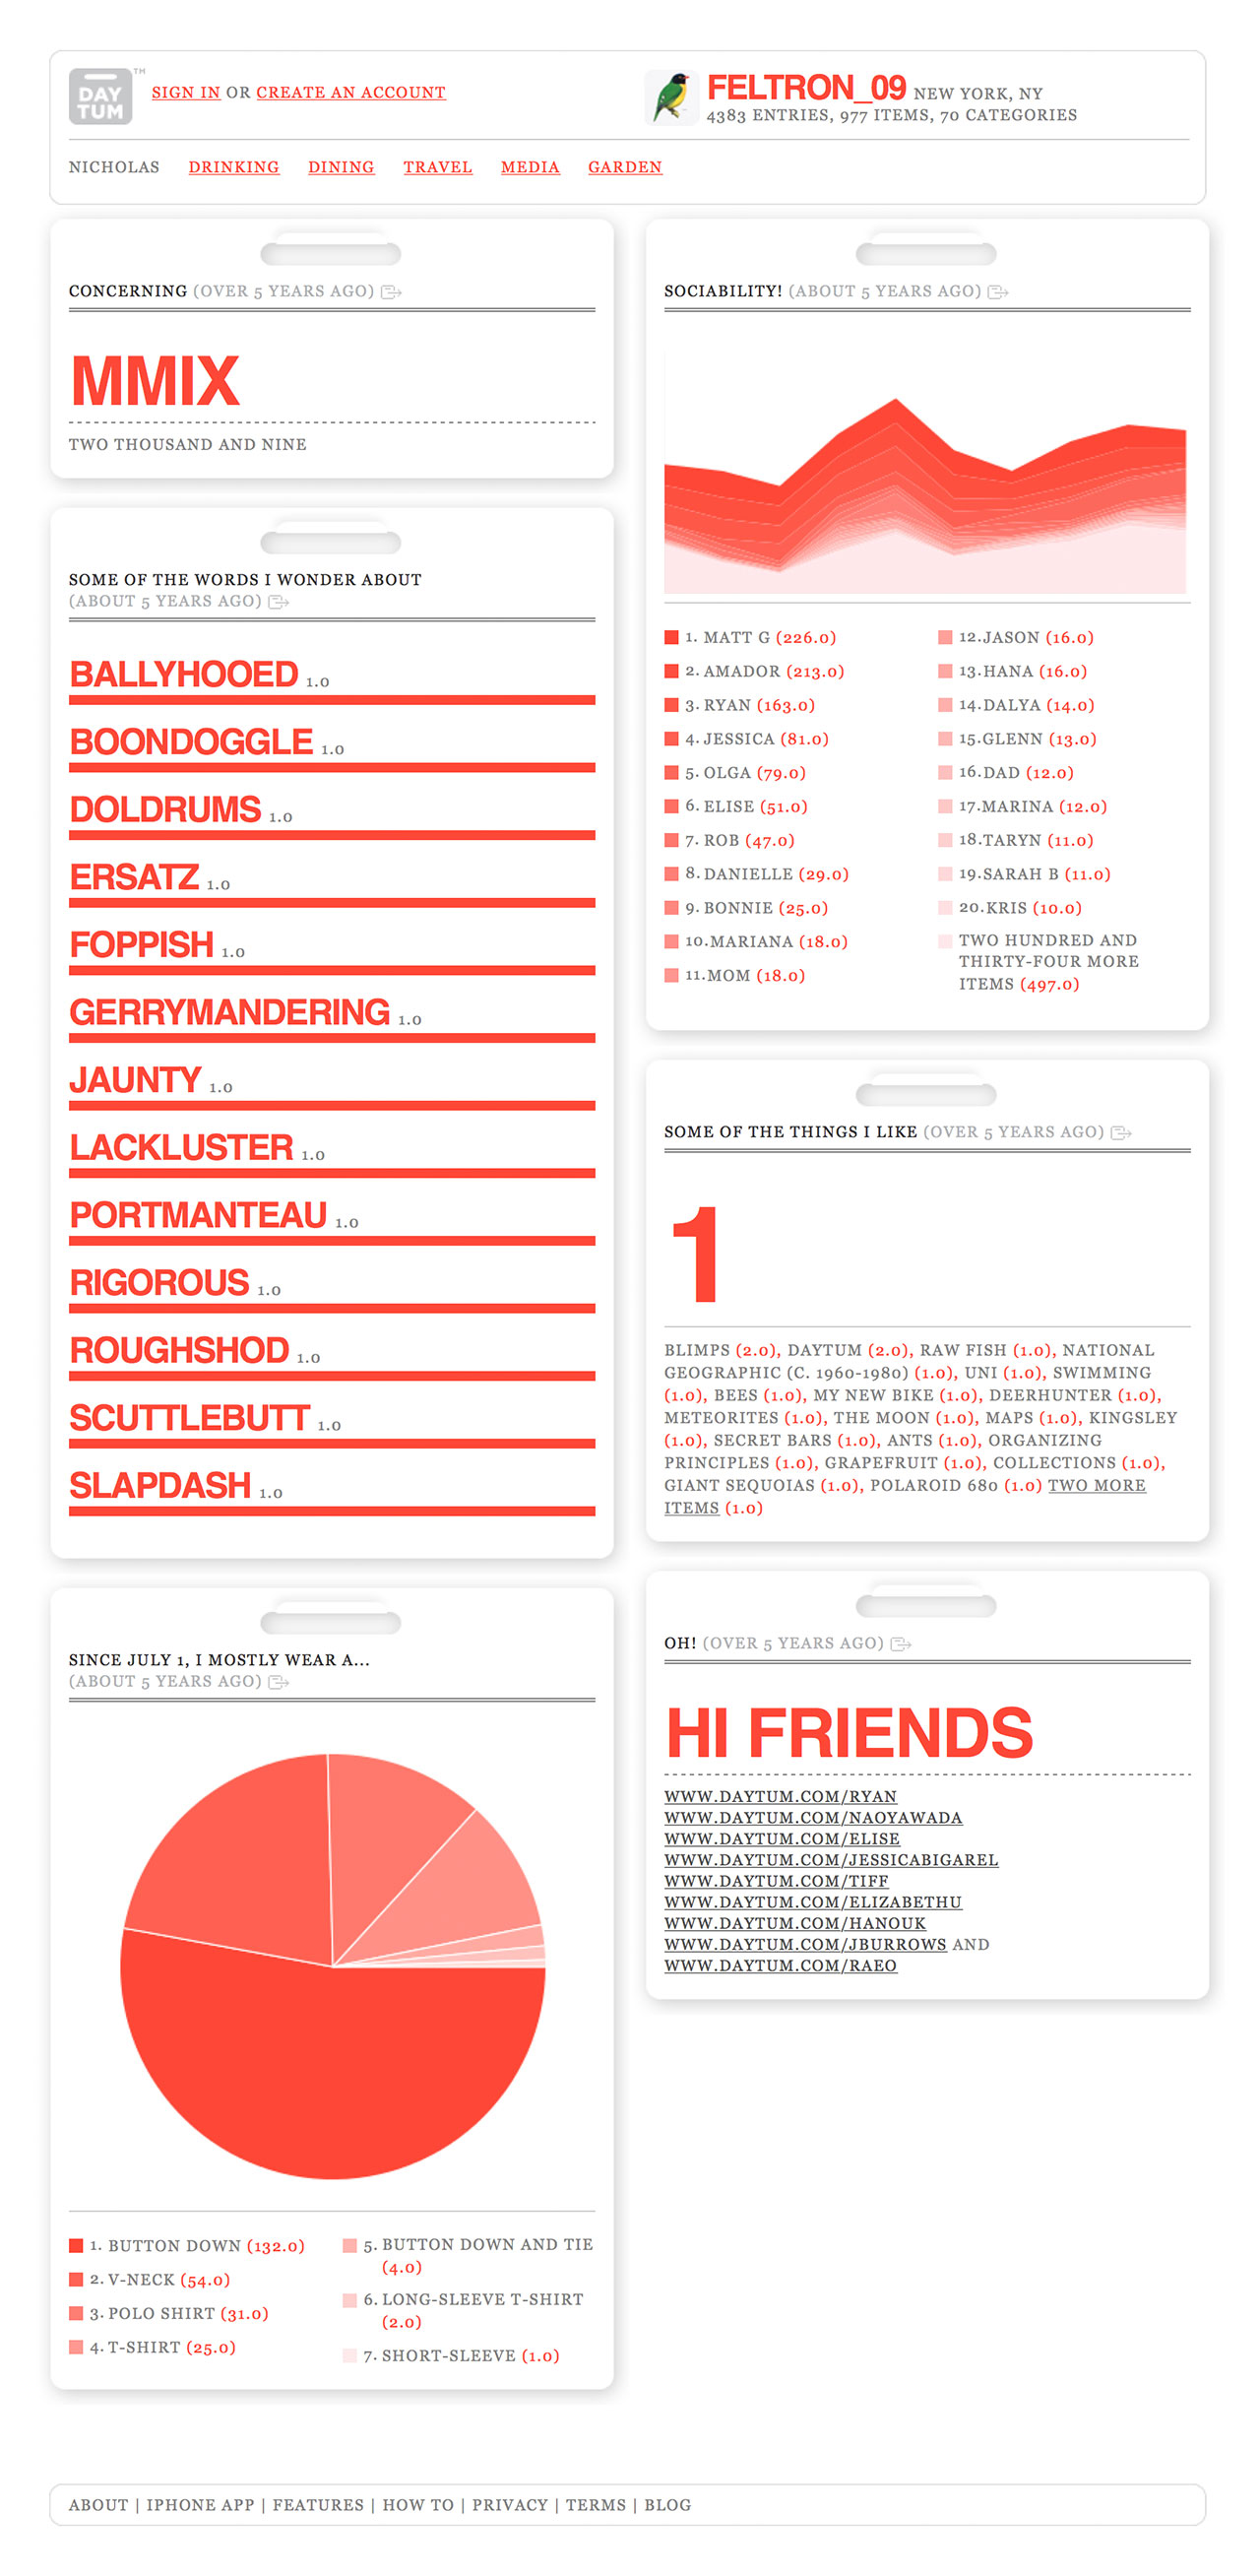
Nicholas Felton is one of my new favorite designers. He is a trailblazer in the field of digital data visualisation, and I am especially interested in his story because he came from traditional graphic design and moved on to creating algorithms that collect data after he realized how much he enjoyed representing it through graphics. I have always been interested in editorial design specifically because a lot of times, it involved an interesting combination of powerful aesthetics and thought-out information representation, and it’s hyper focused on making the reader understand what it’s trying to communicate. Felton does this with his in a lot of his work, and especially in the project Daytum.
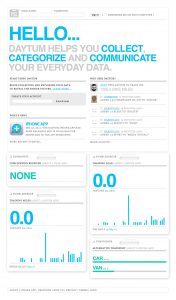
A screenshot example of the home panel for Felton’s own account, where his personal statistics are graphed elegantly in front of him.The landing page for the website, which shares data from users around the world as an example of the programs capabilities.
Daytum is a platform an app that collects personal statistics from the user and elegantly communicates them in different ways. The spreadsheets and visuals it produces are created in the spirit of Felton’s famous Annual Reports. Based on the interface and the type of information this app tracks, I’m thinking that it is created with code that takes certain data sets (and has to have different versions or be flexible to different types of data) and then puts them through a program that organizes the data points in relationship to each other and plots/prints them in different formats. What I find interesting, as a communications designer who is currently studying typography, is that the program probably has to account for formatting errors and irregularities that come with differing data: longer words that change the word spacing, numbers that contain decimals or are greater/less than zero, and orphaned words and other paragraph issues. I think what makes this program so elegant is Felton’s eye for clean design, so that these personal data points are plotted neatly and elegantly no matter what they are.
This project was released in 2008. I know there are a lot of similar and far more developed apps out there now, but this is on the first times an iPhone app took on this form, and I think thats important.
![[OLD FALL 2018] 15-104 • Introduction to Computing for Creative Practice](../../wp-content/uploads/2020/08/stop-banner.png)