Jessica Timczyk – Project 07 – Curves

Curves

// Jessica Timczyk
// Section D
// jtimczyk@andrew.cmu.edu
// Project-07-Curves

// Global Variables
var z;
var colorR;
var colorG;
var colorB;


function setup() {
    createCanvas(480, 480);
    z = -width / 4;
}

function draw() {
    background(255, 215, 250);
    translate(width / 2, height / 2, z);
    rotate(map(mouseX, 0, width, 0, TWO_PI)); // allow curve to rotate
    colorR = map(mouseY, 0, height, 0, 100); // variables for color transition
    colorG = map(mouseY, 0, height, 70, 100);
    colorB = map(mouseY, 0, height, 100, 220);
    drawLoxodrome(0.4, map(mouseX, 0, 400, 0, 480)); // draw curves and change size as mouse moves
}

function drawLoxodrome(b, scal) { // equations for drawing the curves of the loxodrome
    for (var a = 0.4; a < 4; a += 0.2) {
        noStroke();
        fill(colorR, colorG, colorB); // fill of the curves change
        beginShape(QUAD_STRIP); // establish the begining of the curve shape
        var w = 0.1 / sqrt(a + 1);
        for (var t = -20; t < 20; t += 0.1) {
            var q = 4 + a * a * exp(2 * b * t);
            vertex(scal * 4 * a * exp( b * t) * cos(t) / q, scal * 4 * a * exp( b * t) * sin(t) / q);
            var c = a + w;
            q = 4 + c * c * exp(2 * b * t);
            vertex(scal * 4 * c * exp(b * t) * cos(t) / q, scal * 4 * c * exp(b * t) * sin(t) / q);
        }
        endShape();
    }
}

I really enjoyed doing this project, it allowed me to experiment with a bunch of different curves and shapes. Although it took a while to decide what shape to do and as well figure out the different equations and what each one does, the ending results are very interesting and intricate curves. I liked being able to manipulate and explore what each of the different parameters control. After messing with the different variables and trying to change different ones with the movements of the mouse, I  decided on having the mouse movement control the scale of the shape rather than one of the other parameters so that it would keep the main structure of the curve intact as it moved. Overall, I really enjoyed this project because it allowed me to explore more things and aspects of the code than other previous projects have allowed us.

Jessica Timczyk – Looking Outwards 07

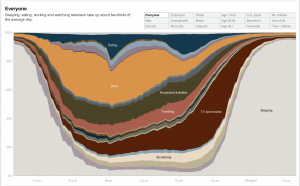
A visual of a chart of the amount of time on average people spend doing different things in one day.

Created by Amanda Cox in 2011, this graph shows how different groups spend their day, broken down by different activities. Within the graph, you can select different groups and demographics to see the differences in how different groups of people spend their day. I find this data extremely interesting because it allows us to see how the activities change based on the group that you are looking at. It provides us a way to compare these different demographic groups that I have never thought of before. Although I am not sure how the artist accomplished this work algorithmically, I suppose that they gathered the data by asking a random selection of people from these different groups how they spend their day over a certain period of time. The creator’s artistic sensibilities are reflected in the final work through her choice of colors and the form in which the graph was displayed, for changing the type of graph used to display the data could easily change how it is perceived.

Jessica Timczyk – Project 06 – Abstract Clock

Cookie Clock

// Jessica Timczyk
// Section D
// jtimczyk@andrew.cmu.edu 
// Project-06-Abstract Clock

// Global Variables
var chipX = 0; // x position of choco chip
var chipY = 0; // y positiom of choco chip
var chunkX = 0; // x position of choco chunk
var chunkY = 0; // y position of choco chunk

//--------------------------
function setup() {
    createCanvas(300, 300);
    //millisRolloverTime = 0;
    
    frameRate(1); // the chips change position every second so you can tell when a second goes by
}

//--------------------------
function draw() {
    background(183, 225, 255);
    
    // circular cookie shape
    strokeWeight(3);
    fill(206, 149, 75);
    ellipse(width / 2, height / 2, 250, 250);

    // bite out of cookie
    fill(183, 225, 255);
    noStroke();
    ellipse(width / 2 - 120, height / 2, 30, 35);
    ellipse(width / 2 - 115, height / 2 - 17, 30, 27);
    ellipse(width / 2 - 120, height / 2 - 30, 30, 35);

    // Crumbs at bite
    stroke(60, 46, 16);
    fill(206, 149, 75);
    ellipse(width / 2 - 135, height / 2 - 15, 12, 12);
    ellipse(width / 2 - 117, height / 2 - 5, 6, 6);
    ellipse(width / 2 - 120, height / 2 - 30, 9, 9);
    ellipse(width / 2 - 136, height / 2 + 35, 15, 15);
    ellipse(width / 2 - 125, height / 2 + 50, 6, 6);
    ellipse(width / 2 - 138, height / 2 + 65, 5, 5);
    ellipse(width / 2 - 140, height / 2 + 5, 7, 7);
    ellipse(width / 2 - 115, height / 2 - 65, 6, 6);
    ellipse(width / 2 - 128, height / 2 - 60, 9, 9);

    // top right corner crumbs
    ellipse(245, 26, 7, 7);
    ellipse(265, 37, 17, 17);
    ellipse(255, 55, 10, 10);

    // Fetch the current time
    var H = hour();
    var M = minute();
    var S = second();
    
    // number time text
    fill(255);
    text("   "   + H + "  : ", 5, 22);
    text("   " + M + "  : ", 35, 22);
    text("   " + S, 65, 22);

    // chocolate chips for the number of minutes
    for (var i = 0; i < M; i ++) {
        noStroke();
        var chipX = random(65, 240);
        var chipY = random(65, 240);
        fill(87, 64, 16);
        ellipse(chipX, chipY, 10, 10);
    }

    // chocolate chunks for the number of hours
    for (var j = 0; j < H; j ++) {
        fill(52, 39, 11);
        stroke(33, 25, 8);
        var chunkX = random(70, 220);
        var chunkY = random(70, 220);
        rect(chunkX, chunkY, 11, 22);
    }
    stroke(0);
}

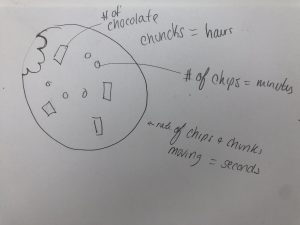
I really enjoyed this project, it was fun to try to think of a way to convey time unconventionally. I finally came up with making a “cookie clock” after thinking about what I wanted to do and I am happy with how the clock turned out, looking very cartoonish and almost comical. It took me a bit to figure out how I wanted to represent each variable, hours, minutes and seconds and I eventually decided to, rather than physically represent seconds, have the seconds be represented by the pace of the movement of the chocolate chips and chunks. I tried briefly to make the cookie 3D but it ended up being too complicated for this project, but I would like to learn how to do that in the future.

My sketch for the cookie clock.

Jessica Timczyk – Looking Outwards 6

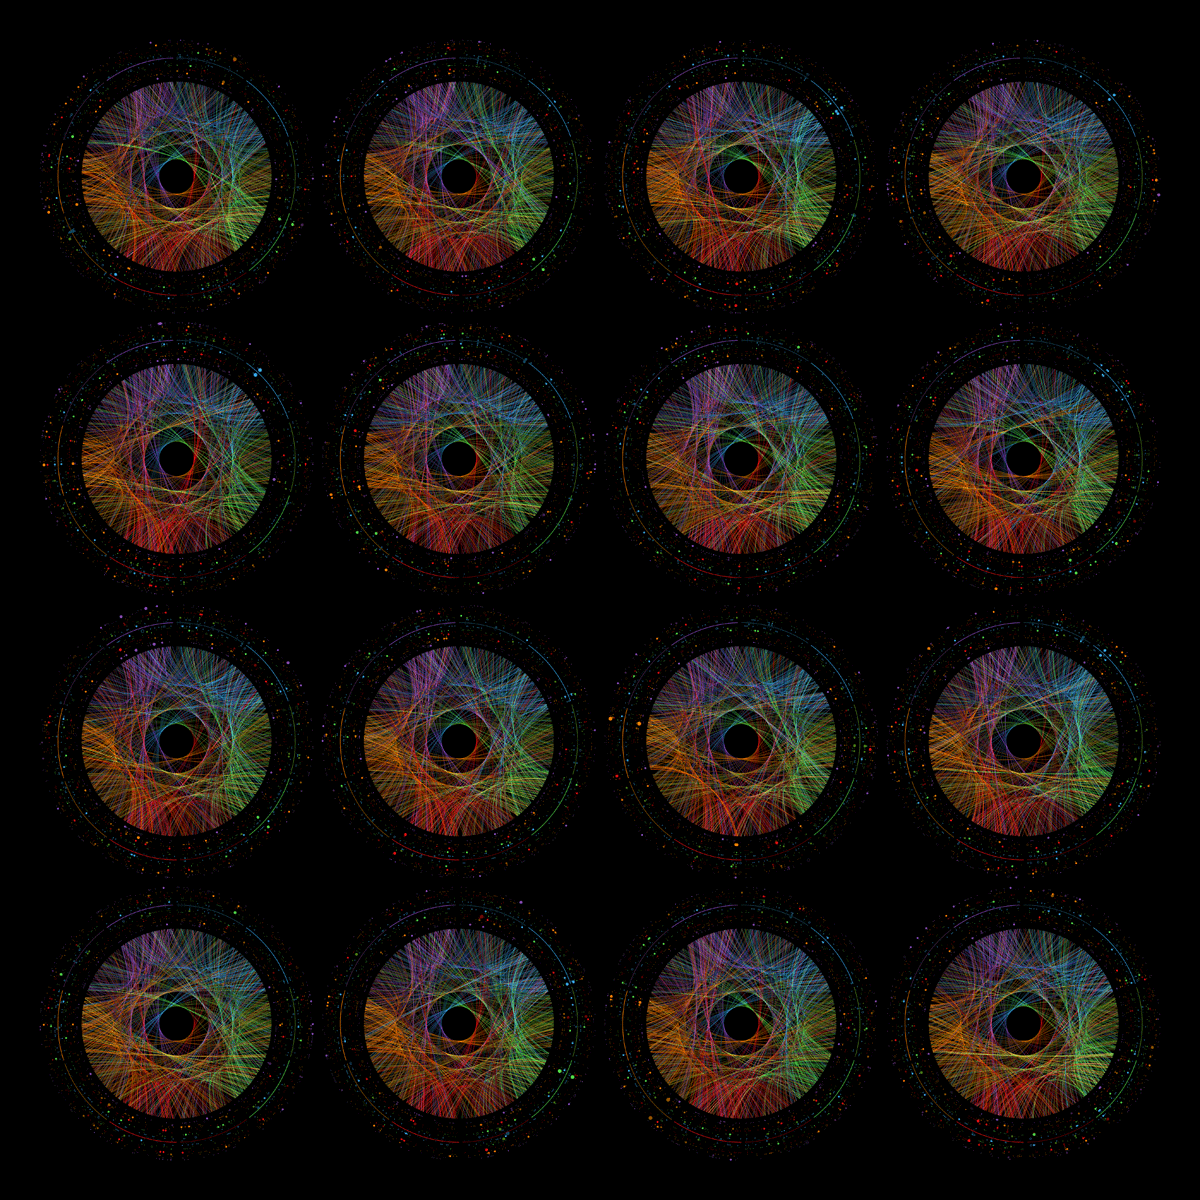
Above is a photo of an artwork by Martin Krzywinski created by showing the digit transition paths of sixteen 1,000 digit random numbers.

Created 2013 by Martin Krzywinki, the art work above, called the Faces of Randomness is a digital work created by drawing lines between the digit transitions of sixteen different random 1,000 digit numbers. I find this work very interesting because though all the numbers are different and random, the resulting circles look oddly similar even though they are all in fact unique. I suppose that the artist used an algorithm to generate sixteen random 1,000 digit numbers because it would be infeasible to obtain them from the real world. The artist’s sensibilities can be seen in the placement and colors chosen to make up the work, making it pleasing to the eye to look at.

Jessica Timczyk – Project 05 – Wall Paper

Wall Paper

// Jessica Timczyk
// Section D
// jtimczyk@andrew.cmu.edu
// Project-05-Wall Paper

var SIZE = 10;

function setup() {
    createCanvas(600, 400);
}

function draw() {
	background(185, 248, 252); // light blue between cirlces
	drawGrid();
	noLoop();
}

function drawGrid() {
	
	// small squares covering background
	for (var y = SIZE / 2; y < height + SIZE / 2; y += SIZE) {
        for (var x = SIZE / 2; x < width +SIZE / 2; x += SIZE) {
            ellipse(x, y, SIZE, SIZE);
        }
    }
	// diagonal stripes
	for ( var i = 0; i <= 150; i ++) {
		x1 = i * 70;
		y1 = i * 70;
		strokeWeight(20);
		stroke(255, 235, 14)
		line(width + 300, x1 + 100, 0, y1 - 600);
	}
	// loop to repeatedly draw squiggle shape
	for (var x = 20; x <= width + 60; x += 50) { 
		for ( var y = 0; y <= height + 80; y += 60) {
			fill(0);
			stroke(255);
			strokeWeight(3);
				beginShape(); // squiggle shape
			vertex(x - 25, y - 5);
			bezierVertex(x - 50, y , x - 45, y + 65, x + 5, y + 25);
			bezierVertex(x - 10, y + 40, x - 30, y + 115, x - 25, y - 5);
			endShape();
		}
	}
}


This wall paper did not turn out how I originally intended it to. I had imagined making a sort of night sky mural but along the way I had gotten distracted by drawing many circles as apposed to a few to make stars. Spiraling off of that I eventually morphed what was a moon shape into the weird squiggly shape and built off of it from there. Although it didn’t turn out how I had originally intended, I very much like how the pattern turned out and I find it very  visually interesting and now reminds me slightly of candy stripes

.

Jessica Timczyk – Looking Outwards 05

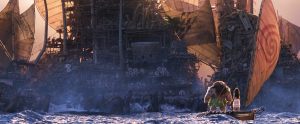
The above image is a still from the Disney movie Moana, showing the large rendered boats that the artist worked on in the background.

Pedro Conti is a Brazilian 3D computer graphics artist, with one of his recent and most interesting project being a 3D graphics artist on Disney’s Moana movie in 2016. He utilized 3D computer graphics to create many backgrounds, landscapes and characters in the movie. Specifically looking at the Kakamora barges he helped to create in one of the scenes of the movie, the project is so impressive due to the shear number of objects that cover the structure and how many shots (140) were needed for the sequence.

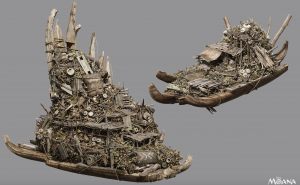
The image shows a close up shot of the rendered boats prior to being placed in the scene.

The artist utilized the program XGen, which is a geometry instancer, to populate the boat with all of the objects on it. While the artist had to follow the artistic direction of the movie, the artist’s vision is manifested in how and where different items are  placed on the boat.

Jessica Timczyk – Project 4 String Art

line drawing

// Jessica Timczyk
// Section D
// jtimczyk@andrew.cmu.edu
// Project-04-string art
function setup() {
    createCanvas(400, 300);   
}

function draw() {
    background(126, 25, 25);
    // variable set up
    var x1 = 0;
    var x2 = 0;
    var x3 = 0;
    var x4 = 0;
    var y1 = 0;
    var y2 = 0;
    var y3 = 0;
    var y4 = 0;

    // create a loop to draw many lines
    for( var i = 0; i <= 150; i ++) {
        // set new values for all the variables
        x1 += i;
        y1 += i;
        x2 += 2 * i;
        y2 += 2;
        x3 += 20;
        y3 -= i * 1/3;
        x4 = 2 * i;
        y4 = 2 * i;
        // orange lines
        stroke(246, 150, 14);
        strokeWeight(3 / 4);
        line(x1, y1, width, 70);
        // white lines
        stroke(255);
        strokeWeight(1/2);
        line(mouseX, y2, x2, height);
        // light brown lines
        stroke(142, 91, 53);
        strokeWeight(2);
        line(-mouseX + x3, y3, 400, 300);
        // dark brown lines
        stroke(49, 25, 7);
        strokeWeight(0.5);
        line(x4, y4, 210 - mouseX, 120);
        // grey lines
        stroke(68, 68, 68);
        strokeWeight(3/4);
        line(0, y2, x2, height);

    }
}

I really enjoyed this project because it allowed me to experiment with different parameters to see what would happen. As a result, my string art came about almost accidentally as I manipulated the parameters to see what they would do.

Jessica Timczyk – Looking Outwards 04

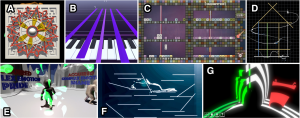
The photo above shows screenshots of different students’ work utilizing the Chunity program.

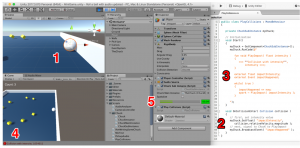
Chunity is a programming environment developed by a PhD student and associate professor at Stanford’s Center for Computer Research in Music and Acoustics, Jack Atherton and Ge Wang in 2018. The program uses the programming language ChucK and the real time graphics engine in Unity. I find this project extremely interesting because the tools are driven by audio as the most important component with visual graphics coming second, following the audio. This is contrary to how I would think most programs and tools run, with visual graphics as the main component and audio being secondary. In the algorithms generated using this program, physical changes in the graphics of the program are accompanied by audio, integrated with real time components. When a final project is created using this programming environment, the coder is able to artistically express their vision through how  the audio is integrated with the visual graphics.

The photo shows a screenshot of an example of how code is written to include both the audio and visual graphics.

Jessica Timczyk – Project 03 Dynamic Drawing

space

// Jessica Timczyk
// Section D
// jtimczyk@andrew.cmu.edu
// Project-03-Dynamic Drawing

function setup() {
    createCanvas(640, 480);
}

function draw() {
    background(7, 9, 76);

    var mX = max(min(mouseX, 640), 0); // keeps mouseX between 0 - 640

    var size = mX * 3 / 640

    var colorR = max(min(mouseX, 244), 90);
    var colorG = max(min(mouseX, 70), 1);
    var colorB = max(min(mouseX, 100), 60);

    mX = 640 - mX;
    
    // shooting star
    fill(248, 246, 100);
    stroke(255);
    strokeWeight(4);
    quad(290 + 15/2, mX - 120, 290 + 8, mX - 123, 330, mX - 150, 340, mX - 135); // star tail
    quad(290, mX - 100, 305, mX - 120, 290, mX - 140, 275, mX - 120); // star shape

    mX = max(min(mouseX, 640), 0);

    // spaceship shape setup
    noFill(); // glass dome
    stroke(255);
    ellipse(mouseX, height * 2/3 - 30, 85, 120);


     // alien colors
    fill(9, 172, 20);
    stroke(9, 172, 20);
    rect(mouseX - 2.5, height * 2/3 - 60, 5, 7); // neck

    stroke(18, 111, 25);
    triangle(mouseX, height * 2/3 - 10, mouseX - 15, height * 2/3 - 50, mouseX + 15, height * 2/3 - 50); // torso

    triangle(mouseX - 3/2, height * 2/3 - 74, mouseX, height * 2/3 - 80, mouseX + 3/2, height * 2/3 - 74); // antena

    ellipse(mouseX, height * 2/3 - 65, 22, 15); // head

    fill(0);
    stroke(255);
    strokeWeight(3);
    ellipse(mouseX - 5, height * 2/3 - 65, 7, 6); // left eye ball

    ellipse(mouseX + 5, height * 2/3 - 65, 7, 6); // right eye ball

    fill(142, 142, 144); // spaceship body
    stroke(0);
    strokeWeight(3);
    ellipse(mouseX, height * 2/3, 200, 75);

    // seam on space ship
    strokeCap(ROUND);
    stroke(0);
    fill(0);
    rectMode(CENTER);
    rect(mouseX, height * 2/3, 160, 1);

    // Planet 1
    fill(219, 34, 47);
    noStroke();
    ellipse(125, 125, 100  * size, 100 * size);

    size = 3 - size; // reverse size for second planet

    // Planet 2
    fill(255, 187, 3);
    ellipse(450, 200, 80 * size, 80 * size); // planet
    fill(colorR, colorG, colorB); // color of ring changes with mouse
    ellipse(450, 200, 130 * size, 10 * size); // ring

    // stars
    var starX = mouseX;

    fill(249, 215, 81);
    noStroke();
    push(); // star 1
    translate(100, 400);
    rotate(starX / width * mX); // star rotates around itself as mouse moves
    rectMode(CENTER);
    rect(0, 0, 7, 12);
    pop();

    push(); // star 2
    translate(20, 300);
    rotate(starX / width * mX);
    rectMode(CENTER);
    rect(0, 0, 10, 15);
    pop();    

    push(); // star 3
    translate(260, 30);
    rotate(starX / width * mX);
    rectMode(CENTER);
    rect(0, 0, 20, 15);
    pop();

    push(); // star 4
    translate(500, 70);
    rotate(starX / width * mX);
    rectMode(CENTER);
    rect(0, 0, 5, 7);
    pop();

    push(); // star 5
    translate(600, 430);
    rotate(starX / width * mX);
    rectMode(CENTER);
    rect(0, 0, 40, 40);
    pop();

    push(); // star 6
    translate(210, 200);
    rotate(starX / width * mX);
    rectMode(CENTER);
    rect(0, 0, 15, 20);
    pop();

    push(); // star 7
    translate(450, 400);
    rotate(starX / width * mX);
    rectMode(CENTER);
    rect(0, 0, 10, 15);
    pop();
}

When writing this code I found it easy to come up with ideas of how and what I wanted to move but writing the code to implement such ideas was more difficult, and I thus had to simplify my ideas in certain areas. I am happy with how the drawing came out, looking very cartoonish how all of the variables move in conjunction to each other.

Jessica Timczyk – Looking Outwards 03

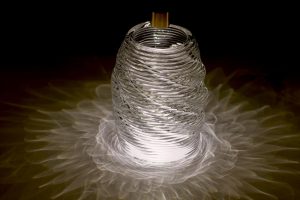
The photo above depicts a 3D printed  glass vase.

A project of the MIT Media Lab, MIT Glass Lab and Mediated Matter Group,  including researchers: John Klein, Michael Stern, Markus Kayser, Chikara Inamura, Giorgia Franchin, Shreya Dave, James Weaver, Peter Houk and Prof. Neri Oxman,  the G3DP project was created in 2014 to 3D print translucent glass into different shapes and sculptures. This project is excessively interesting because it takes an ancient art, like glass blowing, and translates it into modern technology. Many ancient arts like this have been kept to traditional methods of creation, so glass making and blowing’s introduction to 3D printing marks a milestone in the digital art world. Although the algorithm used to create these glass sculptures can only be inferred, it would make sense for an algorithm to be made to digitally construct the design and execution of each layer for each of the glass sculptures, before being sent to the 3D printer. While glass is usually seen in the form of vases, bowls, cups and etc, this project allows the creator to manifest their artistic style in the form and pattern in which the translucent glass sculptures are created, resulting in many varying and interesting shapes and forms.


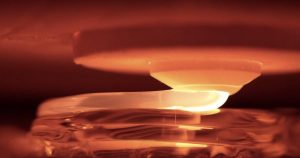
A close up shot of translucent glass being printed into a vase form.

The video above shows an in depth look into how the sculptures are printed and the algorithms behind them.