This was the animation on their website that caught my eye
Studio NAND’s website is like their work; it’s catchy and dynamic. One of their projects, Peak Spotting, took data gathered from Deutsche Bahn, a German railroad company, and created a tool that in real time displays data for all of their lines, and through use of historic data, projects estimations up to 100 days in the future for data like train use. I think that what they’ve made is both utilitarian and well-presented (you can really see that they care for style). It looks like they’ve developed their own industry-oriented app that displays all of the data that Deutsche Bahn records. In part, Deutsche Bahn is to thank for keeping such detailed records, but Studio Nand’s design team did a good job. The animation above is simple but colorful, and the bar charts are pleasant to look at without compromising the reality of the numbers. It’s nothing too abstract, and doesn’t aim to be art, but it’s just straight-up good data.
sketch
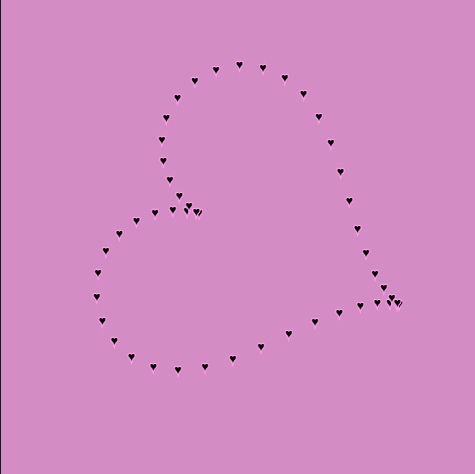
Pretty early on I went through the site of curves, and I found the heart curves and decided I anted to do one. Conveniently, the one I thought looked best was straightforward to make. I was interested if JavaScript would take unicode as strings, and fortunately it does. Unfortunately, it’s plagued by an issue shared with many unicode sets – emoji. I had to make sure the unicode I wanted wouldn’t render as an emoji, because that just doesn’t look as crisp. In hindsight, it ould have been cool if I had used the function to generate a path for a moving heart like Lab 6, but there’s time for that in the future.
This was when I first got the points to work with the unicode
// Kevin Thies
// kthies@andrew.cmu.edu
// Section C
// Project 07 - Curve Composition
var pointNum =100; // number of points in the heart
var bigScale =20; // scale value of the largest heart
var smallScale =2; // scale step of the iterations
var rotAngle =1; // rotation angle of hearts
var rotIncrement =.02; // increment of rotation per frame in radians
var xScale; // mouse X - dependant scaling value of heart
var yScale; // mouse y - dependant scaling v alue of heart
var iterations =10; // number of hearts drawn
functionsetup(){createCanvas(480,480);}functiondraw(){ // style
background(211,141,196);stroke(255,155,233);fill(0); // constrain the scaling of the X and Y of hearts
xScale =constrain(map(mouseX,0, width,0,1),.2,1);
yScale =constrain(map(mouseY,0, height,0,1),.2,1); // increment rotation
rotAngle = rotAngle += rotIncrement;push(); // move hearts to center of canvas
translate(width/2, height/2); // rotate around center of canvas by the rotation angle
rotate(rotAngle); // draw heart iterations
for(var i =0; i < iterations; i++){ // sizes decrease based on iteration number
textSize(2*(iterations - i));strokeWeight(.2*(iterations - i));heartPoints(bigScale - i * smallScale, xScale, yScale);}pop();}functionheartPoints(s, xS, yS){ // from http://mathworld.wolfram.com/HeartCurve.html
// x = 16sin^3(t)
// y = 13cos(t) - 5cos(2t) - 2cos(3t)- cos(4t)
var x;var y; // grab x and y coords for pointNum amount of points
for(var j =0; j < pointNum; j++){var t =map(j,0, pointNum,0, TWO_PI); // calculate x and y of asterisks
x = xS * s *(16*pow(sin(t),3));
y = yS * s *(13*cos(t)-5*cos(2* t)-2*cos(3* t)-cos(4* t)); // place a unicode heart at the point, counter-rotate it
push();translate(x, y);rotate(-rotAngle);text("♥",0,0);pop();}}
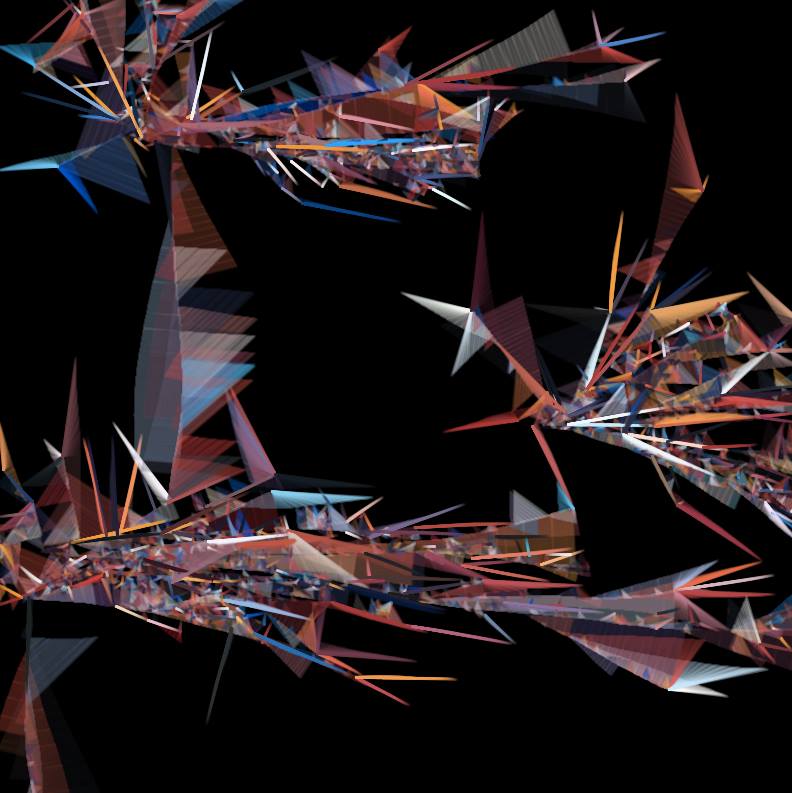
“Fireworks” by Lane Lawly, is an interesting piece, partially out of the composition. and partially because on its page, there’s a github link to the source code. I definitely do appreciate the piece for its composition, there’s a good mix of color and the hierarchy’s certainly something to look at; the shapes are arranged in a dynamic fashion, but it’s not often that you see an open-source artwork.
Looking at the source code, it looks like it’s made with Processing, which is similar with the P5js we’re working with currently. In fact, I can see where it uses random floats and uses those to make “Crackers”.
Looking at his other works, Lane makes a lot of art that resembles tree-like structures. I likely wouldn’t be able to see it in the code if I looked for it, but I bargain that it’s a choice in how the numbers are positioned and iterated on.
// Kevin Thies
// kthies@andrew.cmu.edu
// Section C
// Abstrack Clock
var HDEG =360/24; // constants define ration of how many degrees
var MDEG =360/60; // around a circle per unit
var SDEG =360/60;var MSDEG =360/1000;var hDim =50; // define the dimension of each planetoid
var mDim =25;var sDim =12;var msDim =6;var starNum =70; // how many stars are in the background
var starX =[]; // empty arrays to etermine their size and position
var starY =[]; // an how often they twinkle
var starSize =[];var tick =[];functionsetup(){createCanvas(480,480);
// fill empty arrays with location and size data
for(var stars =0; stars < starNum; stars++){
starX.push(random(10,470));
starY.push(random(10,470));
starSize.push(random(3,7));
tick.push(round(random(0,10)));}}functiondraw(){angleMode(DEGREES); // this makes things easier for later
background(20);push(); // add a new tick value for each star, if tick is randomly 0, twinkle
for(var stars =0; stars < starNum; stars++){
tick.shift(1);
tick.push(round(random(0,10)));if(tick[stars]==0){
starSize[stars]=random(3,7);} // place stars
fill(70);ellipse(starX[stars], starY[stars], starSize[stars], starSize[stars]);}
//==================== Hours ==============================================
translate(240,240); // moving origin to center of screen
rotate(HDEG *hour());stroke(50,0,0);strokeWeight(3);noFill();line(0,0,0,120); // make the hour hand
ellipse(0,0,240,240); // make the orbit
noStroke();fill("orange");
ellipse (0,0, hDim, hDim); // make the hour planetoid
//==================== Minutes ============================================
translate(0,120); // moving origin to end of hour hand
rotate(MDEG *minute());stroke(50,0,0);strokeWeight(3);noFill();line(0,0,0,50); // make the minute hand
ellipse(0,0,100,100); // make the orbit
noStroke();fill("lightBlue");
ellipse (0,0, mDim, mDim); // make the minute planetoid
//==================== Seconds ============================================
translate(0,50); // moving origin to end of minute hand
rotate(SDEG *second());stroke(50,0,0);strokeWeight(3);noFill();line(0,0,0,20); // make the second hand
ellipse(0,0,40,40); // make the orbit
noStroke();fill("mediumAquamarine");
ellipse (0,0, sDim, sDim); // make the second planetoid
//==================== Milliseconds =======================================
translate(0,20); // moving origin to end of second hand
rotate(MSDEG *millis());stroke(50,0,0);strokeWeight(3);noFill();line(0,0,0,10); // make the millisecond hand
ellipse(0,0,20,20); // make the orbit
noStroke();fill("fireBrick");
ellipse (0,0, msDim, msDim); // make the millisecond planetoid
// add a little dot on the end of that hand
translate(0,10);fill("khaki");ellipse(0,0,4,4);pop();}
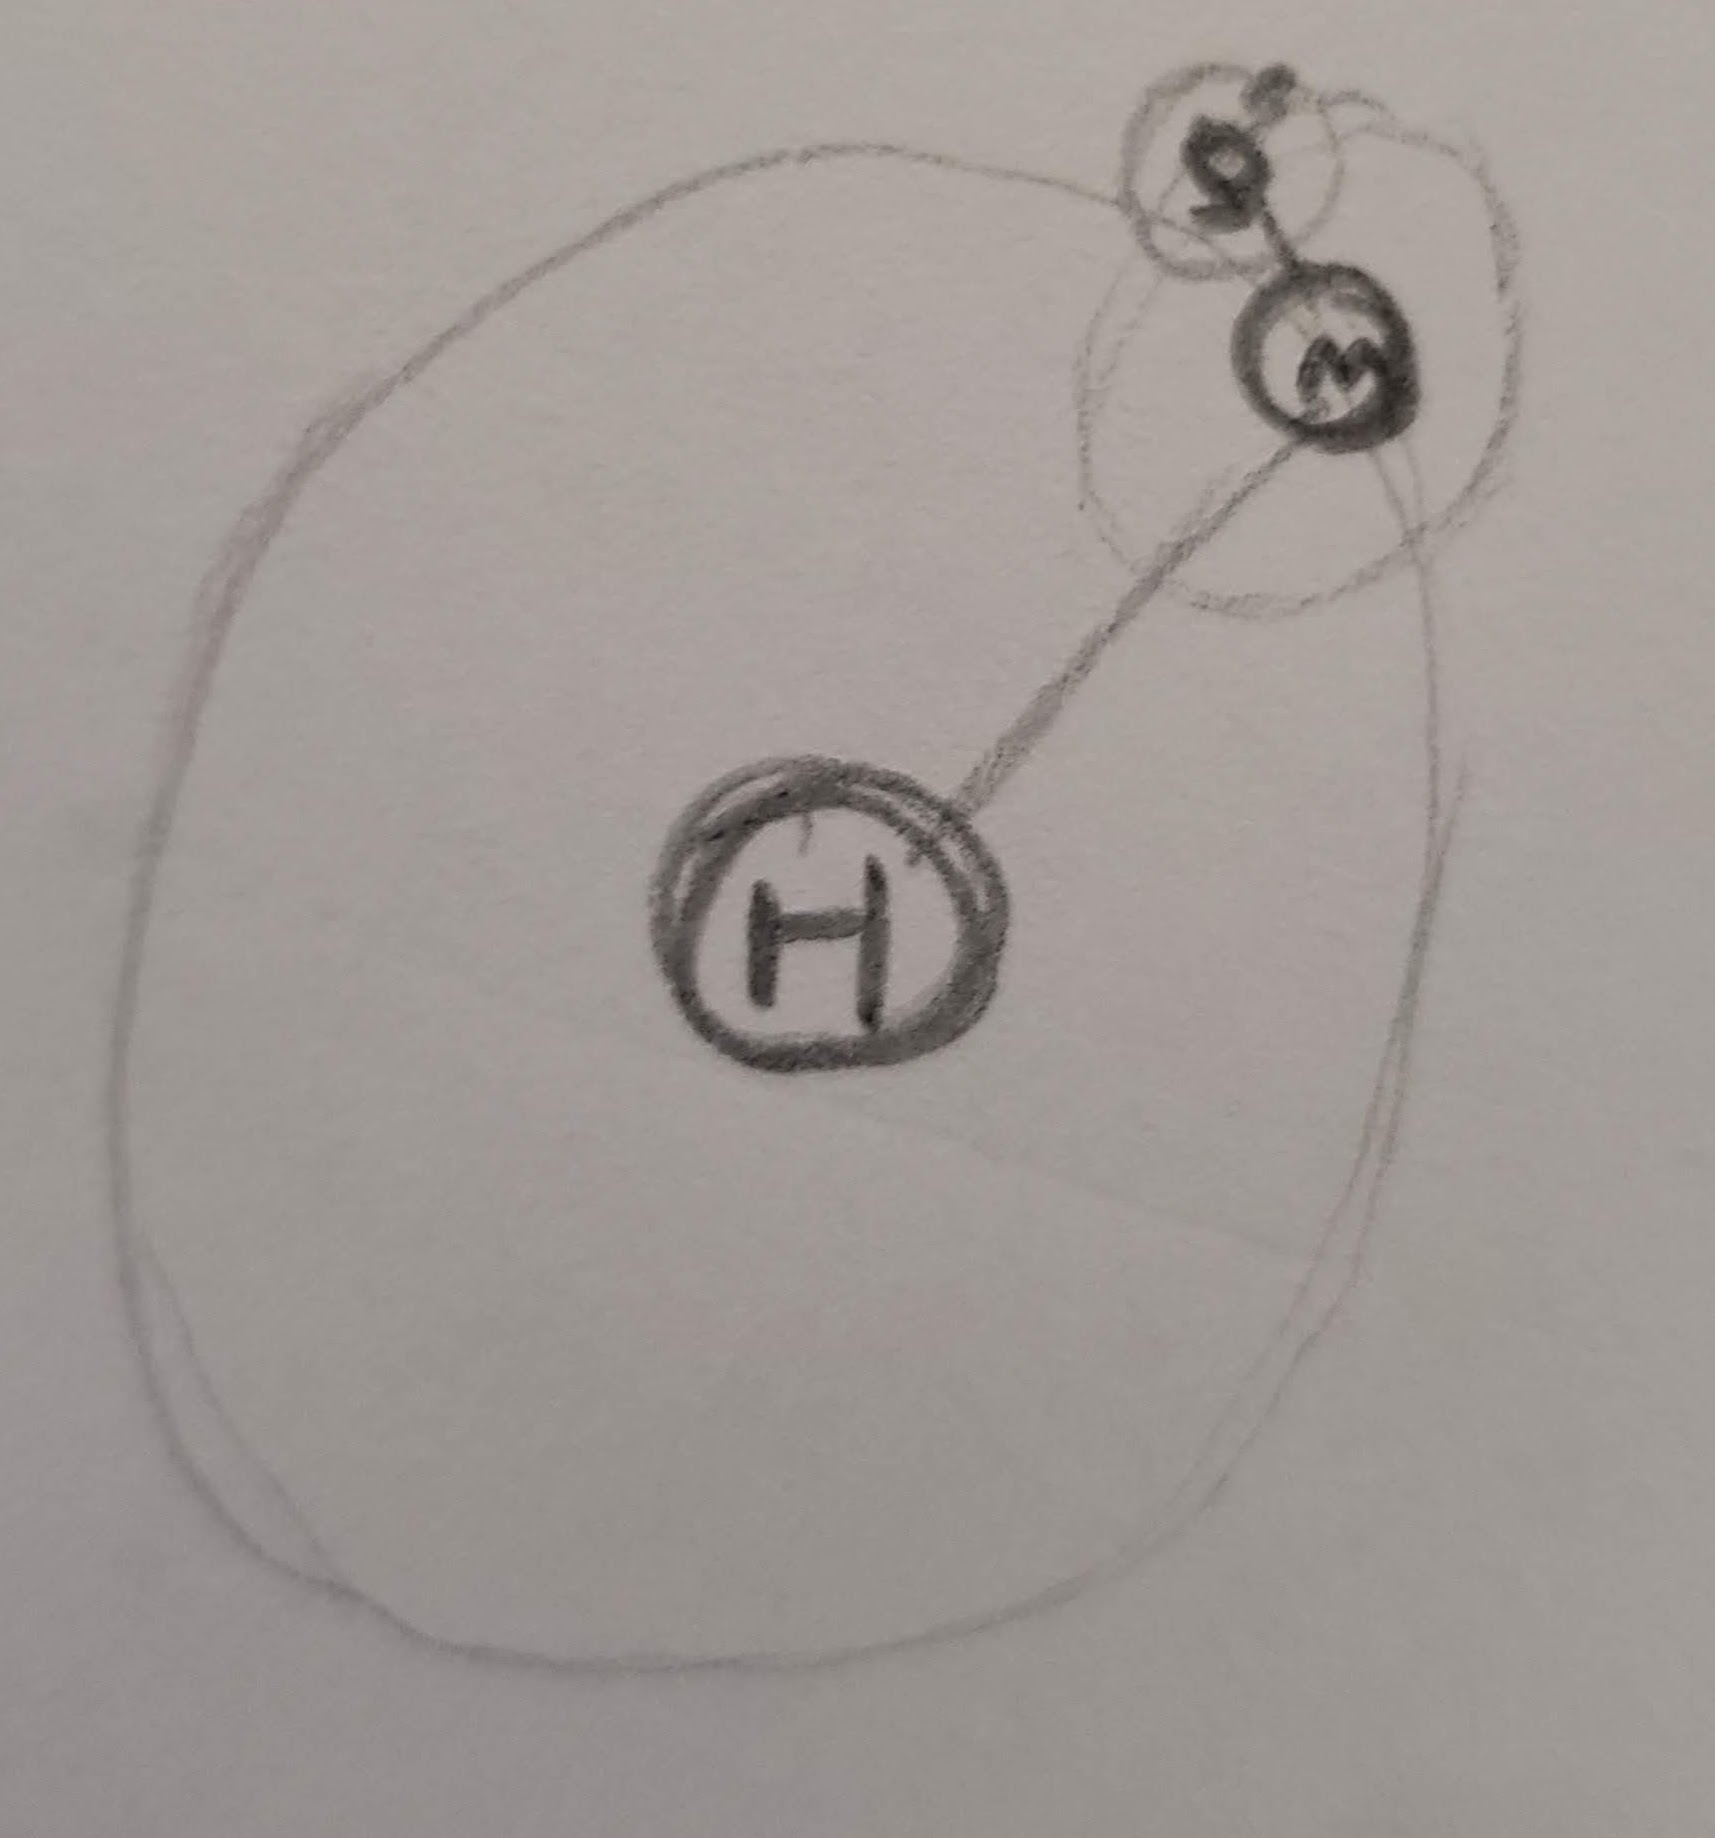
Orbit clocks are cool with their circles inside circles, but they’re easy to read and overdone, so I made a clock where each unit orbits the next highest one. The centermost one is hours, orbited by minutes, orbited by seconds, orbited by milliseconds.
It was quite a challenge putting this together, as some arrays were being really finnicky, so even though the hours, minutes, seconds, and milliseconds could have been one operation on an array, I had to brute-force it. However, what would a space-y clock be without some twinkling stars!
As far as clocks go, I like how this ended up looking, even though it would take more effort than I’d be willing to put in to read.
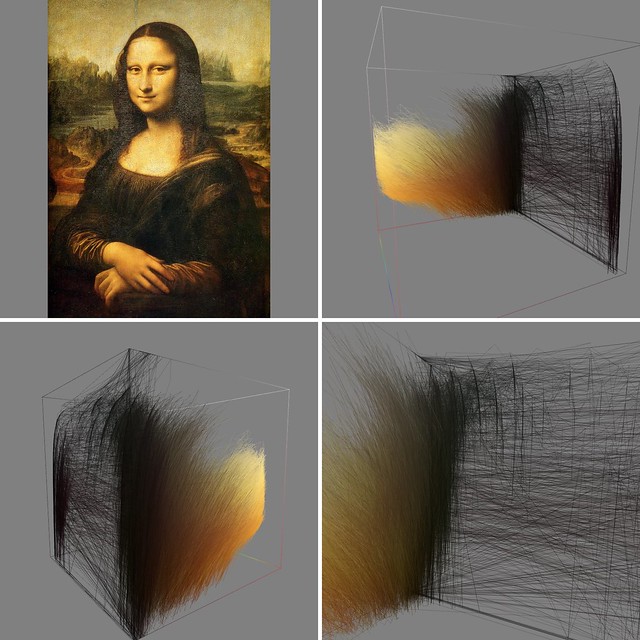
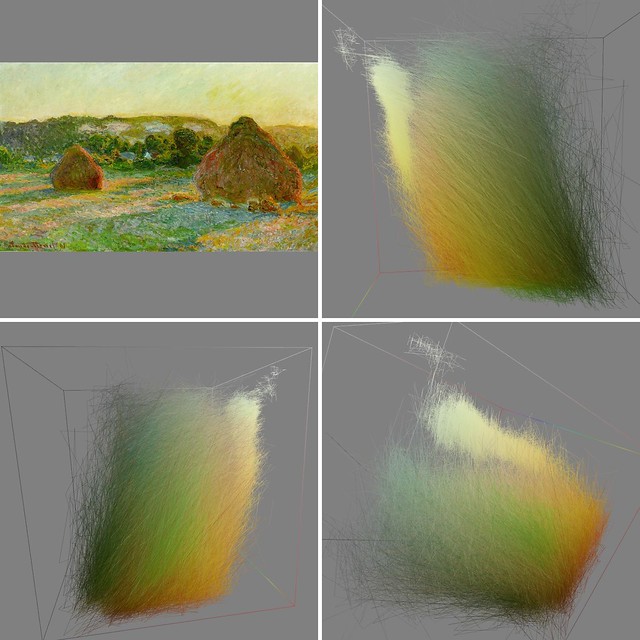
Walking in Color Space is a series of data visualizations by Leonardo Solaas produced in 2010. The data represented takes pixel rows and draws a line between the two points in HSB color space. More contrast means the resulting line will be longer, and more visible. It also highlights the colors the artists used. Images were generated using Processing, but unfortunately the blog describing the process has been taken down.
The models themselves become dynamic furry masses, and I appreciate that the artist took a new look at old pieces as well as newer ones. It’s the kind of data where you could take a guess and just figure it out by eye, but because the level of detail is so fine, it just makes it more interesting. By virtue of its digital nature, it could be possible to either move interaction with the pieces to a fully digital landscape, like being able to hold them in your hands in virtual reality, or they could theoretically be translated to the physical realm via 3 printing, although that would be one delicate print.
// Kevin Thies
// kthies@andrew.cmu.edu
// Section C
// Project 05 - Sellout Wallpaper
// For reference, my 'brand' is Thies Arch, maybe Thies Art one day.
// my logo is a stylized TA. when TA is referenced in the code, it refers to
// the little TA logos, which can be thought of as a rectangle with corners
// and a center.
var d; // physical spacing between TAs in pixels
var TAXSpacing; // x distance from centers of TAs
var TAYSpacing; // y distance from centers of TAs
var TAXSCALE; // proportion of width to height
var TAYSCALE; // 1, establish TA proportions
var SCALE; // SCALE value, proportions are multiplied by this
var TAx; // width of TA
var TAy; // height of TA
var rotation =0; // rotates every other TA
var colR; // R value of gradient
var colG; // G value of gradient
var colB; // B value of gradient
var toggle =1; // toggles between designs
functionsetup(){ // basic style setup
createCanvas(480,480);background(0);angleMode(DEGREES);strokeWeight(1.5); // establish proportions of TAs and spacing
TAYSCALE =1;
TAXSCALE =0.58;
SCALE =40;
d = SCALE/5; // width/height is equal to width/height proportions * SCALE
TAx = TAXSCALE * SCALE;
TAy = TAYSCALE * SCALE; // spacing is equal to TA size * SCALE + d
TAXSpacing = TAx + d;
TAYSpacing = TAy + d;}functiondraw(){ // set up a basic grid of proportioned TAs TAXSpacing
// and TAYSpacing apart from each other
// columns of grid
for(var y =0; y < height; y += TAYSpacing){
rotation ++; // each row should progress a gradient, top being gray, bottom being beige
// these ensure an even transition
colR =map(y,60, height -60,135,174);
colG =map(y,60, height -60,135,166);
colB =map(y,60, height -60,135,128);stroke(colR, colG, colB); // rows of grid
for(var x =0; x < width; x += TAXSpacing ){
rotation ++; // every other TA rotates 180 degrees
// move origin to the top right corner of each TA
push()translate(x, y);if(rotation %2===0){rotate(180);drawTA(-TAx,-TAy);}else{drawTA(0,0);}print(rotation);pop();}}noLoop();}
// given top left coords of TA, draw TA to scale and maintain proportions
functiondrawTA(x, y){if(toggle %2===0){stroke(174,166,128);} // T - |
line( x, y,
x, y + TAy); // T - --
line( x, y,
x +(0.44* SCALE), y);if(toggle %2===0){stroke(135);} // A - |
line( x + TAx, y,
x + TAx, y + TAy); // A - /
line( x + TAx, y,
x +(.12* SCALE), y + TAy) // A - -
line( x +(.35* SCALE), y +(.75* SCALE),
x +(.47* SCALE), y +(.75* SCALE));}
// I ended up doing some variations with fixed colors,
// so clicking on the canvas will toggle between designs
functionmousePressed(){
rotation =0;background(0);
toggle ++;redraw();}
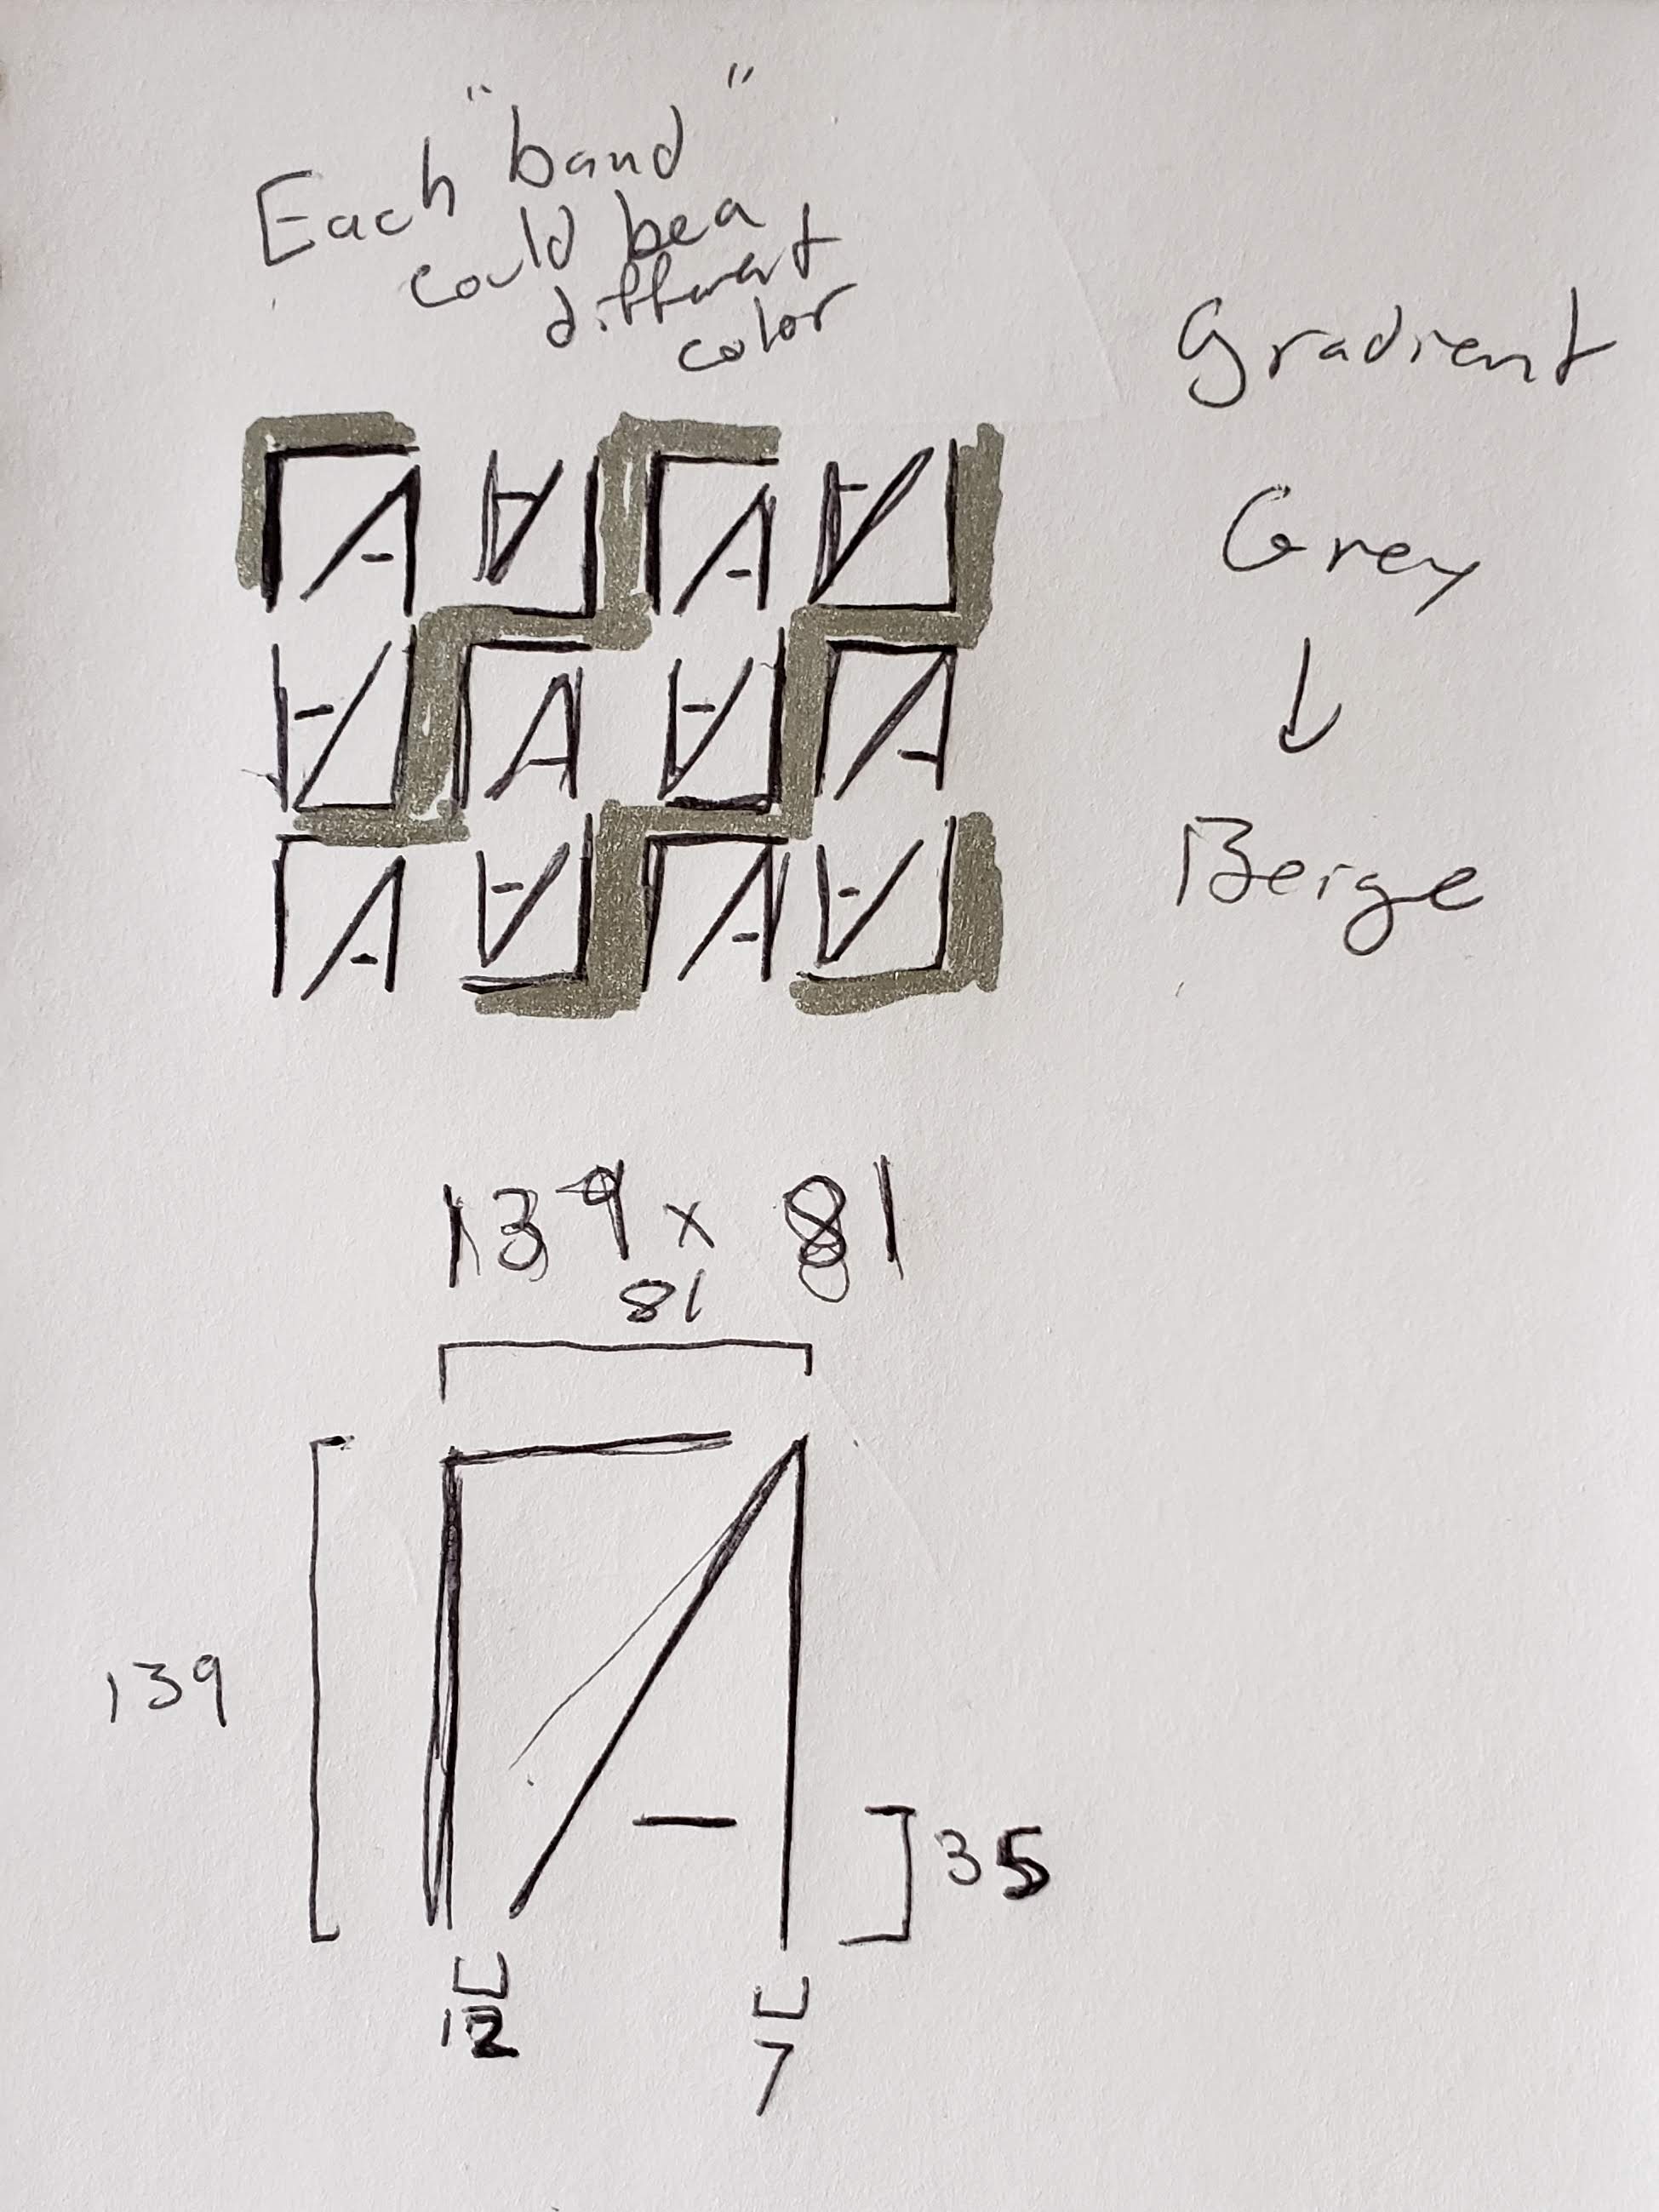
My early idea in a sketch
As of today, I’m a sellout to my own brand.
For context, I have a “brand” called ThiesArch, and I have a logo for it. Influenced a little by designer fabrics like Louis Vuitton and Gucci, and with a desire to spice up my portfolio website, I decided to go the route of a simple wallpaper made up of a tiled logo, so that at a distance it doesn’t look like much more than some lines and a gradient, but up close you could make out the logos. It’s all based off the proportions of the logo, so I could just change the scale value to make it look more or less legible. It would be cool to print fabric with this design, with the gradient accounting for the length, and make like a “branded company T-shirt” (it’d be just me).
It actually wasn’t as hard as I thought it would be to get the relative positions of the lines, since there are only five. It’s just tedious to make sure the proportions are correct.
Also if you click the sketch, I did one where the Ts and As form stripes, but that’s only legible on larger scales.
// Kevin Thies
// kthies@andrew.cmu.edu
// Section C
// Project 04 - String Art -
// not a web generator :'(
// just a parametric flower
var lerps; // how many iterative lerp points on lines
var lerpStep =.1;var sides =6; // polygon of n sides
var x; // x coordinate of exterior axis
var y; // y coorinate of exterior axis
var lerpX; // lerp on x axis
var lerpY; // lerp on y axis
var radius; // shortcut for the radius of polygon
functionsetup(){ // basic setup stuff
angleMode (DEGREES);
createCanvas (300,400);
background (140); // defining variable that depend on p5js
radius = width/2-20; // there's that shortcut
lerps =1/ lerpStep; // here's the amount of lerps on the lines
}functiondraw(){ // put origin in center of canvas
translate (width/2, height/2); //have a for loop that rotates petals
for(var i =0; i < sides; i ++){ // have a for loop that draws one half of a petal
for(var j =0; j < lerps; j ++){ // law of sines calculation for the axis that makes up exterior lines
var HYPOTENUSE = radius /sin(90);
x = HYPOTENUSE *sin(90-(360/ sides));
y = HYPOTENUSE *sin(360/ sides); //get lerp values on new axis
lerpX = lerp (x, radius, lerpStep * j);
lerpY =1- lerp (y,0, lerpStep * j); // connect the points on the lines
line (radius - radius * lerpStep * j,0, lerpX,- lerpY); //This here is just the same as the above except flipped //
push(); //
scale(1,-1); //
//
// law of sines calculation for next line //
var HYPOTENUSE = radius /sin(90); //
x = HYPOTENUSE *sin(90-(360/ sides)); //
y = HYPOTENUSE *sin(360/ sides); //
//
//get lerp values on new axis //
lerpX = lerp (x, radius, lerpStep * j); //
lerpY =1- lerp (y,0, lerpStep * j); //
//
// connect the points on the lines //
line (radius - radius * lerpStep * j,0, lerpX,- lerpY); //
pop(); //
} //rotate the full petal around to make a polygon
rotate (360/sides);}}
// number of sides changes based on scrolled direction
functionmouseWheel(){ // cover all that was just drawn
background(140); // on scroll, change number of splines but don't take it as input
sides += event.delta/50;returnfalse;}
This was a tough project, mostly because I had to go back and partially re-learn trigonometry. That being said I started by making a parametric spider web generator, but that didn’t fit the guidelines nearly well enough. So I took a lot of what I’d learned and wrote for that and turned it into this. Also, shoutout to the Law of Sines, you’re my hero. Maybe one day I’ll be able to break out the web generator, but until then, here’s a parametric flower.
A MaxMSP patch that turns weather data into music – January 2016
I’ve looked at weather data before as a part of site analysis. I can’t see the connection to this.
Algorithmic Composition is, as the username suggests, an algorithmic composer. Since 2009, they’ve been blogging and posting tutorials on just that. They made the MaxMSP (Max being a visual programming language focused on media) patch above that translates weather data into sound. What’s impressive to me is how much more it does; the patch has options for changing instruments, octaves, pitch, and tempo for the four tracks that can be mixed. As a result, it can do so much with just a single data set, although just by listening to it I can’t see how someone could trace it back to its origins.
Algorithmic Composition says
“You don’t have to be a programmer to make algorithmic music, just an interest in creating music in new ways”
and I think that shows through in their work. It’s making music in a new way.
var deg =0; // Degrees to Rotate
var x =0; // Offset from origin
var r =255; // Rgb Code
var b =0; // rgB Code
var dim =10; // Circle Dimension
functionsetup(){createCanvas(640,480);}functiondraw(){angleMode(DEGREES); // This makes things easier for later
background(220,220,220,90);push();fill(r,0, b); // changes fill color as mouse moves
noStroke();translate(320,240); // moving origin to center of screen
rotate(-deg); // 6 Counter Clockwise circles
ellipse (0+ x,0, dim, dim);rotate(60);
ellipse (0+ x,0, dim, dim);rotate(60);
ellipse (0+ x,0, dim, dim);rotate(60);
ellipse (0+ x,0, dim, dim);rotate(60);
ellipse (0+ x,0, dim, dim);rotate(60);
ellipse (0+ x,0, dim, dim);rotate(deg *2); // 6 Clockwise Circles
ellipse (0+ x,0, dim, dim);rotate(-60);
ellipse (0+ x,0, dim, dim);rotate(-60);
ellipse (0+ x,0, dim, dim);rotate(-60);
ellipse (0+ x,0, dim, dim);rotate(-60);
ellipse (0+ x,0, dim, dim);rotate(-60);
ellipse (0+ x,0, dim, dim);rotate(-60);
ellipse (0+ x,0, dim, dim);pop();/* As mouseX Increases, make the circles
- Rotate CW and CCW
- Move further away from origin
- Change Color
- Grow larger
All of these don't want to go completely offscreen
255 is a convienient number as it's used for standard rgb
To make something change slower, mouseX needed to be
ivided by a larger numbers
*/
deg = constrain (mouseX/3,10,255);
x = constrain (mouseX/3,10,255);
r = constrain (mouseX/3,10,255);
b = constrain (mouseX/3,10,255);
dim = constrain (mouseX/6,10,50);}
I really liked the image shown on the project page, and it made me think about loading icons. We’d just covered a lot of rotation, and a lot of loading icons are rotations, so I just followed those ideas and took a stab at it.
Interior Render of the Morpheus at the City of Dreams Macau by ZHA
The Morpheus Hotel at the City of Dreams resort in Macau, China, was started in 2013 and finished earlier this year by Zaha Hadid Architects. It’s impressive seeing something so crazy and so obviously designed on a screen come to life. All of those slightly different pieces was fabricated and put into its very specific place. The project was likely made with a combination of Maya and Gehry Technology’s Digital Project modeling software, as director Patrik Schumacher released in an 2014 interview that those were what the company was using at the time. ZHA is well known for their use of parametric design, and this project is just taking that and heavily applying it to the overall facade and structure. Scale-wise that means there’s a lot of almost identical parts that each had to be custom made, something the 1.1 billion-dollar budget reflects.
![[OLD FALL 2018] 15-104 • Introduction to Computing for Creative Practice](../../../../wp-content/uploads/2020/08/stop-banner.png)