![[OLD FALL 2018] 15-104 • Introduction to Computing for Creative Practice](../../wp-content/uploads/2020/08/stop-banner.png)
//position of ball
var px = 100;
var py = 100;
var yvel = 4;
var ox = 400;
var bs = 30;
var r = 100;
var rx = 200;
var count = 0;
var score = 0;
var hscore = 0;
var obspeed = 2;
var terrainSpeed = 0.0005;
var terrainDetail = 0.005;
var terrainSpeed2 = 0.0002;
var terrainDetail2 = 0.002;
function preload() {
mySnd = loadSound("boing.wav");
mySnd.setVolume(0.5);
}
// to play the sound from within draw() or anywhere:
function setup(){
createCanvas(400, 400);
frameRate(30);
}
function draw(){
background(255);
py -= yvel;
yvel -= 0.3;
for (var x = 0; x < width; x++) {
stroke(243, 184, 141);
var t = (x * terrainDetail) + (millis() * terrainSpeed);
var y = map(noise(t), 0,1, 0, height);
line(x, y, x, height);
stroke(143, 61, 75);
var t2 = (x * terrainDetail2) + (millis() * terrainSpeed2);
var y2 = map(noise(t2), 0,1, 0, height);
line(x, y2 + (y2 / 2), x, height);
}
noStroke();
fill(74, 47, 72);
ellipse(px, py, bs, bs);
fill(43, 29, 66);
if(ox > 0){
rect(ox, 0, 10, r);
rect(ox, height - rx, 10, rx);
ox -= obspeed;
}
else if(ox <= 0){
r = random(0, 200);
rx = 300 - r;
ox = 400;
score++;
count++;
if (count % 5 === 0){
obspeed += 1;
}
}
intersect();
fill(0);
textSize(12);
text("Score: " + score, 10, 10);
}
function mousePressed(){
mySnd.play();
yvel = 6;
}
function intersect(){
if(py - (bs / 2) < r || py + (bs / 2) > height - rx ){
if(px < ox + 10 & px > ox - 10){
if(score > hscore){
hscore = score;
score = 0;
}
noLoop();
textSize(18);
text("You Lost :(", 300, 20);
text("Score: " + hscore, 300, 50);
text("Play Again!", 300, 80);
}
}
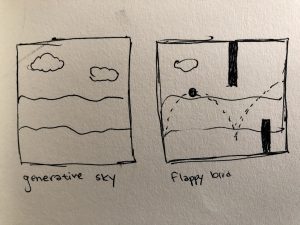
}For this project, I wanted to create a game that would have a level of difficulty as time progressed. This game is a classic spinoff of the popular game flappy bird – a sphere that bounces every time you click the mouse. Your job is to make sure your sphere doesn’t hit any of the obstacles that move along the screen. In order to get the boing sound every time the ball bounces, download the zip file with all the files!