Xiaoying Meng – Project 07 Curves

sketch

//Xiaoying Meng
//xiaoyinm@andrew.cmu.edu
//Project 7
function setup(){
    createCanvas(480,480);
    frameRate(10);
}

function draw(){
    background(220);
//top curve
    push();
    translate(width/3,height/3);
    rotate(PI - mouseY/40);
    drawCurve();
    pop();
//middle curve
    push();
    translate(width/2,height/2);
    rotate(PI + mouseY/40);
    drawCurve2();
    pop();
//bottom curve
    push();
    translate(width- width/3, height- height/3);
    rotate(PI - mouseY/40);
    drawCurve3();
    pop();

   
}

//regular Crv
function drawCurve(){
    var nPoints = 200;
    var a = (mouseX-100)/3*2;
    var b = (mouseY-100)/3*2;
    fill(0);
    noStroke();
    beginShape();
    for (var i=0; i < nPoints; i++ ){
        var angle = map ( i, 0, mouseX, 0, 2*PI);
        var x = a* (1/cos(angle));
        var y = b * tan(angle);
        vertex(x,y);
    }
    endShape();
}

//wiggly Crv
function drawCurve2(){
    var nPoints = 200;
    var a = (mouseX-100)/3*2;
    var b = (mouseY-100)/3*2;
    fill(255);
    noStroke();
    beginShape();
    for (var i=0; i < nPoints; i++ ){
        var angle = map ( i, 0, mouseX, 0, 2*PI);
        var x = a* (1/cos(angle));
        var y = b * tan(angle);
        vertex(x + random(-5,5),y + random(-5,5));
    }
    endShape();
}
//dotted Crv
function drawCurve3(){
    var nPoints = 200;
    var a = (mouseX-100)/3*2;
    var b = (mouseY-100)/3*2;
    fill(150);
    noStroke();
    beginShape();
    for (var i=0; i < nPoints; i++ ){
        var angle = map ( i, 0, mouseX, 0, 2*PI);
        var x = a* (1/cos(angle));
        var y = b * tan(angle);
        ellipse(x, y, 10, 10);
    }
    endShape();
}


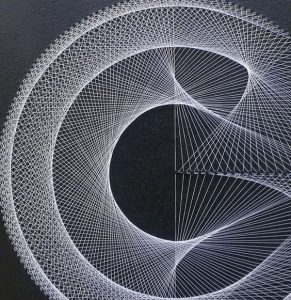
I chose hyperbola curves. I created three different type of representation of the curves as surfaces and lines. By rotating them to different directions, interesting abstract composition start to occur.

Xiaoying Meng -Looking Outwards 07

(Visualization for Amersterdam SMS messages on New Year’s Eve)

This is a visualization for Amersterdam SMS messages data on New Year’s Eve created by Aaron Koblin. The data is visualized by representing each message with a colored dot vertically on a map. The dataset creates city-like animations.  Interestingly, the vertical tubes go up and down together almost like music beats. The colored dots are denser at certain areas and closer at others, like population. And at 00:00 on New Year’s Eve, the number of data reaches ultimate high. The artist used P5js and OpenGL for the visualization. I appreciate this visualization because it makes the data a lot easier to understand for the viewers.  I guess the artist could be using algorithms such as using one colored dot to represent one message sent, locating them geographically on a map.


Xiaoying Meng – Project 6 Abstract Clock

sketch

//xiaoying meng
//B
//xiaoyinm@andrew.cmu.edu
//Project6
var prevSec;
var millisRolloverTime;

function setup() {
    createCanvas(480, 480);
    millisRolloverTime = 0;
}

function draw() {
    background(0); 

    var H = hour();
    var M = minute();
    var S = second();
    
    if (prevSec != S) {
        millisRolloverTime = millis();
    }
    prevSec = S;
    var mils = floor(millis() - millisRolloverTime);
    
    var hourBarWidth   = map(H, 0, 23, 0, width);
    var minuteBarWidth = map(M, 0, 59, 0, width);
    var secondBarWidth = map(S, 0, 59, 0, width);
    angleMode(DEGREES);
    stroke(0);

//hour
    push();
    translate(240,20);
    rotate(hourBarWidth);
    rect(0,0,250,250);
    pop();

//minute
    push();
//vertical left
    stroke(255);
    strokeWeight(5);
    translate(0,minuteBarWidth);
    line(125,155,125,270);
    line(135,155,135,270);
    line(145,155,145,270);
    line(155,155,155,270);
    line(165,155,165,270);
    line(175,155,175,270);
    line(185,155,185,270);
//horizontal
    strokeWeight(2);
    line(190,255,350,255);
    line(190,260,350,260);
    line(190,265,350,265);
    line(190,270,350,270);
//vertical right
    strokeWeight(3);
    line(295,155,295,250);
    line(305,155,305,250);
    line(315,155,315,250);
    line(325,155,325,250);
    line(335,155,335,250);
    line(345,155,345,250);
    pop();    

    push();
    fill(205,49,27);
    translate(0,minuteBarWidth);
    rect(190,0,100,250);
    pop();

//second
    push();
//circle
    fill(0);
    translate(secondBarWidth,secondBarWidth);
    arc(0,0,150,150,120,300);
    fill(255);
    arc(0,0,150,150,300,120);
    pop(); 
//lines
    push();
    translate(secondBarWidth,secondBarWidth);
    rotate(-105);
    stroke(255);

    line(-480,-480,480,480);
    pop();

    push();
    translate(secondBarWidth,secondBarWidth);
    rotate(50);
    stroke(255);
    line(-480,-480,480,480);
    pop();
}


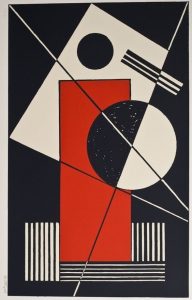
I decided to use abstract art as my idea for the abstract clock. As time passes, each shape representing second, minute and hour changes locations. Thus, creating, different compositions.

Xiaoying Meng-Looking Outwards 06

(Black Shoals Stock Market Planetarium)

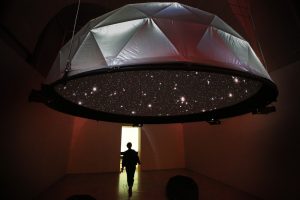
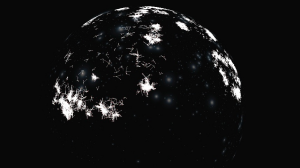
Black Shoals is an art project by Joshua Portway and Lise Autogena. The project displays the activities of the stock market as a planetarium. The project uses randomness in a very interesting way. In the beginning, the stars representing each company are randomly distributed. As time passes, the stars start to drift and clog together, moving into constellations. Without the random placement of the stars at the beginning, the relationship and attraction between each star cannot be shown in this way. I admire this project because it turns numeric data of the stock exchange into visually pleasing graphics that can be better understood. I guess the algorithm for this project could be inputting real-time data into graphics and use randomized locations for the beginning.


Xiaoying Meng- Project 05 Wallpaper

sketch

var tw=17;
var th=25;
function setup() {
    createCanvas(600, 300);
    background(218,235,209);
}

function draw() {
    //background
    for (var z=5; z<600; z=z+25){
        for(var b=2; b< 300; b= b+20){
                    ellipse(z,b,0.1,0.1);
        }
    }

    for (var x=1; x<7; x++){
        for (var y=1; y<5; y++){

            //pot
            if (x%2===1){
                fill(234,186,195);
            }
            else {
                fill(166,203,221);
            }

            stroke(0);
            strokeWeight(0.5);
            rect(x*tw*5,y*th*2.5,20,23);
            line(x*tw*5,y*th*2.5+5,x*tw*5+20,y*th*2.5+5);

            //plant
            
            fill(61,133,50);
            //middle part
            beginShape();
            curveVertex(x*tw*5+5,y*th*2.5);
            curveVertex(x*tw*5+5,y*th*2.5);
            curveVertex(x*tw*5+5,y*th*2.5-9);
            curveVertex(x*tw*5+10,y*th*2.5-13);
            curveVertex(x*tw*5+15,y*th*2.5-9);
            curveVertex(x*tw*5+15,y*th*2.5);
            curveVertex(x*tw*5+15,y*th*2.5);
            endShape();

            //left part

            beginShape();
            curveVertex(x*tw*5+10,y*th*2.5-13);
            curveVertex(x*tw*5+10,y*th*2.5-13);
            curveVertex(x*tw*5+10,y*th*2.5-20);
            curveVertex(x*tw*5+7,y*th*2.5-25);
            curveVertex(x*tw*5,y*th*2.5-27);
            curveVertex(x*tw*5-5,y*th*2.5-20);
            curveVertex(x*tw*5,y*th*2.5-15);
            curveVertex(x*tw*5+10,y*th*2.5-13);
            curveVertex(x*tw*5+10,y*th*2.5-13);
            endShape();

            //right part
            beginShape();
            curveVertex(x*tw*5+10,y*th*2.5-13);
            curveVertex(x*tw*5+10,y*th*2.5-13);
            curveVertex(x*tw*5+10,y*th*2.5-20);
            curveVertex(x*tw*5+7,y*th*2.5-25);
            curveVertex(x*tw*5,y*th*2.5-27);
            curveVertex(x*tw*5-7,y*th*2.5-25);
            curveVertex(x*tw*5-5,y*th*2.5-20);
            curveVertex(x*tw*5,y*th*2.5-15);
            curveVertex(x*tw*5+10,y*th*2.5-13);
            curveVertex(x*tw*5+10,y*th*2.5-13);
            endShape();

            beginShape();
            curveVertex(x*tw*5+10,y*th*2.5-13);
            curveVertex(x*tw*5+10,y*th*2.5-13);
            curveVertex(x*tw*5+15,y*th*2.5-15);
            curveVertex(x*tw*5+20,y*th*2.5-25);
            curveVertex(x*tw*5+22,y*th*2.5-30);
            curveVertex(x*tw*5+13,y*th*2.5-28);
            curveVertex(x*tw*5+10,y*th*2.5-13);
            curveVertex(x*tw*5+10,y*th*2.5-13);
            endShape();
            // dots

            noFill();
            strokeWeight(1);
            ellipse(x*tw*5,y*th*2.5-25,1,1);
            ellipse(x*tw*5-2,y*th*2.5-20,1,1);
            ellipse(x*tw*5+5,y*th*2.5-17,1,1);
            ellipse(x*tw*5+10,y*th*2.5-9,1,1);
            ellipse(x*tw*5+7,y*th*2.5-3,1,1);
            ellipse(x*tw*5+15,y*th*2.5-7,1,1);
            ellipse(x*tw*5+15,y*th*2.5-20,1,1);
            ellipse(x*tw*5+20,y*th*2.5-27,1,1);


        }
    }

noLoop();
}

I created this wallpaper choosing my favorite plant cactus. I first sketched out the cactus I want to draw. After I finished the code for the plants, I decided to add dots to the background and switching the color for the pots to make it a little more interesting.

Xiaoying Meng- Looking Outwards 05

(Phillips Exeter Academy Library by Alex Roman)

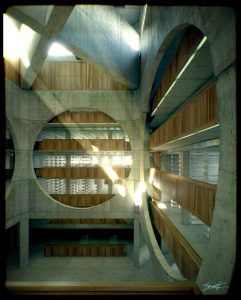
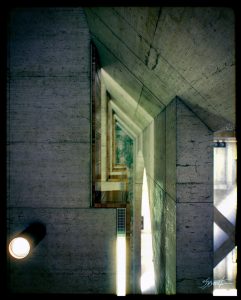
These are two photo-realistic architecture renders made by Alex Roman. Other examples can be found here. The quality of light and texture make the renders look like photos. I admire 3D computer renders such as this one because they make the viewers feel like they are in the space, looking at the building. They emphasize the details of the building, qualities that people might miss. I think the algorithms that rendered the works might be linking color and light intensity together, using different colors to describe the quality of light. The algorithms might also be using the size of pixels to describe the smooth/roughness of materials. The artist can choose to express a specific quality of the building or the vibe he/she wants the viewer to experience.


Xiaoying Meng- Project 04 String Art

sketch

var x1;//x for first circle
var y1;//y for first circle
var x2;//x for second circle
var y2;//y for second circle
var x3;//x for third circle
var y3;//y for third circle
var x4;//x for fourth circle
var y4;//y for fourth circle
var r=50;//radius

function setup(){
    createCanvas(400,300);
    background(200);
}
function draw(){
    angleMode(DEGREES);
    //d is degree of the angle
    //To change color for each quarter of the circle
    for(var d=90;d<=180; d+=2){

        x1=200+r*cos(d);
        y1=150+r*sin(d);
        x2=200+(r+40)*cos(d+50);
        y2=150+(r+40)*sin(d+50);
        x3=200+(r+80)*cos(d+10);
        y3=150+(r+80)*sin(d+10);            
        x4=200+(r+120)*cos(d+50);
        y4=150+(r+120)*sin(d+50);

        //line between 1st and 2nd circle
        strokeWeight(0.03);
        stroke(255);
        line(x2,y2,x1,y1);
        //line between 3rd and 1st, 2nd circle
        line(x2,y2,x3,y3);
        line(x1,y1,x3,y3); 

        //line between 4th circle and 1st, 2nd, 3rd circle
        line(x3,y3,x4,y4);
        line(x2,y2,x4,y4);
        line(x1,y1,x4,y4);        
    }
    for(var d=180;d<=270; d+=2){

        x1=200+r*cos(d);
        y1=150+r*sin(d);
        x2=200+(r+40)*cos(d+50);
        y2=150+(r+40)*sin(d+50);
        x3=200+(r+80)*cos(d+10);
        y3=150+(r+80)*sin(d+10);            
        x4=200+(r+120)*cos(d+50);
        y4=150+(r+120)*sin(d+50);

        //line between 1st and 2nd circle
        strokeWeight(0.03);
        stroke(0);
        line(x2,y2,x1,y1);
        //line between 3rd and 1st, 2nd circle
        line(x2,y2,x3,y3);
        line(x1,y1,x3,y3); 

        //line between 4th circle and 1st, 2nd, 3rd circle
        line(x3,y3,x4,y4);
        line(x2,y2,x4,y4);
        line(x1,y1,x4,y4);        
    }
    for(var d=270;d<=360; d+=2){

        x1=200+r*cos(d);
        y1=150+r*sin(d);
        x2=200+(r+40)*cos(d+50);
        y2=150+(r+40)*sin(d+50);
        x3=200+(r+80)*cos(d+10);
        y3=150+(r+80)*sin(d+10);            
        x4=200+(r+120)*cos(d+50);
        y4=150+(r+120)*sin(d+50);

        //line between 1st and 2nd circle
        strokeWeight(0.03);
        stroke(120);
        line(x2,y2,x1,y1);
        //line between 3rd and 1st, 2nd circle
        line(x2,y2,x3,y3);
        line(x1,y1,x3,y3); 

        //line between 4th circle and 1st, 2nd, 3rd circle
        line(x3,y3,x4,y4);
        line(x2,y2,x4,y4);
        line(x1,y1,x4,y4);        
    }
    for(var d=0;d<=90; d+=2){

        x1=200+r*cos(d);
        y1=150+r*sin(d);
        x2=200+(r+40)*cos(d+50);
        y2=150+(r+40)*sin(d+50);
        x3=200+(r+80)*cos(d+10);
        y3=150+(r+80)*sin(d+10);            
        x4=200+(r+120)*cos(d+50);
        y4=150+(r+120)*sin(d+50);

        //line between 1st and 2nd circle
        strokeWeight(0.03);
        stroke(230);
        line(x2,y2,x1,y1);
        //line between 3rd and 1st, 2nd circle
        line(x2,y2,x3,y3);
        line(x1,y1,x3,y3); 

        //line between 4th circle and 1st, 2nd, 3rd circle
        line(x3,y3,x4,y4);
        line(x2,y2,x4,y4);
        line(x1,y1,x4,y4);        
    }


}

I first saw this image on pinterest. It inspired me to create this string art around a center point in circles. I found out how to find the points on circles and worked my way through.

Xiaoying Meng-Looking Outward 04

(Food and Sound)

This project created by Erika Marthins and ECAL(Bachelor Media & Interaction Design) looks at food and other of our senses using the latest technology. The third proposal, in particular, explores other ways we can experience and “taste” sound. It is a record made of chocolate by Chef Fabien Pairon Ecole hôtelière de lausanne.  The creators try to find the right texture for the chocolate record and the result is very intriguing.  The chocolate completely changed the music recorded in the record. It is a different form of representation of the sound. Because sound is invisible, we cannot touch or taste or smell it. But by combining food and sound, we can now experience sound in other forms of senses. I find this project very inspiring. Using technology to experience sound can expand the dimension of it, making it visible, touchable.

Xiaoying-Looking Outward03

Silk Pavilion is a project created by the MIT media lab. They studied the movements of silkworm and created a pavilion with the paths. This project combined technology with biology. From studying animals around us, we can learn a lot more about nature. And technology such as 3D printing allows us to mimic the behaviors of animal better. The silk pavilion is an amazing piece of architecture because it cannot be built manually. It is created only because of the existence of technology. By combining technology and biology, we can create more amazing pieces of architecture like the silk pavilion. Not only architecture, perhaps clothing, everyday objects, and art. The potential is endless.

Xiaoying Meng-Project-03-Dynamic-Drawing

sketch

var redlineend= -20;
var redlinestart= 0;
var R=[237,247,193,176];
var G=[194,240,204,196];
var B=[200,220,221,177];
var index = 0;
var angle = 0;
var R1=[198,237,159,134];
var G1 =[143,220,173,168];
var B1 =[151,173,196,136];
var a =4;


function setup(){
    createCanvas(640,480);
    background(R[index],G[index],B[index]);
}


function mousePressed(){
    //if click mouse inside canvas
    if (mouseY < height & mouseY >0 && mouseX < width && mouseX > 0 && redlinestart >= 0){
        //in first quater
        if(mouseX < width/2 && mouseY < height/2) {
            //line gap 35
            redlineend = redlineend +35;
            redlinestart = redlinestart + 35;
        } 
        //in second quater
        if (mouseX > width/2 & mouseY < height/2) { 
            //line gap 20
            redlinestart = redlinestart + 20;
            redlineend = redlineend +20;
        }
        //in third quater
        if(mouseX < width/2 & mouseY > height/2) { 
           //line and background color change
            index = index - 1; 
            if (index <= 0 ){
               index = 0;
            }
            // heavier strokeweight 
            a = a+1;
            if (a >= 6 ){
               a = 6;
            }
        }
        //in fourth quater
        if(mouseX > width/2 & mouseY > height/2) { 
            //line and background color change
            index = index + 1; 
            if (index ===4){
               index = 0;
            }
            // lighter strokeweight
            a = a-1
            if ( a <= 1 ){
               a = 1;
            } 
        }
    }
}

function draw(){
    stroke(R1[index],G1[index],B1[index]);
    strokeWeight(a);

    redlineend = redlineend+1;
    redlinestart = redlinestart+1;
   //restart line 
   if (redlineend >= 641){
        redlineend = -20;
        background(R[index],G[index],B[index]);   
        
    }
    if (redlinestart >= 661){
        redlinestart = 0;
        background(R[index],G[index],B[index]);
    }
    //rotating canvas
       push();
       translate(width/2,height/2);
       rotate(radians(angle));
       line(redlineend,height/5,redlinestart,height/5);
       pop();
       angle = angle+15;  
       
}

I created a line drawing controlled by the clicking of the mouse. The mouse can control the following:

1. line gap 35/20 (1st quarter/2nd quarter)
2. color of line and background (3rd quarter/4th quarter)
3. line weight (3rd quarter/4th quarter)