![[OLD FALL 2018] 15-104 • Introduction to Computing for Creative Practice](wp-content/uploads/2020/08/stop-banner.png)
Tilegrams is an open source tool for creating statistically accurate maps. Data-representative tiles are arranged, shuffled, and colour-coordinated to visualize data.
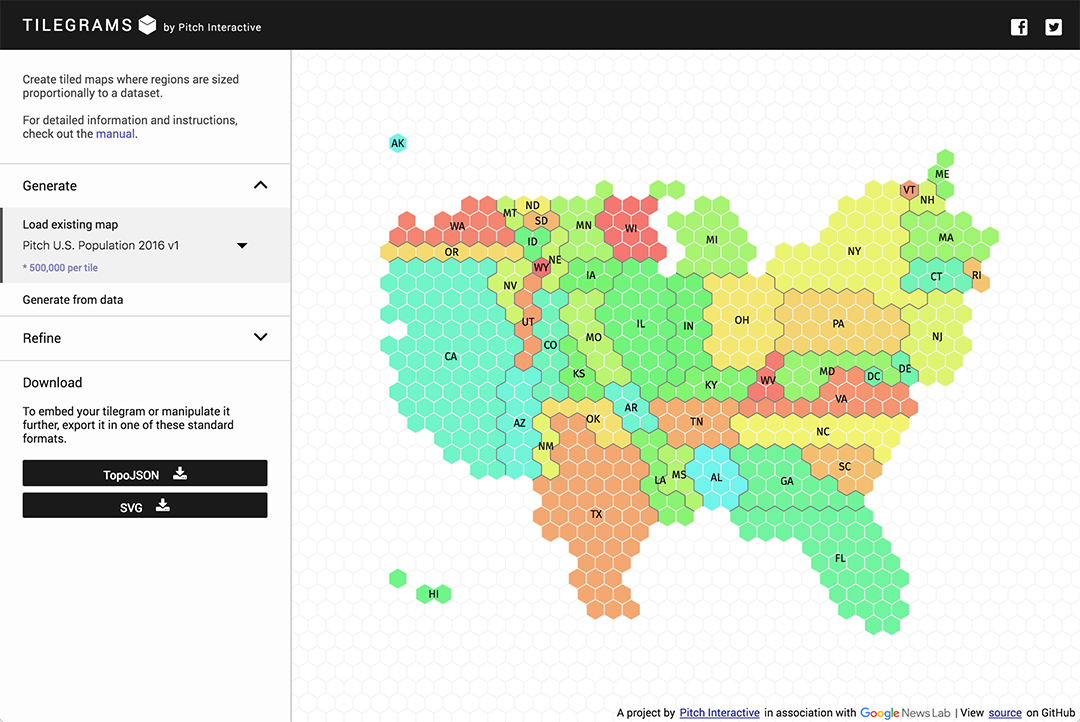
The Pitch Interactive team, led by Wes Grubbs, designed Tilegrams to employ a cartogram algorithm that balances geographic resemblance with statistical accuracy. The tool ingests a state-level dataset in order to output a cartogram which is them sampled to produce the tile elements––which inspired the name “Tilegrams” from tiled cartograms.
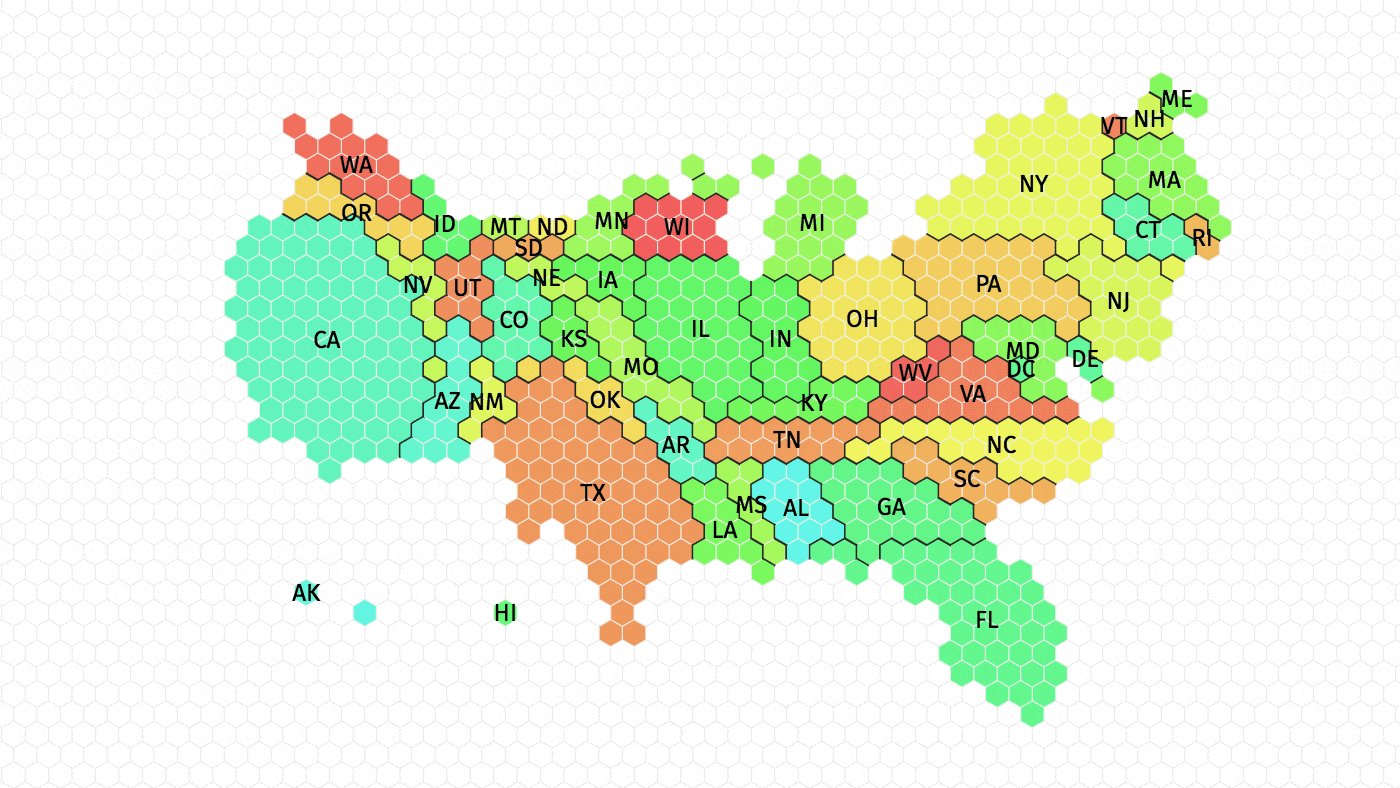
Primary design choices were implemented by the creators, allowing for the maps produced by the tool to remain visually consistent. However, drawing tools including drag to move and marquee selection give users the chance to customize and validate information.
I admire the fact that it can take into account a broad scope of data from all different users and produce attractive visualizations in every scenario. Tilegrams is currently being developed to accept beyond country-wide data with the cooperation of Google News Lab.