/*Vicky Zhou
Section E
vzhou@andrew.cmu.edu
Project_07_Curves*/

var nPoints = 50; //amount of mapped out points
var EPITROCHOID1 = 0; // parametric form
var HYPOTROCHOID = 0; //parametric form

function setup() {
    createCanvas(480, 480);
}

function draw() {
	background(15, 15, 25);
	translate(width/2, height/2);
	//draw light blue epitrochoid curve
	drawEPITROCHOID1();
	//draw light pink hypotrochoid curve
	drawHYPOTROCHOID();
	//draw orange circle epitrochoid curve
	drawEPITROCHOID2();
	//draw yellow circle epitrochoid curve
	drawEPITROCHOID3();
}

function drawEPITROCHOID1() {
	push();
	stroke(140, 200, 240);
	strokeWeight(0.75);
	noFill();
	var x; //x pos
	var y; //y pos
	var t = 90; //angle variable
	var b = constrain(mouseX / 100, 0, 10); //outside curve variable
	var h = map(mouseY, 0, mouseY, 30, height/2); //height variable
	beginShape();
	for (var i = 0; i < nPoints; i ++){
		var a = map(i, 0, nPoints, 0, TWO_PI); //inside circle size variable
		x = (a + b) * cos(t) - h * cos (((a + b) / b) * t); //parametric eq1
		y = (a + b) * sin(t) - h * sin (((a + b) / b) * t); //parametric eq2
		vertex (x + random(0, 2), y + random(0, 2));
	}
	endShape();
	pop();
}

function drawHYPOTROCHOID() {
	push();
	strokeWeight(0.5);
	stroke(190, 140, 140);
	noFill();
	var x; //x pos
	var y; //y pos
	var t = constrain(mouseX / 10, 0, 100); //angle variable
	var b = 5; //outside curve variable
	var h1 = constrain(mouseX/ 2, width/4, width/3); //height variable 1
	var h2 = constrain(mouseY/2, width/3, width/2); //height variable 2
	beginShape();
	for (var i = 0; i < nPoints; i++){
		var a = map(i, 0, nPoints, 0, TWO_PI); //inside circle size variable
		x = (a - b) * cos(t) + h1 * cos(((a - b)/b) * t);
		y = (a - b) * sin(t) + h2 * sin(((a - b)/b) * t);
		vertex(x, y);
	}
	endShape();
	pop();
}

function drawEPITROCHOID2() {
	push();
	noStroke();
	fill(100, 130, 190);
	var x; //x pos
	var y; //y pos
	var t = 100; //angle variable
	var b = constrain(mouseX / 100, 0, 10); //outside curve variable
	var h = constrain(mouseX/2, 0, 100); //height variable
	beginShape();
	for (var i = 0; i < nPoints; i ++){
		var a = map(i, 0, nPoints, 0, TWO_PI); //inside circle size variable
		x = (a + b) * cos(t) - h * cos (((a + b) / b) * t); //parametric eq1
		y = (a + b) * sin(t) - h * sin (((a + b) / b) * t); //parametric eq2
		ellipse(x + random(-1, 1), y + random(-1, 1), 5, 5);
	}
	endShape();
	pop();
}

function drawEPITROCHOID3() {
	push();
	stroke(160, 140, 110);
	strokeWeight(0.3);
	noFill();
	var x; //x pos
	var y; //y pos
	var t = 190; //angle variable
	var b = constrain(mouseX, 0, 5); //outside curve variable
	var h = map(mouseY, 0, mouseY, 30, height/2); //height variable
	beginShape();
	for (var i = 0; i < nPoints; i ++){
		var a = map(i, 0, nPoints, 0, TWO_PI); //inside circle size variable
		x = (a + b) * cos(t) - h * cos (((a + b) / b) * t); //parametric eq1
		y = (a + b) * sin(t) - h * sin (((a + b) / b) * t); //parametric eq2
		vertex(x + random(-5, 5), y + random(-3, 3));
	}
	endShape();
	pop();
}
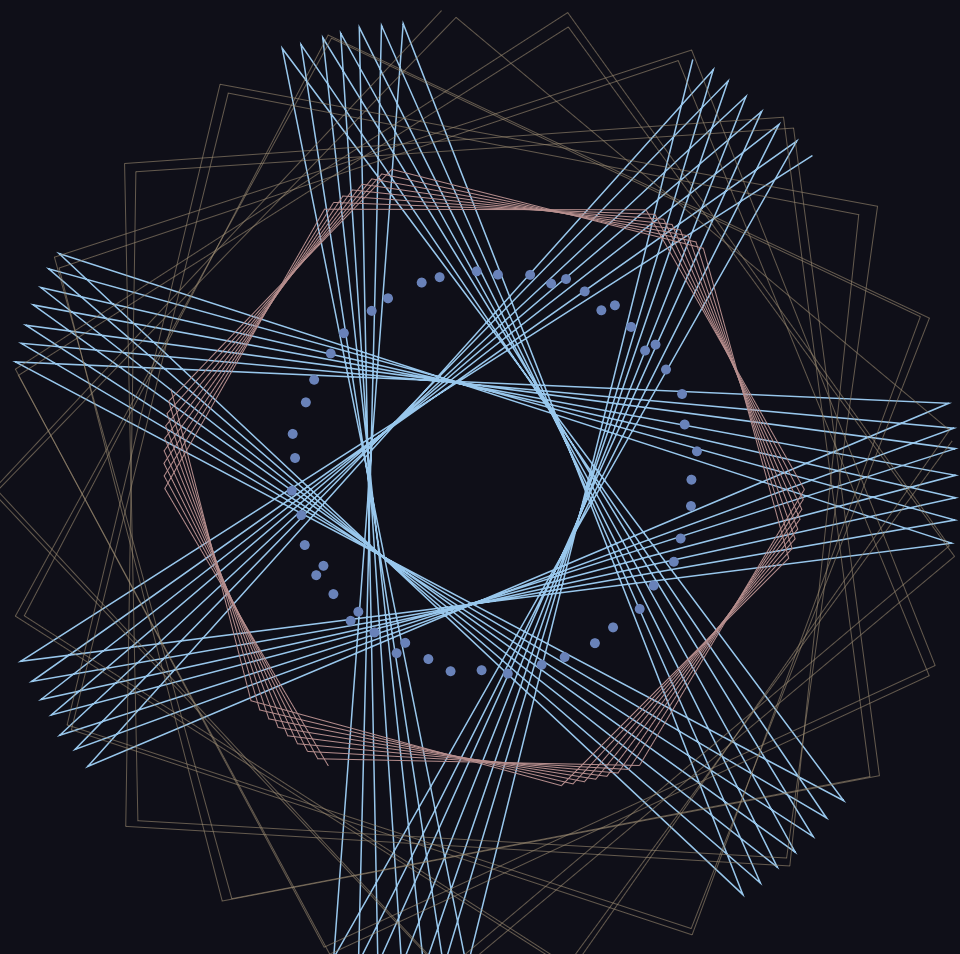
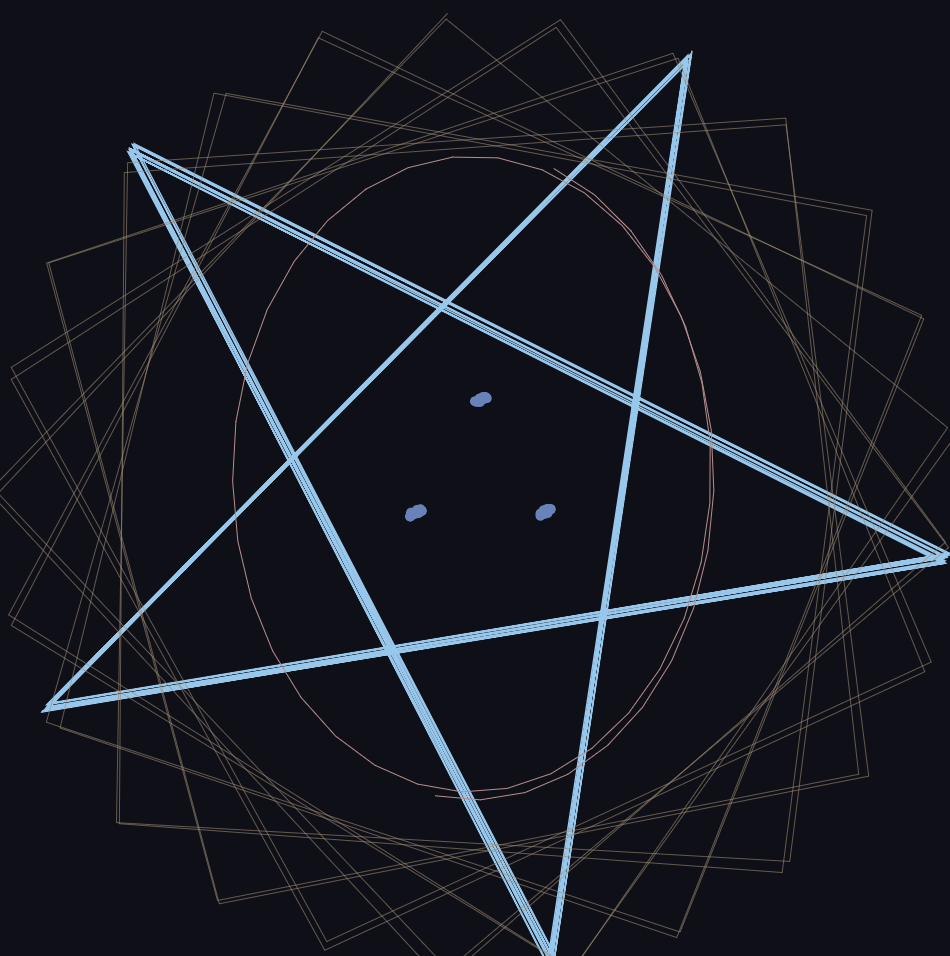
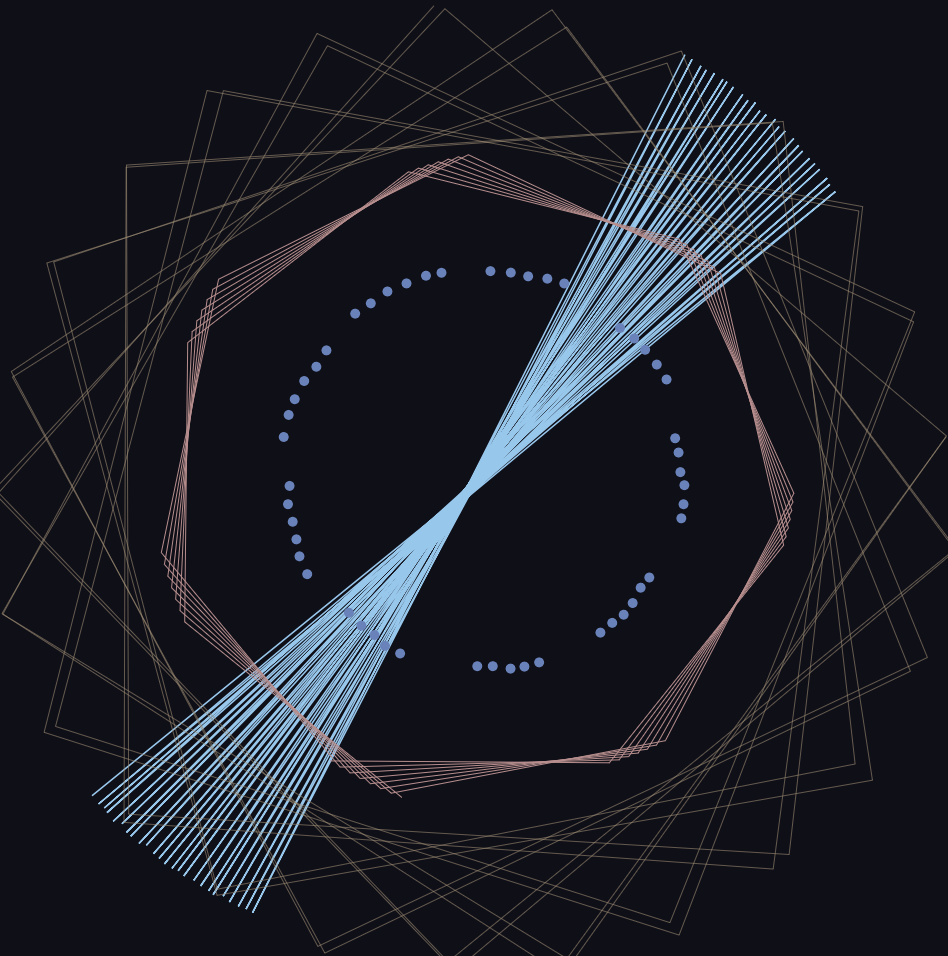
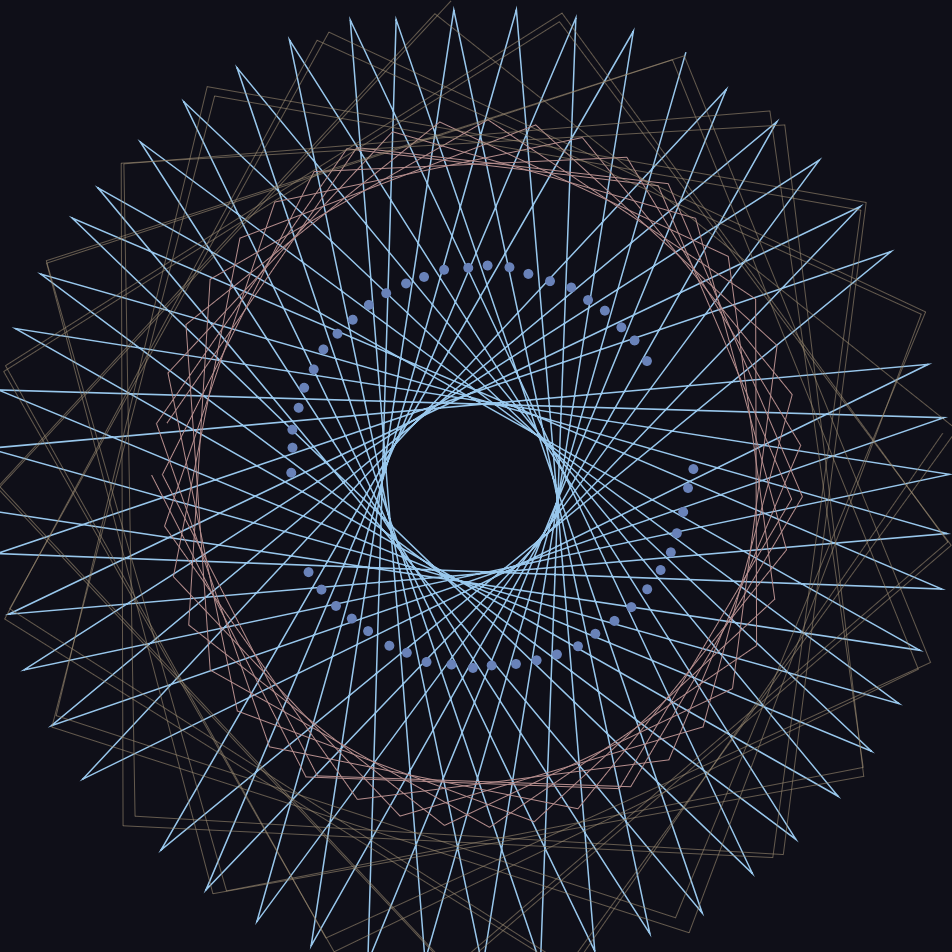
This project was incredibly satisfying to make! Although it was a bit of a struggle at first to understand what each variable manipulated in the curve, plugging in random values and seeing what was affected was helpful and how I learned how to manipulate my curves into the desired look. I added a bit of “jitter” effect to my curves as well because I enjoy how they make the piece feel like it is constantly interactive even when the user is not altering the curves. For future iterations and/or ideas I think it would be interesting to incorporate equations that are not necessarily parametric, explicit, and/or polar.


![[OLD FALL 2018] 15-104 • Introduction to Computing for Creative Practice](wp-content/uploads/2020/08/stop-banner.png)