/*
Connor McGaffin
Section C
cmcgaffi@andrew.cmu.edu
Project-07
*/
var nPoints = 1;
var x;
var y;

function setup() {
    createCanvas(480, 480);
}

//--------------------------
function draw() {
    background(250);
    angleMode(DEGREES);

    //top row
    push();
    rotate(1 * mouseX / 2);
    cardioids();
    pop();

    push();
    translate(width / 2, 0);
    rotate(1 * mouseX / 2);
    cardioids();
    pop();

    push();
    translate(width, 0);
    rotate(1 * mouseX / 2);
    cardioids();
    pop();

    //middle row
    push();
    translate(0, height / 2);
    rotate(1 * mouseX / 2);
    cardioids();
    pop();

    push();
    translate(width / 2, height / 2);
    rotate(1 * mouseX / 2);
    cardioids();
    pop();

    push();
    translate(width, height / 2);
    rotate(1 * mouseX / 2);
    cardioids();
    pop();

    // bottom row
    push();
    translate(0, height);
    rotate(1 * mouseX / 2);
    cardioids();
    pop();

    push();
    translate(width / 2, height);
    rotate(1 * mouseX / 2);
    cardioids();
    pop();

    push();
    translate(width, height);
    rotate(1 * mouseX / 2);
    cardioids();
    pop();


}

function cardioids(){

    var mY = constrain(mouseY, width / 4, width / 2) * .4;
    var a = mY;

    noStroke(0);

    //horiz axis
    //pink
    beginShape();
    fill('rgba(250, 100, 250, 0.6)');
    for(i = 0; i < 360; i++){
        var t = map(i, 0, nPoints, 0, nPoints);
        x = a * sin(t) * (1 - sin(t));
        y = a * cos(t) * (1 - sin(t));
        vertex(x, y);
    }
    endShape(CLOSE);
    //dark blue
    beginShape();
    fill('rgba(10, 100, 250, 0.6)');
    for(i = 0; i < 360; i++){
        var t = map(i, 0, nPoints, 0, nPoints);
        x = a * sin(t) * (1 - sin(t));
        y = a * cos(t) * (1 - sin(t));
        vertex(-x, -y);
    }
    endShape(CLOSE);

    //vert axis
    //rotate 90
    push();
    rotate(90);
    //light blue
    beginShape();
    fill('rgba(50, 150, 220, 0.6)');
    for(i = 0; i < 360; i++){
        var t = map(i, 0, nPoints, 0, nPoints);
        x = a * sin(t) * (1 - sin(t));
        y = a * cos(t) * (1 - sin(t));
        vertex(x, y);
    }
    endShape(CLOSE);
    //
    beginShape();
    fill('rgba(180, 10, 250, 0.6)');
    for(i = 0; i < 360; i++){
        var t = map(i, 0, nPoints, 0, nPoints);
        x = a * sin(t) * (1 - sin(t));
        y = a * cos(t) * (1 - sin(t));
        vertex(-x, -y);
    }
    endShape(CLOSE);

    //white hub
    //fill(250);
    //ellipse(0, 0, a * .6, a * .6);

    pop();
}
This project was tricky. I definitely would have struggled a lot more if I didn’t have the example code in the project brief, but once I found a curve I was drawn to and started plugging variables in for interaction, the project became a playful process.
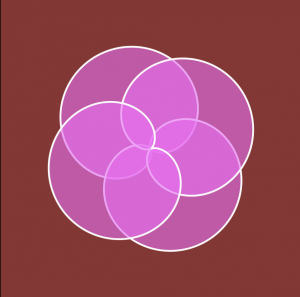
I used s series of cardioid curves to create small pinwheel like elements, which I then organized in rows and columns on the screen. Moving the mouse up and down will scale the pinwheels, whereas moving side to side changes its direction.
I hope to revisit this code, because I know that there are ways to display it in a more compact way and achieve similar results. This is one of the few projects thus far that I feel genuinely proud of its final product.
Below are screenshots of earlier iterations, when I was still figuring out color palettes and general composition of my canvas.
![[OLD FALL 2018] 15-104 • Introduction to Computing for Creative Practice](wp-content/uploads/2020/08/stop-banner.png)

