Margot Gersing – Project 04 – String Art

mgersing-sketch

// Margot Gersing - Project 04 String Art - Section E - mgersing@andrew.cmu.edu

function setup() {
    createCanvas(300,400);
}

function draw(){
	background(0);

	// tight lines less wide
	for (i = 0; i < 200; i += 5) {	
		stroke(i, 208, 247); //blue and purple
		line(100, 450 + i, i, 10 - i); //'curve 1'
		line(100, 450 + i, mouseX * 10, 10 - i); //'curve 1' with interaction
	}
	// tight lines
	for (i = 0; i < 600; i += 5) {	
		stroke(i, 235, 225, i); //green to peach
		line(0, i - 100, i, 400); //'curve 2'
		line(0, i - 100, mouseX, mouseY); //'curve 2' with interaction
	}

	// wider lines
	for (i = 0; i < 600; i += 15) {
		stroke(230, 202, i); //purple to ochre
		line(0, 100 - i, 400, 200 + i); //'curve 3'
		line(0, mouseY / 5, 400, 200 + i); //'curve 3' with interaction

		// curve 4
		stroke(252, 186, i, i); //yellow to magenta
		line(400, 200 - i, i - 400, i); //'curve 4'
		line(400, mouseY - i, i - 400, i); //'curve 4' with interaction	
	}
}

I enjoyed making this project. I decided that I wanted to incorporate my ‘i’ variable into more than just the creation of the lines. I experimented with replacing rgb values with ‘i’ and it created really interesting color shifts. I also decided to make a copy of each of the curves I made and make one of them interactive with mouseX and mouseY.

William Su – Project 04 – String Art

I just made a rainbowy web of strings that changes colors depending on mouseX and mouseY. Credit to the person that utilized rotate and translate to move stuff around, it made things a lot simpler to think about.

sketch

// William Su
// Section E
// wsu1@andrew.cmu.edu
// Project 04

function setup () {
  createCanvas(400, 300);
  background(0);
  strokeWeight(0.5);
}

function draw () {
  for (var x = 0; x <= 50; x += 2) {
    var1 = x 
    var2 = x * 10
    b = constrain(var2, 0, (3 * width) / 5);

    //bottomleft
    stroke(mouseX, 0, 50);
    line(0, var2 + height / 2, var2, height);

    //topleft
    push();
    translate(300, 0);
    rotate(radians(90));
    stroke(mouseY, 0, mouseX);
    line(0, var2 + height / 2, var2, height);
    pop();

    //topright
    push();
    translate(400, 300);
    rotate(radians(180));
    stroke(mouseY, mouseX, 50);
    line(0, var2 + height / 2, var2, height);
    pop();

    //bottom right
    push();
    translate(100,300);
    rotate(radians(270));
    stroke(mouseX, mouseY, 50);
    line(0, var2 + height / 2, var2, height);
    pop();

    //2ndCurveTopRight
    stroke(50,mouseX, mouseY);
    line(width * 1.2, var2, var2 /2, 0);

    //2ndCurveBottomLeft
    push();
    translate(400, 300);
    rotate(radians(180));
    stroke(50,mouseY, mouseX);
    line(width * 1.2, var2, var2 /2, 0);
    pop();
  };
}

Shariq M. Shah – Project 04 – String Art

shariqs-project-04

// Project - 04
// Name: Shariq M. Shah
// Andrew ID: shariqs
// Section: C


function setup() {

createCanvas(400,300);

}

function draw() {

  background(0);

  for (var i = 0; i < 200; i += 1) {

      //defining a rotating series of lines that converge in patterns
      //using frameCount to have rotations and colors change over time

      strokeWeight(0.4);
      translate(width / 2, height / 2 + 100);
      rotate(radians(180 * 0.1 + frameCount));

      //various configurations and colors of lines that change according to stepping i variable
      //mouseY used to alter color and configurations depending on mouse location

      stroke(mouseY, 0, 25 + frameCount);
      line(i + i * width,  height * 0.1 * mouseY, width/2, i + i*2);


      stroke(0.5 * mouseY, 0, 25);
      line(i + i * -width,  height * 0.1 * mouseY, width/2, i + i*2 );


      stroke(mouseY, 0, 250);
      line(i + i * width/10,  -height * 0.1 * mouseY, width/2, height);


      stroke(mouseY, 0, 250);
      line(i + i * -width/10,  -height * 0.1 * mouseY, width/2, height);

      }

}

In this project, I explored various configurations and rotational properties that could be created with the lines created in for() loops. The program I developed focuses on developing a highly dynamic and fluid pattern of lines that at times seem solid and at other times seem porous. The colors are also dynamic as they change with the movement of the lines.

YouieCho-LookingOutwards-04

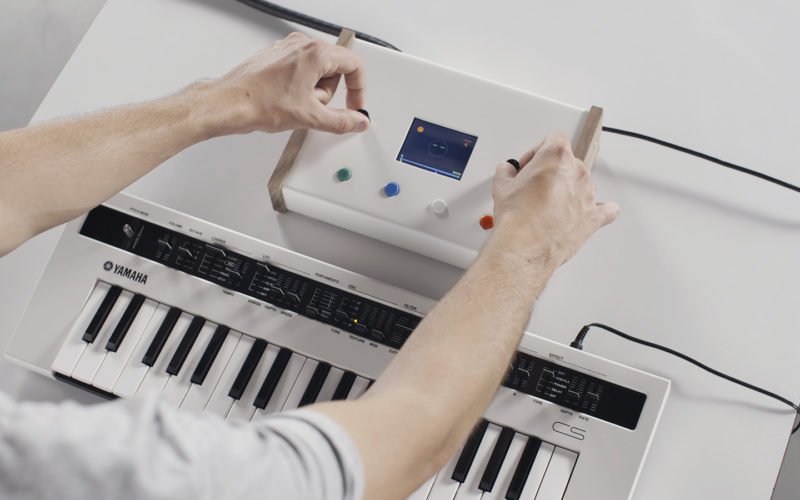
Weather Thingy – Real time climate sound controller , created by Adrien Kaeser at ECAL

Weather Thingy is a sounds controller that takes real time climate-related events data to control and modify the stings of musical instruments. It is made up of a weather station on a tripod microphone, and a custom built controller that is connected to the weather station. I think this is very inspiring for me because I had never thought of connecting weather data with sound production. This has sensors that observe the climate and assign various parameters received to audio effects. The creator’s artistic sensibilities, in my opinion, especially come in the very clear and minimal that makes use of clear color-coded buttons, as well as customized parts of the project as a whole. It is also notable that there are many real-time interactions going on.

The user can at any time constrain the value received or amplify it with two potentiometers on the edges of the screen  (Creative Applications Network).

Monica Chang – Project 04 – String Art

sketch

function setup() {
  createCanvas(400, 300);
}

function draw() {
  // changing background color based on mouse position
  background( mouseX, mouseY, 245);
    
  // creates pattern on top right
  
  for (var i = 0; i < 300; i++) {
      strokeWeight(0.5); // for thin lines
    
      var x1 = width - i * 5; // x1 for curve 1
      var x4 = width + 50; // x1 for curve 4
    
      var y1 = height - i * 5; // y1 for curve 1
      var y2 = height + i * 50; // y1 for curve 2
      var y3 = height - i * 6; // y2 for curve 3
      var y2y4 = height - i * 15; // y2 for curve 4
      var y1y4 = height - i; // y1 for curve 4

      //curve #1
      stroke("red");
      line(x1, mouseY, mouseX, y1); 
    
      //curve #2
      stroke("blue");
      line(0, y2, x1, mouseY); 
      
      //curve #3
      stroke(255);
      line( x1, mouseY, 0, y3);
      
      // curve #4
      stroke("yellow");
      line(x4, height - i, mouseX, y2y4); 
    }


}

This project allowed me to better understand the way loops can be used. I may have struggled but I am becoming more comfortable with the concept of loops and what I can do with them. I had lots of fun integrating color and design as I grew more familiar with the concept of for loops and “i”.

Shariq M. Shah – Looking Outwards 04 – Sound Art

http://

Demonstration of Hamdan’s work: Saydnaya

Lawrence Abu Hamdan is a sound researcher and designer studying the intersection of sonic research, politics, art, and forensics. Using his background as a musician, he uses computational processes and calibrated research models for his political and artistic investigations. One of his works, Saydnaya, consists of a sound box in a dim room in a way where voices of 4 inmates become quieter after 2011 protests in his country. There is a level of abstraction in his work that allows the work to be understood as not only sets of decibel data and forensic investigations, but also as emotional and evocative maps of the human condition.

The Hummingbird Clock, on the other hand, functions as a public time piece that exists both physically and online. It records, second by second, the buzz of the electronic grid picked up by surveillance cameras in a highly public location, so that it may be viewed in the public domain rather than exclusively by government security agencies.

These highly novel yet highly calibrated approaches to the interactions between computation, forensics, politics, and design push the boundaries on what can be conceived as art.

Hummingbird Clock in public space

Rachel Shin- LO4

Weather Thingy – Real time climate sound controller

In 2018, Adrien Kaeser developed a computation system that linked climate and music to produce a variation of sounds according to the change in climate. Kaeser developed this system with Arduino, Weather Meters, environment sensor, C++ coding, and MIDI, allowing him to configure a connection between climate and sound production.

As someone with a musical background, I admired how Kaeser took the time to configure each component of music and audience experience to a certain climate factor. He altered the panning, delay, and frequency according to the change in wind, UV sensor, and wind speed respectively. I appreciated this project particularly because it allowed Kaeser to encourage listeners to adopt a different musical style in contrary to the conventional pop, lo-fi, and rap styles taken today. I suppose that the algorithms used to generate the work came from creating two platforms of which one was made to visually represent a soundscape while the other produced configured sound variations based off of the visualized soundscape. The two were then linked with coding and sensors to produce this “Weather Thingy.” The creator’s artistic sensibilities manifested in the final form by controlling and modifying music and sound production by a console and interface that translates climate data into a visual representation of sound.


SooA Kim – 04 – String-Art


sketch

For this assignment, I tried to create this abstract wave forms.  Then, I ended up also attempting to make some symmetrical lines to understand better how line coordinates work using loop functions. It was very confusing, I would need more practice to get used to it.

/* SooA Kim
Section D
sookim@andrew.cmu.edu
Assignment 04 -String Art */


function setup() {
    createCanvas(400, 300);
}

function draw() {
    background(0);

    for (var i = 0; i < 200; i+= 2) {
        stroke("gold");
        strokeWeight(1);
        line(i, height, 0, 5*i);
        stroke("red");
        line(4*i, height, 0, 4*i);
        stroke("pink");
        line(7*i, height, 0, 3*i);
        stroke("blue")
        line(10*i, height, 0, 2*i);
        stroke("purple");
        line(13*i, height, 0, 1.5*i);
    }
    
    for (var i = 0; i < 100; i+= 10) {
        stroke(255, 109, 0);
        strokeWeight(1);
        line(i/4, i, i*4, height/2);
        line(i/4, height - i, i*4, height/2);
        stroke(mouseX, 255, mouseY);
        strokeWeight(mouseX);
        line(width - (i*2), 0, i * 2, height);
        line(width - (i*2), height, (i*2), 0);

    }

}


Nawon Choi— Project 04 String Art

nawon-project-04

// Nawon Choi
// nawonc@andrew.cmu.edu
// Section C
// Project 04 String Art


var a = 0;
var b = 300;
var c = 400;
var amt = 50;

var r = 500;
var x;
var y;
var x1;
var y1;

function setup() {
    createCanvas(300, 400);
    background("black");
}

function draw() {
    // got help getting the points along a circle: 
    // (lines 27, 32, 33)
    // https://stackoverflow.com/questions/5300938/calculating-the-position-of-points-in-a-circle
    var slice = 2 * PI / amt;
    for (let i = 0; i < amt; i++) {
        // draw lines from points along the circle,
        // to points along the edge of the canvas
        var angle = slice * i;
        x = r * cos(angle) + a;
        y = r * sin(angle) + c;
        stroke("#37393b");
        line(x, y, i * 20, a);
    }

    // green and yellow lines
    for (let i = 0; i < (amt / 2); i++) {
        stroke("green");
        line(a, a, i * 20, c);
        var angle2 = slice * i * 2;
        x1 = r * cos(angle2) + a;
        y1 = r * sin(angle2) + c;
        stroke("yellow");
        line(x1, y1, i * 25, c);
    }

    // make lines that follow the mouse
    stroke("#a3afb5");
    line(b, a, mouseX, mouseY);
}

For this project, I mainly tried to experiment with different ways lines could be drawn. I initially played around with the way lines splay outward from a circle. I amplified this by playing around with the variables, magnifying the size of the circle and having it go off the canvas, creating the gray lines in the background. I added some green and yellow lines to add some visual interest, then added the lighter gray lines to add an interactive element.

Crystal Xue-LookingOutwards-04

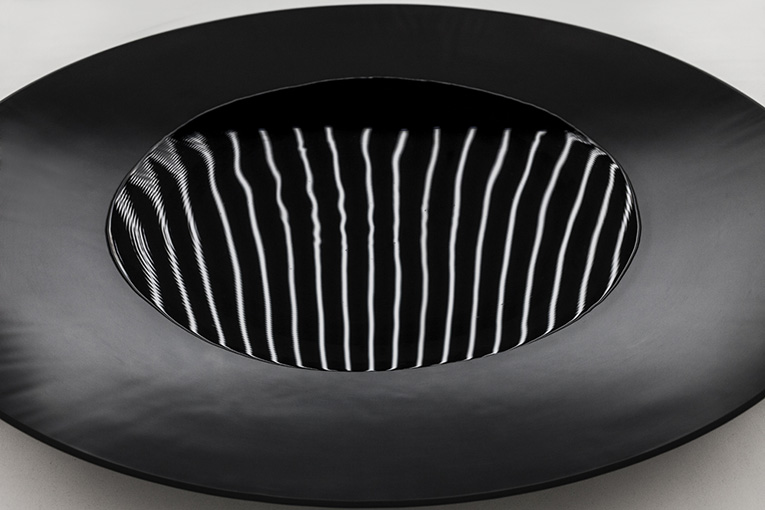
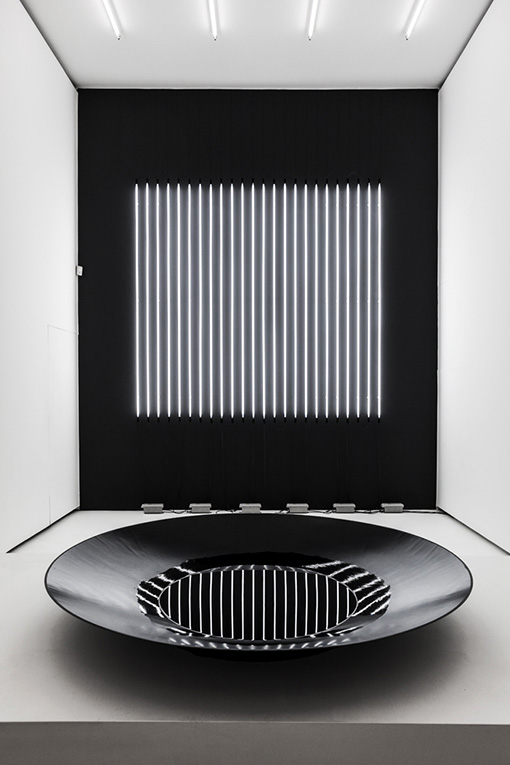
Carsten Nicolai is an artist and musician based in Berlin who is famous for presenting the scientific quality of sound in unique artistic ways. In the contemporary ages, art is not merely 2 dimensional. It can be interpreted and perceived in all different senses. And Carsten is dedicating his life working on visualizing sound in the most minimalistic installations.

This is one of his recent work -Reflektor Distortion, as the video and the photos shown progressively further away, the installation is conceived as a rotating basin filled with water. The contrast of the black and white used here is perfect for showing the distortion nuance of the sound changing in its frequency.

Carsten Nicolai – reflektor distortion

As we gradually stepping outwards, the installation is fairly simple, straightforward and effect-maximized. I really appreciate the aesthetics and simplest medium that Carsten chose here – “water”, as opposed to complex technology devices.