Sean Leo – Project 04 – String Art

This learning curve on this was step (pun intended) but once I realized I could copy and rotate the different parts it was smooth sailing.

sleo-project04

//Sean B. Leo
//sleo@andrew.cmu.edu
//Section C
//Project 04
var x1 = 0;
var y1 = 0;
var x2 = 0; 
var y2 = 350;
var x2step = 11; 
var y1step = 4;

function setup() {
  createCanvas(400, 300);
  background(0);
  strokeWeight(.6);
}

function draw() {
//first curve
stroke('blue');
for(var i=0; i<1; i++){
    line(x1, y1, x2, y2);
    y1+=y1step;
    x2+=x2step;
}
//blue curve translated, rotated and colored
push();
stroke('red');
translate(300, 0);
rotate(radians(90));
for(var i=0; i<1; i++){
    line(x1, y1, x2, y2);
    y1+=y1step;
    x2+=x2step;
}
pop();
//blue curve translated, rotated and colored 2
push();
stroke('green');
translate(400, 300);
rotate(radians(180));
for(var i=0; i<1; i++){
    line(x1, y1, x2, y2);
    y1+=y1step;
    x2+=x2step;
}
pop();
//blue curve translated, rotated and colored 3
push();
stroke('yellow');
translate(100, 300);
rotate(radians(270));
for(var i=0; i<1; i++){
line(x1, y1, x2, y2);
y1+=y1step;
x2+=x2step;
}
pop();
}


LookingOutwards 4 – Danny Cho

Dot Piano – by Alex Chen & Yotam Mann

I love how the sound of piano is directly translated in to a warming visual. Personally, when I play piano, I enjoy playing subtle music as jazz or acoustic music, and this kind of visualization of sound matches it really well. At Cooper Hewitt, I encountered this creation and thought it was so beautiful and fun to play with, especially in a bigger scale. It is also available online at https://dotpiano.com with different types of displays.

Each note is assigned a color and a path to move in. The intensity of the sound and the volume determines how bright, fast, saturated the colored circle will be.

I would like to create some kind of collaboration between sound and coding in this course.

Raymond Pai-Project-04

sketch

//Raymond Pai
//Section D
//rpai@andrew.cmu.edu
//Project 04

var rx1;
var ry1;
var rx2;
var ry2;

var lx1;
var ly1;
var lx2;
var ly2;

var bx1;
var by1;
var bx2;
var by2;

var tx1;
var ty1;
var tx2;
var ty2;

function setup() {
    createCanvas(400, 300);
    //initiate r curve
    rx1 = 0;
    ry1 = -150;
    rx2 = 0;
    ry2 = height;

    //initiate l curve
    lx1 = 20;
    ly1 = -150;
    lx2 = 20;
    ly2 = height;

    //initiate b curve
    bx1 = -20;
    by1 = -150;
    bx2 = -20;
    by2 = height;

    //initiate l curve
    tx1 = -50;
    ty1 = -150;
    tx2 = -50;
    ty2 = height;
}

function draw() {
    background(220, 220, 150);

    //triangle
    fill(100);
    triangle(width/2, height, width/2 + width/4, height/2, width, height);
    fill(255);
    triangle(width/2 + 35, height - 50, width/2 + width/4, height/2, width - 35, height - 50);

    //r curve
    for (var a = 0; a < 1000; a += 10) {
        stroke(50, 50, 255);
        line(rx1, ry1 + a, rx2 + a, ry2);
    }
    //l curve
    for (var a = 0; a < 1000; a += 10) {
        stroke(255);
        line(lx1, ly1 + a, lx2 + a, ly2);

    }
    //b curve
    for (var a = 0; a < 1000; a += 10) {
        stroke(100, 100, 255);
        line(bx1, by1 + a, bx2 + a, by2);
    }
    //t curve
    for (var a = 0; a < 1000; a += 10) {
        stroke(0, 0, 255);
        line(tx1, ty1 + a, tx2 + a, ty2);
    }
}

Drawing of a wave. The white foam and the dark blue are shown using a gradient of 4 ‘curves’.

Image result for tsunami painting
Reference

Hyejo Seo – Project -04: String Art


For this project, I wanted to explore different shapes that could be created by overlapping lines. I thought of playing cards, so I decided to use “Diamond” as my theme. 

sketch

/* 
Hyejo Seo
Section A
hyejos
Project - 04 - String Art
*/

function setup() {
    createCanvas(300,400);
}

function draw() {
    background(47, 47, 47);
    
    for(var q = 0; q < 50; q += 3){
        stroke(106, 127, 219); // blue line 
        line(q - 30, -q, q + 300, height - q + 30);
        stroke(224, 141, 172); // pink line
        line(q - 60, height + q, width + q, q - 60);
    }
    //white lines 
    for(var q = 0; q < 50; q += 5){
        stroke(255); 
        strokeWeight(0.7);
        line(q + 150, height + q, width + q + 160, q);
        line(q - 250, height + q, width + q, q - 260);
    }
    //Joker 
    fill(87, 226, 229);
    noStroke();
    textSize(15);
    textFont('Serif');
    text("J", 283, 315);
    text("O", 280, 335);
    text("K", 280, 355);
    text("E", 280, 375);
    text("R", 280, 395);

    //other letters
    textFont('Serif');
    textSize(25);
    //k + diamond
    text("K", 10, 25);
    quad(19, 35, 30, 50, 19, 65, 8, 50);
    //Q + Diamond 
    text("Q", 10, height - 40);
    quad(19, 369, 30, 384, 19, 399, 8, 384);
    text("J", width - 23, 25);
    quad(width - 19, 35, width - 30, 50, width - 19, 65, width - 8, 50);   
}

Ammar Hassonjee – Project 04 – String Art

Project 04 – String Art

/* Ammar Hassonjee
   Section C
   ahassonj@andrew.cmu.edu
   Project 04 - String Art
   */

function setup() {
  createCanvas(300, 400);
  background(180);
}

function draw() {
    // For loop that allows for reiterations of the line
    // Loop runs 90 times to generate specific shapes
    for (i = 0; i < 90; i++) {
        // Multiple variables declared that are used in line function
        x1 = i * 10;
        y1 = -x1;
        x2 = width / 2 - x1;
        y2 = height / 2 - y1;
        y3 = 0;
        y3 += i * 5;
        y4 = height;
        y4 -= i * 5;

        // Alternating the color of lines to create an intersting composition
        if (i < 50) {
            stroke(0);
        }
        else {
            stroke(255);
        }
        strokeWeight(.5);

        // First pair of top triangles
        line(width / 2, height / 2, x1, y1);
        line(width / 2, height / 2, width - x1, height - y1);

        // Second pair of the side triangles
        line(width / 2, height / 2, width, y4);
        line(width / 2, height / 2, 0, y3);

        // Second series of variables declared to allow for curves to be developed
        stroke(255);
        a1 = width;
        a2 = 0;
        a3 = -100;
        a4 = 0;

        a1 -= i * 4;
        a3 += i * 1.2;
        a4 += i * 5;
        // Top left curve drawn
        line(a1, a2, a3, a4);

        b1 = width;
        b2 = height;
        b3 = width;
        b4 = -5;

        b1 -= i * 4;
        b3 += i * 3;
        b4 += i * 5;
        // Bottom right curve drawn
        line(b1, b2, b3, b4);


    }


}

My inspiration for this project started with testing what combinations of lines resulted from varying the parameters in a for loop. I found interesting patterns where lines clustered together represent shadows, and by alternating colors, I was able to make an interesting composition.

Ghalya Alsanea – Looking Outwards – 04

Making of Off the Staff (link)

By Nicholas Rougeux, September 6, 2016 in ArtData

Seeing music

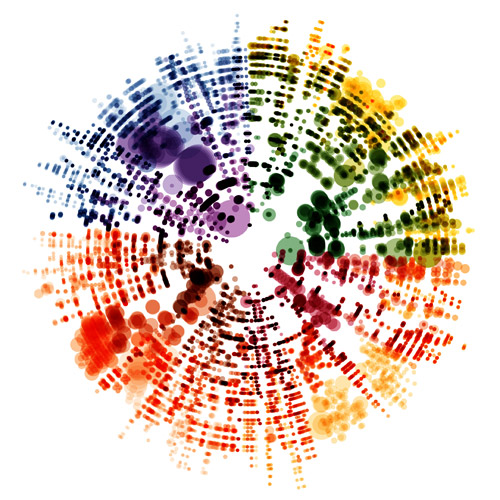
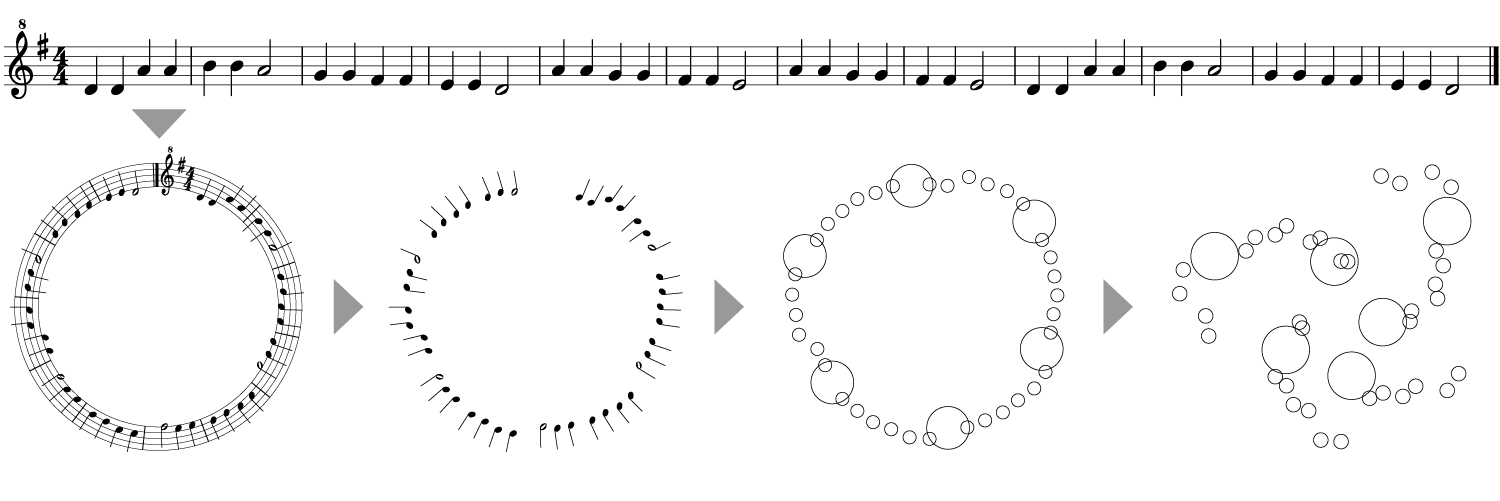
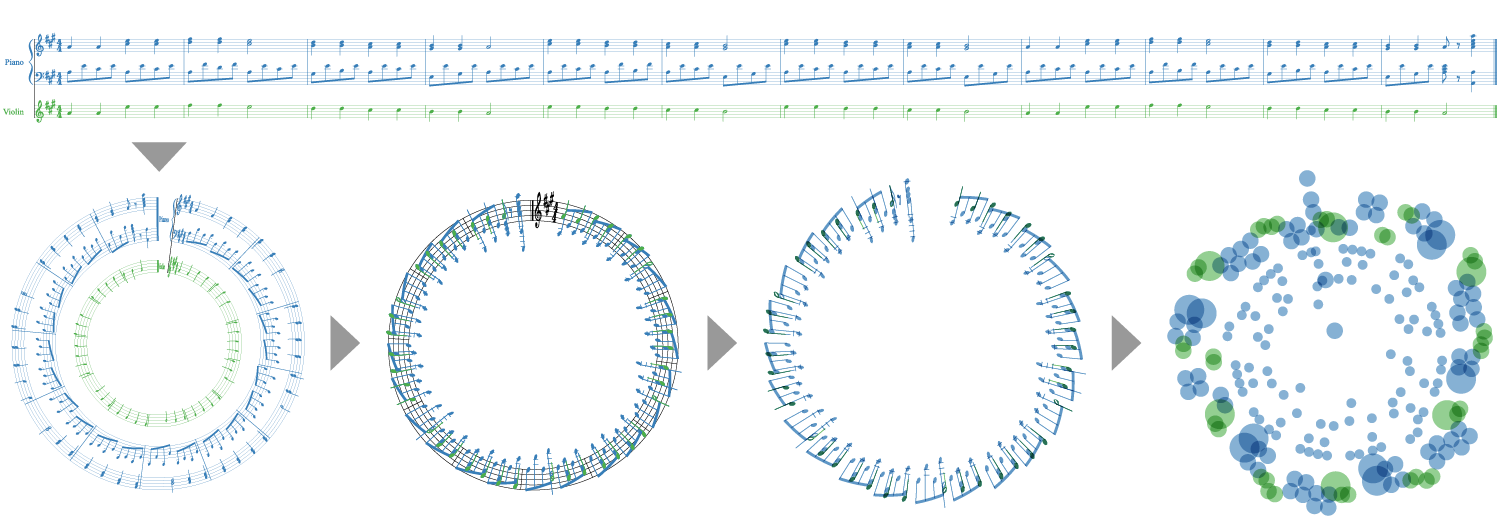
Each dot represents a note in the score. Pitch is indicated by the distance from the center of the image, while the time at which the note occurs is given by the angle from the 12 o’clock position. The size of the dot indicates the duration of the note, and the color of the dot is different for each instrument.

The Four Seasons by Antonio Vivaldi

How they were made

“I can’t read music but I can parse it. The talent of reading music has always escaped me which is a little ironic considering I grew up in a musical family. However, I’ve always enjoyed how sheet music looks so I took a shot at visualizing the notes from musical scores and the result is this series of posters.”

Nicholas Rougeux (the artist)
Scores for single instruments use a single color.
Scores for multiple instruments use color as an added dimension to differentiate instruments.

The original process was:

  1. Original MethoExport XML from MuseScore
  2. Convert XML to CSV with Luxon
  3. Upload select CSV files to Google Sheets: “Copying and pasting tens of thousands of cells into Google Sheets was a slow process and prone to failing—even with the speediest of browsers.”
  4. Combine CSV files with Google Sheets: “The process of combining CSV files with Google Sheets was the most time-consuming step of the original process and had the risk for inaccuracy.”
  5. Import CSV into NodeBox to generate images

The new process is:

  1. Export MIDI from MuseScore
  2. Generate CSV from MIDI file with midicsv-process
  3. Import CSV into NodeBox to generate images

More details on the process here. This includes early versions and tools used. Earlier process can be found here.

What I admire most about his work is the fact that you’re able to visualize an entire musical score in one image. It was really mind opening for me to see the work of famous musicians and how structured they are, especially the work of Bach. It is like although they were made for the beautiful sounds, they still exist to be beautiful visuals.
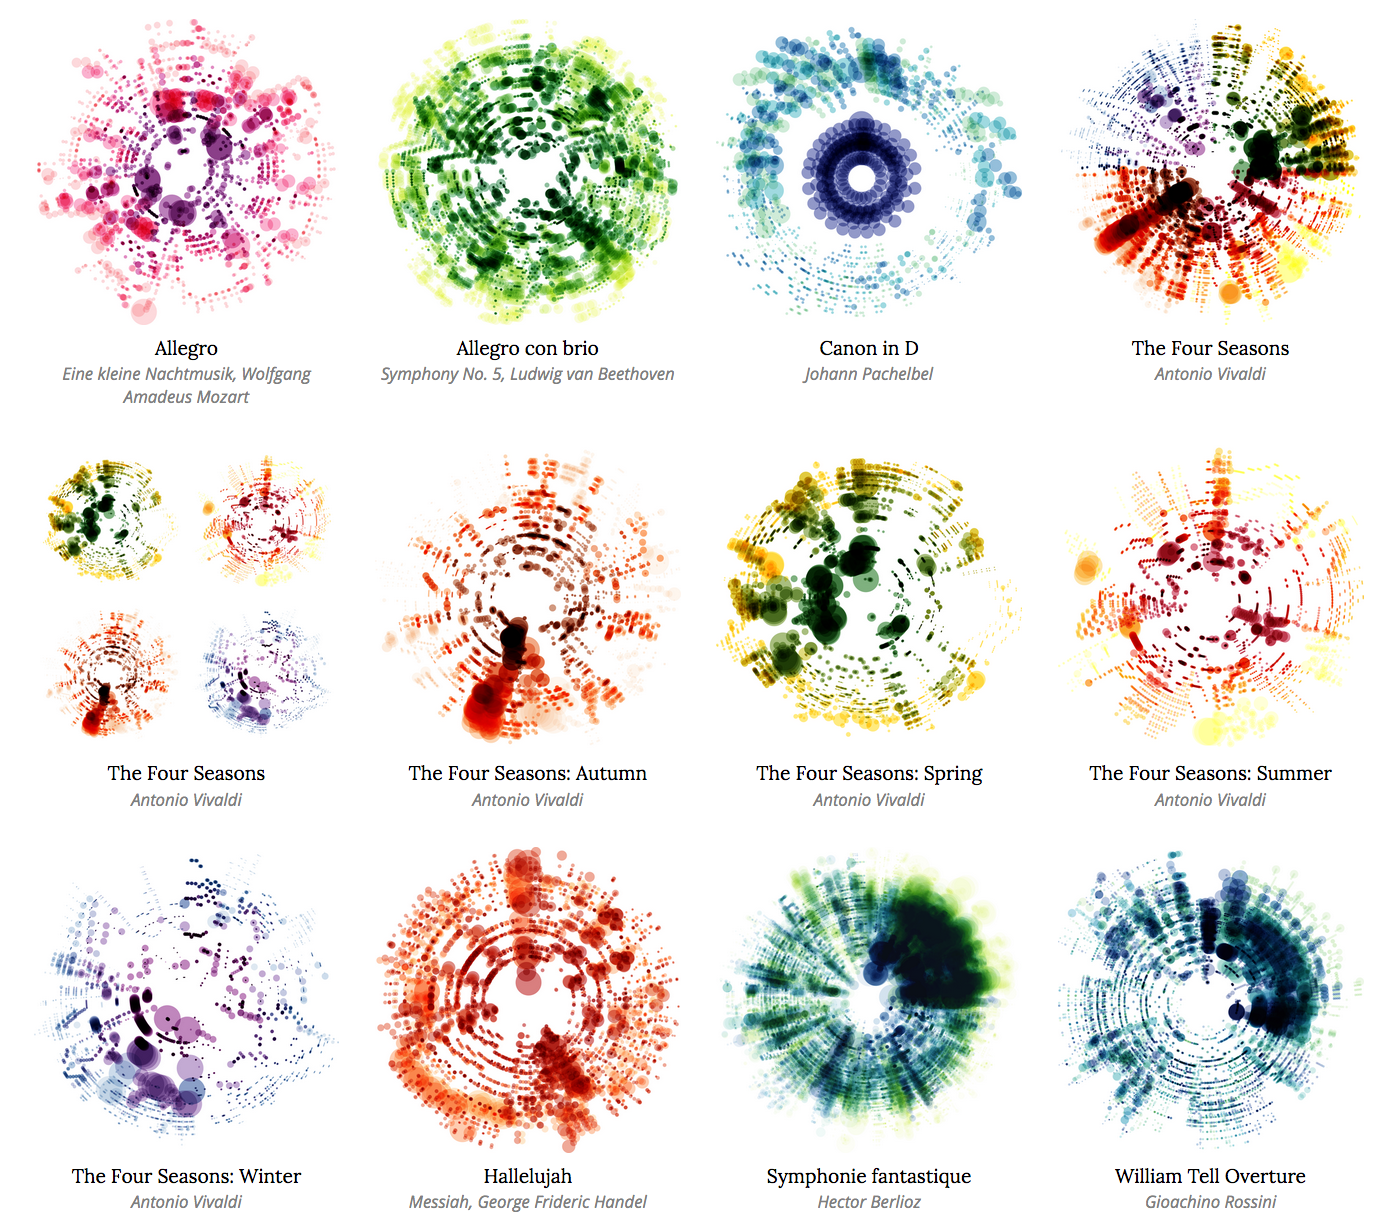
More examples of Rougeux ‘s amazing posters.

Ammar Hassonjee – Project 03 – Dynamic Drawing

Ammar Hassonjee – Dynamic Drawing

/* Ammar Hassonjee
    Section C
    ahassonj@andrew.cmu.edu
    Project 03 - Dynamic Drawing
*/

// Sky color variables
var sc1 = 255;
var sc2 = 255;
var sc3 = 255;
function setup() {
    createCanvas(480, 640);
}

function draw() {
    // Making sure the sky color changes from day to night as the mouse moves down
    background(mouseY * .5, 6 + mouseY * .18, 60 + mouseY * .12);
    if (mouseY > height) {
        background(242, 117, 134);
  }

  // Changing the color of the stars to make sure they fade at dawn
    noStroke();
    sc2 = 255 - mouseY * .4;
    sc3 = 255 - mouseY * .3;
    if (mouseY > height / 2) {
        sc1 = 242;
        sc2 = 117;
        sc3 = 134;
  }

  // Creating the star pattern using nested for loop
    fill(sc1, sc2, sc3);
    for (let a = 1; a < 7; a++) {
        for (let i = 1; i < 51; i++) {
            if (i % 2 === 0) {
                ellipse(i * 30 - 15, 70 * a, 10, 10);
                }
            else {
                ellipse(i * 30 - 15, 70 * a - 30, 10, 10);
              }
            }
  }

  // Drawing the mountains
    var p = 0;
    fill(96, 90, 114);
    for(let i = 0; i < 23; i++) {
        if (i % 2 === 0) {
            triangle(p - 30, 640, p + 45, 500 + (mouseX * .1), p + 90, 640);
          }
        else {
            triangle(p - 30, 640, p + 45, 460 + (mouseX * .1), p + 90, 640);
          }
          p += 45;
        }

    // Creating the shooting star
    push();
    // Making the star translate back and forth across the image plane
    translate(mouseX, height / 3);
    rotate(radians(170));
    // Streaks for the star
    fill(220);
    triangle(384, 145, 387, 160, 665, 92);
    triangle(665, 86, 384, 127, 383, 138);
    // Shooting star drawing
    fill('yellow');
    beginShape();
    vertex(339, 86);
    vertex(353, 112);
    vertex(379, 116);
    vertex(359, 138);
    vertex(364, 166);
    vertex(339, 153);
    vertex(314, 166);
    vertex(319, 138);
    vertex(299, 116);
    vertex(326, 112);
    endShape();
    pop();

  }


My inspiration for this assignment stemmed from my love of nature and landscape. I’ve always liked the scene of a shooting star in a starry sky, so I thought it would be a great dynamic drawing opportunity to have a star move across the screen while the sky color changes.

Kimberlyn Cho- Project 04

string

/* Kimberlyn Cho
Section C
ycho2@andrew.cmu.edu
Project 4 */

//all comments in context of left to right

function setup () {
	createCanvas(400, 300);
	background(255);
	strokeWeight(0.03);
}

function draw () {
	for (var i = 0; i < 30; i++) {
		var a = i * 5
		var b = i * 7
		b = constrain(b, 0, width / 2);

		//bottomleft fold
		stroke(0);
		line(0, b + height / 2, b, height);

		//middle gray fold 
		stroke(105);
		line(0, a, b, height / 2);
		stroke(0);
		line(b, height / 2, width / 2, height / 2 + b);
		stroke(105);
		line(width / 2, height / 2 + a, b + width / 2, height);

		//middle red fold
		stroke(160,0,0);
		line(0, a / 2, b / 2, height / 4);
		stroke(72,0,0);
		line(a - width / 9, height / 4, width / 4, a + height / 4);
		stroke(160,0,0);
		line(width / 4, a + height * 0.26, b + width / 4, height * 0.75);
		stroke(72,0,0);
		line(b + width / 4, height * 0.75, width * 0.75, height * 0.75 + b);
		stroke(160,0,0);
		line(width * 0.75, height * 0.75 + b, width * 0.75 + b, height);

		//outer right
		stroke(0);
		line(width, b * 1.5, b * 2, 0);

		//middletop
		stroke(0, 0, 204);
		line(b, 0, width / 2, b);
		line(b + width / 2, 0, width / 2, height / 2 - b);
		
		//pins
		fill(0);
		ellipse(0, 0, 20, 20)
		ellipse(0, height / 4, 10, 10)
		ellipse(width / 4, height / 4, 10, 10)
		ellipse(width / 4, height * 0.75, 10, 10)
		ellipse(width * 0.75, height * 0.75, 10, 10)
		ellipse(width * 0.75, height, 10, 10)
		ellipse(width, height, 20, 20)
		ellipse(0, height / 2, 10, 10)
		ellipse(width / 2, height / 2, 10, 10)
		ellipse(width / 2, height, 10, 10)
		ellipse(width, 0, 20, 20)
		ellipse(0, height, 20, 20)

	};
}

I was inspired by tensile systems such as pinning down flexible materials such as nylon. I used different shades to emphasize the folding pattern of the middles pieces.

Gretchen Kupferschmid-String Art-Project 04


with this project, I wanted to play around with color and the way layering string art and color can create an abstract piece of art.

sketch


function setup() {
    createCanvas(400,300);
    
}
 function draw (){
    background(235, 192, 52);
    for (i= 0; i<200; i+=5){
    stroke(244, 192, 252);
    line(i-100, 0, 400, i)
        
    stroke(244, 192, 252);
    line(0, i, i, 200)
    
    stroke(244, 192, 252);
    line(i, 200, 0, 600-i)
    line(i, 250, 0, 300-i)
    
    }
    for(i=0; i<400; i+=10){
    stroke(255);
    line(400, 300-i , i, 300);
    line(400, 200-i , i, 300);
    line(400, 100-i , i, 300);
    line(400, 50-i , i, 300);
    stroke(209, 61, 90);
    line(100-i, 150, mouseX, mouseX);
    line(300-i,0, i-290, 150);
    
    
    }
 }

Gretchen Kupferschmid-Looking Outwards-04

Mixing both art with experience design, the hotel Sister City in NYC has a special sound installation in their lobby. Through a collaboration between musician and composer Julianna Barwick and Mircrosoft this project utilized Microsoft’s Custom Vision Service which utilizes artificial intelligence to track and analyze various elements of the Sister City environment through a camera on the roof. Through this knowledge, it then triggers the sound specific to what the camera has recognized. For example, clouds play a different sound than birds, and as things occur in the environment, a “song” is produced in the lobby. I find this extremely interesting because it creates a generative music installation that although is very technical, its being made by the natural environment around you. It also allows Barwick to see her own sound scores become something of their own as they are controlled by “outside forces”.

A video describing the project

https://www.microsoft.com/inculture/musicxtech/sister-city-hotel-julianna-barwick-ai-soundscape/