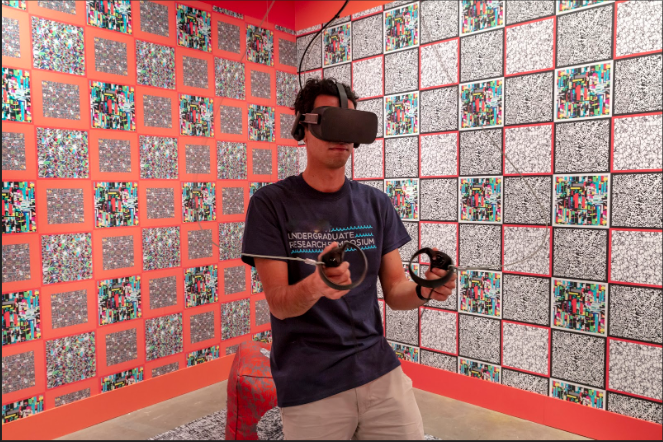
For this looking outwards, I found two projects that relate to webcam art or are interactive program that overlay over a photo.
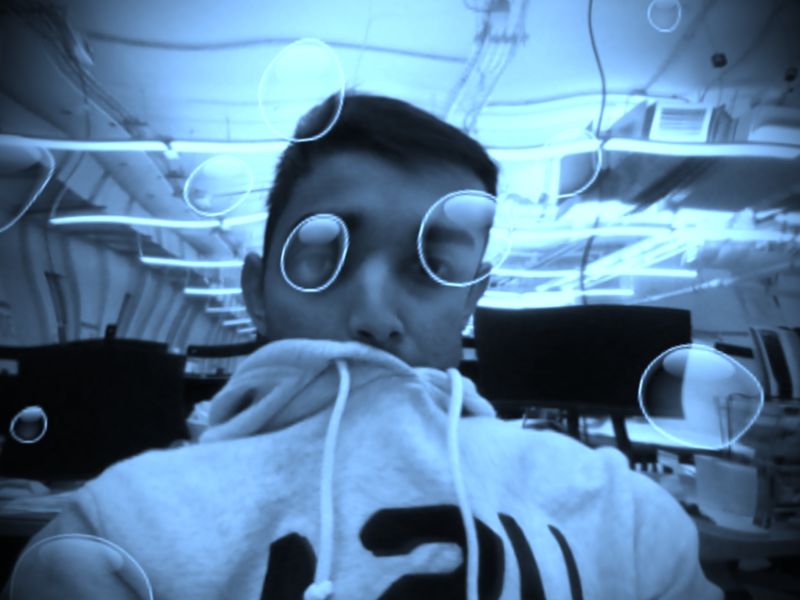
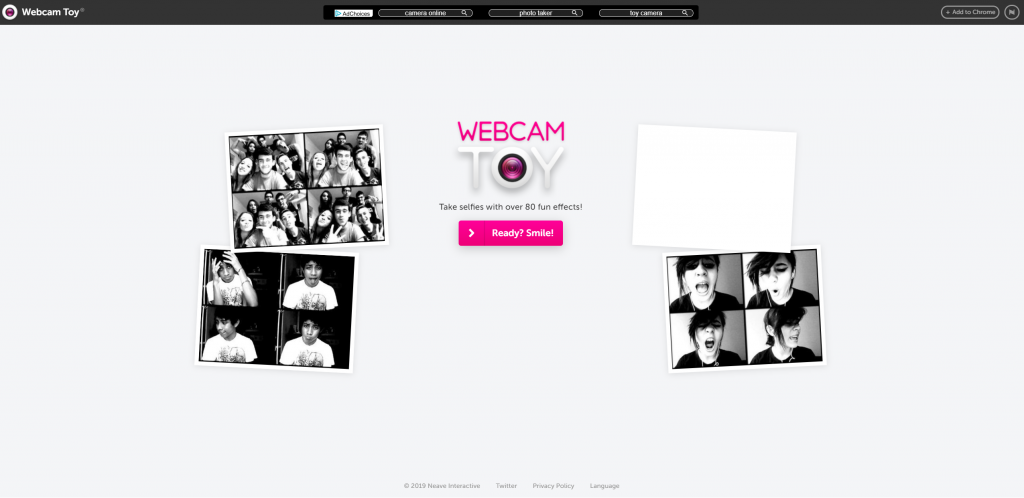
The first project I found is called Webcam Toy, a website that takes selfies using a variety of photo filters that react to the figure in the frame. Webcam Toy is developed by Paul Neave, a British based programmer and designer who has been designing for over 20 years and focuses on making playful software that incorporates imagination. Webcam Toy has a bunch of filters that warp and mirror the camera at different point of the canvas, and also draws elements on top of the webcam, such as fire or snow that falls on top of the person’s head.
A photo of me using Webcam Toy’s underwater filter. Webcam Toy’s interface and website.
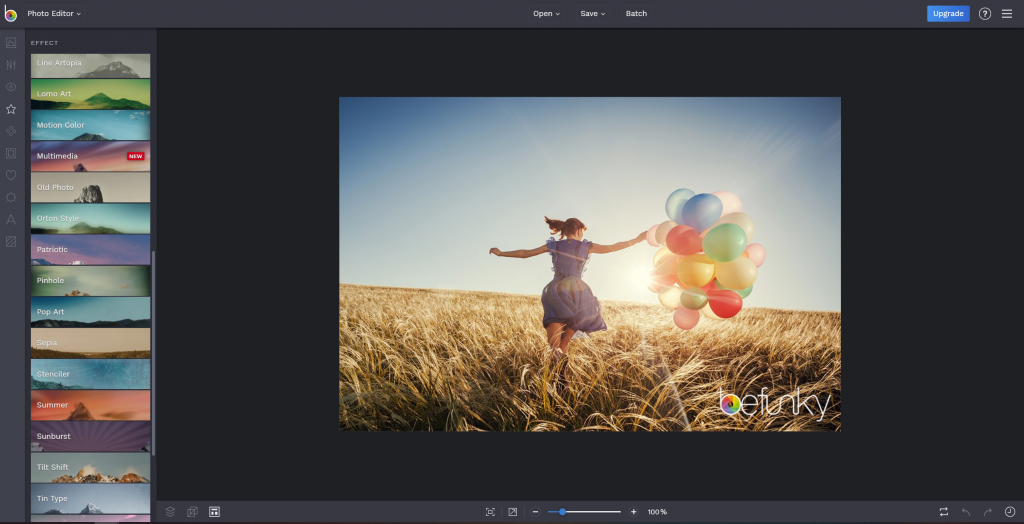
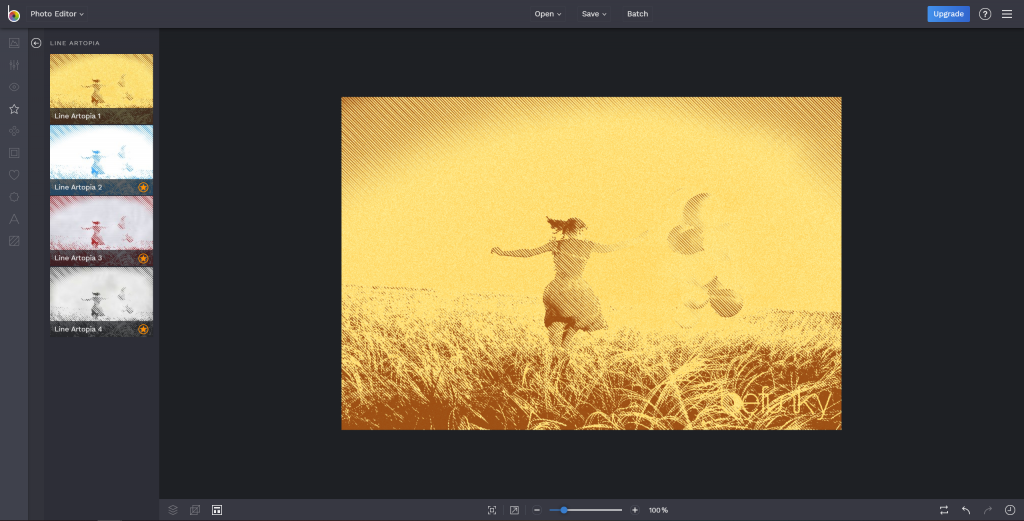
The second project I found is a website called BeFunky, which takes a photo as an input, and has a number of options for effects and filters that can be applied to the image. Some of these filters involve detecting different color gradients in the image and recoloring them. This project was developed by the BeFunky team that is a group of software developers who were motivated to create a tool that lets anyone recreate beautiful photographs without having to learn technical software like Adobe Photoshop.
BeFunky interface showing unaltered, original photo.Photo with line art filter from BeFunky.
For the final project, I plan to collaborate with Lee Chu to make a series of interactive camera scenes that use the webcam as a background, similar to the concept of snapchat and instagram filters. Our idea is that in each state of the canvas, our program will be able to identify the person’s body or head, and therefore start to draw and animate objects that move relative to the person’s body with some level of randomness. We imagine for one scene, the person can repel an object that moves around the screen with their hand. Another could just be simply drawing objects on top of certain parts of the picture using color analysis. The idea is that the user will be able to cycle through different scenes. Through this exploration, we hope to create a fun and interesting program that users can interact with for a while without getting bored.
Possible sketch of one scene animated on top of a webcam.
/* Ammar Hassonjee
ahassonj@andrew.cmu.edu
Section C
Project 11
*/
// global variables and arrays declared to hold objects
var traintracks =[];var tracky =0; //position of train tracks
var oases =[]; // array for oases objects
var trees =[]; // array for tree objects
functionsetup(){createCanvas(480,480); // for loop that pushed train track objects to array
for(var i =0; i <480; i +=20){
traintracks.push(makeTrainTracks(210, i)); // creates a random amount of oases to add to the oases array each time
// the program is loaded
if(i %240===0){ //random iteration
// variables initialized to pass as parameters for making the oases objects
var xloc =int(random(width /4));var yloc =int(random(height));var shade =int(random(200,255));var xsize =int(random(60,100));var ysize =int(random(100,150));
oases.push(makeOasis(xloc, yloc, shade, xsize, ysize));}}frameRate(20);}functiondraw(){background(250,245,200);fill(97,74,66);rect(200,0,10, height); // train track boundaries
rect(270,0,10, height); // train track boundaries
strokeWeight(1); // calling the track functions to continously move the tracks and add oases objects to canvas
updateTracks();removeTracks();addTracks(); // function called for drawing the train object
drawTrain();}
// updating the position of each track and oases in each of the arrays
functionupdateTracks(){ // for loop that calls train track objects and moves/displays them
for(var i =0; i < traintracks.length; i++){
traintracks[i].move();
traintracks[i].display();} // for loop that calls oases objects and moves/displays them
for(var j =0; j < oases.length; j++){
oases[j].move();
oases[j].display();} // for loop that calls tree objects and moves/displays them
for(var k =0; k < trees.length; k++){
trees[k].move();
trees[k].display();}}functionaddTracks(){var position = traintracks[traintracks.length -1].y; // initializing traintracks position
traintracks.push(makeTrainTracks(210, position +20)); // adding a traintracks object to the end of the array
var chance =int(random(0,40)); // making sure the chance of appending an oases object is low
if(chance ===2){ // variables declared as parameters to pass to the oases object
var xloc =int(random(width /4));var yloc = height;var shade =int(random(200,255));var xsize =int(random(40,60));var ysize =int(random(100,400));
oases.push(makeOasis(xloc, yloc, shade, xsize, ysize));} // varying the chance of the trees appearing
var chance2 =int(random(0,25));if(chance2 ===4){ // making sure the trees appear on both sides of the tracks
var xpo =int(random(180)); // xvariable for first half of the canvas
var ypo = height;var treeColor =int(random(100,255));var treeSize =int(random(20,40));
trees.push(makeTree(xpo, ypo, treeSize, treeColor));}elseif(chance ===6){var xpo =int(random(300, width)); // x variable for second half of the canvas
var ypo = height;var treeColor =int(random(100,255));var treeSize =int(random(20,30));
trees.push(makeTree(xpo, ypo, treeSize, treeColor));}}functionremoveTracks(){ // creating a duplicate array to keep track objects that are within the canvas
var trackKeep =[];for(var i =0; i < traintracks.length; i++){if(traintracks[i].y >-10){
trackKeep.push(traintracks[i]);}}
traintracks = trackKeep; // reassigning the tracks array to the duplicate array
// creating a duplicate array to keep track objects that are within the canvas
var oasesKeep =[];for(var i =0; i < oases.length; i++){if(oases[i].y >-40){
oasesKeep.push(oases[i]);}}
oases = oasesKeep; // reassigning the oases array to the duplicate array
// creating a duplicate array to keep track objects that are within the canvas
var treeKeep =[];for(var i =0; i < trees.length; i++){if(trees[i].y >-40){
treeKeep.push(trees[i]);}}
trees = treeKeep; // reassigning the trees array to the duplicate array
}functiontrackMove(){ // moving the position of each track and oases object
this.y -=10;}functiontrackDisplay(){ // displaying each track object with rectangles
strokeWeight(1);fill(97,74,66);rect(this.x,this.y,60,10);}functionmakeTrainTracks(xpos, ypos){ //object for making traintrack
var trck ={x: xpos, y: ypos, move: trackMove,
display: trackDisplay}return trck;}functionmakeOasis(xco, yco, color, xscale, yscale){ //object for making oases
var oasis ={x: xco, y: yco, move: trackMove,
display: oasisDisplay, tone: color,
size1: xscale, size2: yscale};return oasis;}functionoasisDisplay(){ // displaying the oases objects as an ellipse
fill(0,this.tone,this.tone);noStroke();ellipse(this.x,this.y,this.size1,this.size2);strokeWeight(1);stroke(0);}functionmakeTree(xp, yp, xsize, colour){ //function for making tree objects
var tree1 ={x: xp, y: yp, move: trackMove, display: treeDisplay,
tone: colour, size1: xsize};return tree1;}functiontreeDisplay(){ // displaying the tree objects by drawing from parameters
noStroke();fill(0,this.tone,0);ellipse(this.x,this.y,this.size1 *1.5);fill(0,this.tone -50,0);ellipse(this.x,this.y,this.size1);}functiondrawTrain(){ // drawing the train object as a static image
noStroke();fill(200,100,100);rect(207,220,67,160);rect(207,390,67,160);strokeWeight(4);stroke(0);noFill()rect(230,382,20,7);strokeWeight(2);rect(220,230,40,120);rect(220,410,40,120);}
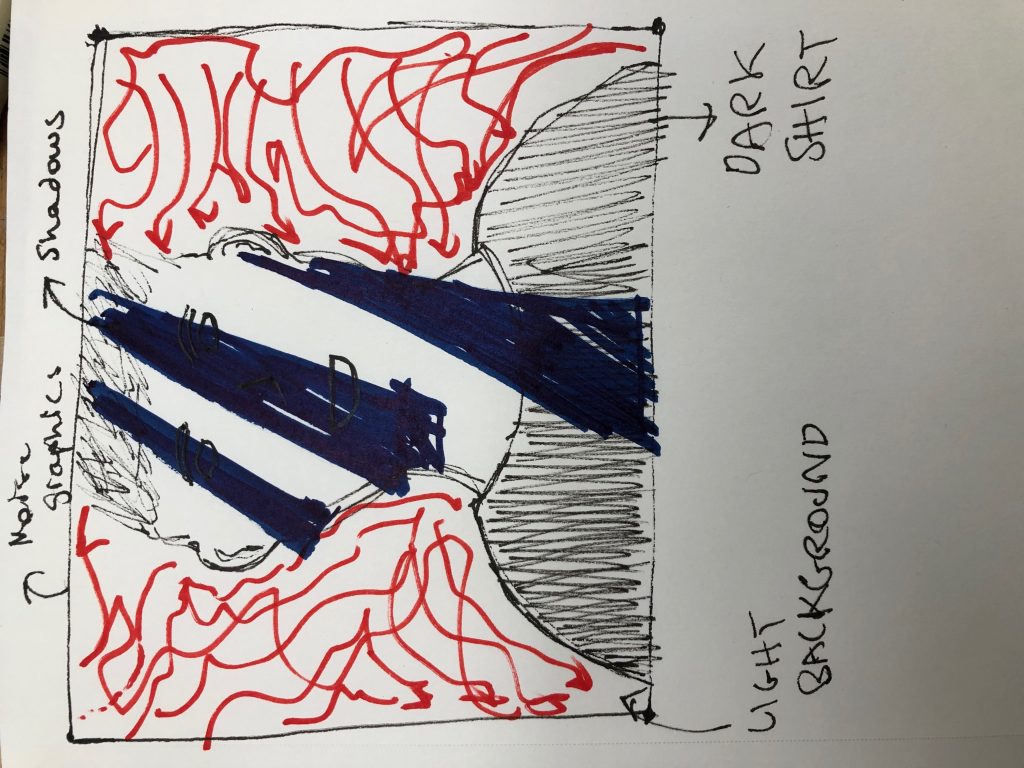
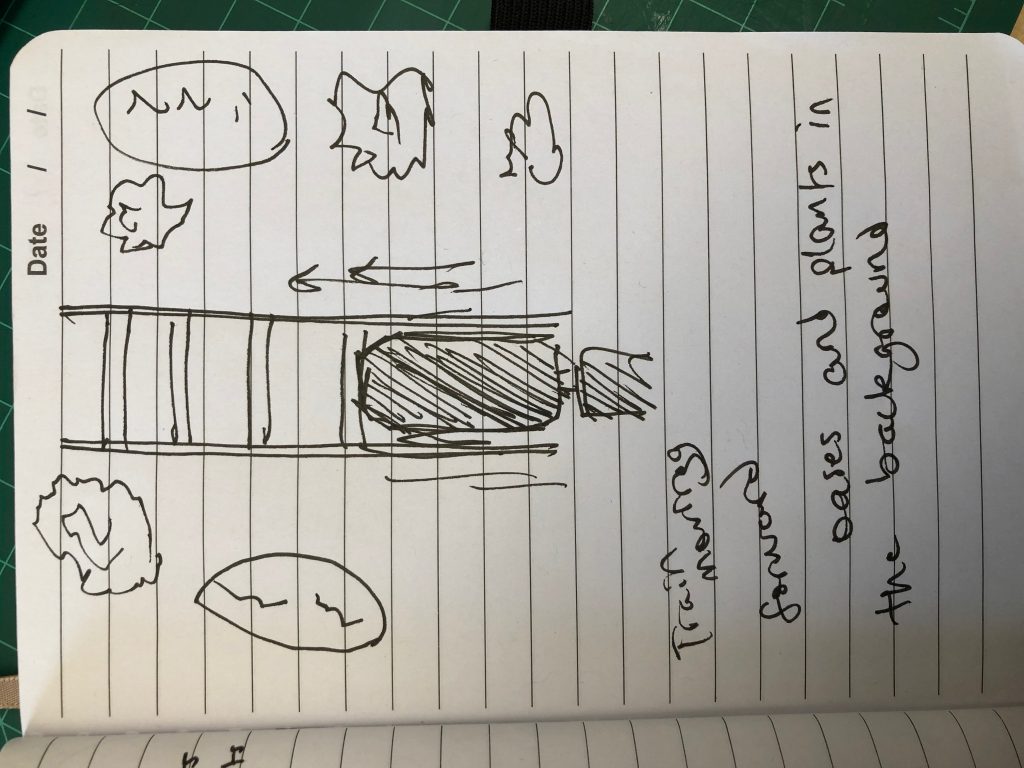
For this project, I chose to animate an aerial view over a train moving across a desert. I’ve always been interested in Wild West type scenes, so the image of a train moving past oases and small little cacti is one that stood out to me. I attached a sketch of my thought process at the bottom.
“Moving Image” from the Transfer Gallery in LA. This is from the Augmented Wallpaper project by Claudia Hart.
For this post, I chose to focus on the work of an artist named Claudia Hart. She uses technology to make explorations with the recurring theme of “identity art”, in which her work explores body issues, perception, and the relationship between nature and technology. She studied art history at NYU and a Masters of Architecture from Columbia, and then taught 3D art exploration at the School of Art Institute in Chicago. She currently works out of New York and Chicago.
A project of hers that I chose to focus on is her exploration of a series of Augmented Reality wallpapers that display captivating images of art. Over these wallpapers, viewers can use their smartphones to overlay different images and animations over the wallpapers. The animations themselves are embedded in code in the app that activates when the camera moves over the wallpaper. A link to her project can be found here.
A video showing the how the animation layer is on top of the wallpapers.
// USE BROWSER OTHER THAN CHROME TO PLAY
// I didn't have to set up a terminal to run my code but you might
// need to set up one in order to run the index
// My audio files for the cackle and bat dance were longer, but I had to trim
// them down in order to make my folder size smaller.
/* Ammar Hassonjee
ahassonj@andrew.cmu.edu
15104 Section C:
Project 10 - Sonic sketch
*/
// Global variables declared for the pong game
var ballx =0;var bally =250;var dir1 =1;var dir2 =1;var speedx =5;var speedy =3;
// variables for changing the background
var bluetone =0;var increment =1;var framecount =0;functionpreload(){ // call loadImage() and loadSound() for all media files here
// witch cackle sound loaded for ending the game
cackle =loadSound("https://courses.ideate.cmu.edu/15-104/f2019/wp-content/uploads/2019/11/cackleTrimmed.wav");
cackle.setVolume(0.5); // first type of bounce noise loaded
bounce =loadSound("https://courses.ideate.cmu.edu/15-104/f2019/wp-content/uploads/2019/11/bounce.wav");
bounce.setVolume(0.5); // background game music loaded
backMusic =loadSound("https://courses.ideate.cmu.edu/15-104/f2019/wp-content/uploads/2019/11/bat-danceTrimmed.wav");
backMusic.setVolume(0.5); // second type of bounce noise loaded
bounce2 =loadSound("https://courses.ideate.cmu.edu/15-104/f2019/wp-content/uploads/2019/11/shootingStar.wav");
bounce2.setVolume(0.5);}functionsetup(){createCanvas(480,480); //======== call the following to use sound =========
useSound(); // beginning to play the background music
backMusic.play()}functionsoundSetup(){ // setup for audio generation
// I've included an empty soundSetup function because
// the code doesn't run without it for some reason
}functiondraw(){ // changing the game background to a gradient
bluetone += increment;if(bluetone ===255){
increment =-1;}if(bluetone ===0){
increment =1;}background(0,0, bluetone);ellipse(ballx, bally,60,60);
ballx += dir1 * speedx;
bally += dir2 * speedy; // Making ball bounce off the right
if(ballx >=(width -30)){
dir1 =-dir1; // Playing the first bounce noise once the ball hits the wall
bounce.play();} // Making the ball bounce off the top and bottom
if(bally >=(height -30)|| bally <30){
dir2 =-dir2; // Playing the first bounce noise once the ball hits the wall
bounce.play();} // Making the ball bounce using the mouse
if(ballx < width /2& dir1 ===-1){if(dist(mouseX, mouseY, ballx, bally)<30){
speedY =random(-10,10);
dir1 =-dir1; // Playing the second bounce noise once the ball hits the mouse
bounce2.play();}} // Getting the background music to loop continuously
framecount++;if(framecount %300===0){
backMusic.play();}if(ballx <0){ // Playing the sinsister cackle to indicate you lost the game
cackle.play();
backMusic.stop();textSize(20);textAlign(CENTER);fill(255);text("Uh-oh. Better luck next time.", width /2, height /2);noLoop();}}
For this project, I was inspired by the pong game we had made earlier, and I wanted to add sound to make it a more interesting like game. I added background music that loops continuously, a bounce sound effect for when the ball bounces off the walls and a different noise when the user touches the ball. Then I also added a cackle to indicate the game is over when the ball touches the left side.
The project related to computer music I chose to focus on is called Tune Table produced by a group of researchers Anna Xambo and Brigid Drozda. Tune Table is a tabletop, game like interface that is meant to teach users computer science related topics by allowing them to program their own musical compositions. Using blocks of code that utilize computer science elements like loops, users combine the blocks to make unique songs; when each block of code is placed on the table, cameras under the table interpret the block’s imprint on the bottom and output auditory and visual feedback. I like this project’s goal of utilizing music to teach computer science because it’s a fun way to learn something that is very mathematics based. I think the creator’s original goal of finding a link between computer science and musical outputs was achieved. The link to the paper describing the work can be found here.
/* Ammar Hassonjee
ahassonj@andrew.cmu.edu
Section C
Project 09
*/var underlyingImage;var theColorAtLocationXY;
// Variable for adjusting the frame rate
var frames =100;functionpreload(){var myImageURL ="https://i.imgur.com/o4lm5zF.jpg";
underlyingImage =loadImage(myImageURL);}functionsetup(){createCanvas(480,480);background(0);
underlyingImage.loadPixels();}functiondraw(){ // Changing the frame rate each time draw is called
frameRate(frames); // Initial variables declared to return pixel from image at random location
var px =random(width);var py =random(height);var ix =constrain(floor(px),0, width-1);var iy =constrain(floor(py),0, height-1); // Getting the color from the specific pixel
theColorAtLocationXY = underlyingImage.get(ix, iy); // Varying the triangle size and rotation for each frame based on
// the pixel distance from the mouse
var triangleSize =map(dist(px, py, mouseX, mouseY),0,480*sqrt(2),1,10);var triangleRotate =map(dist(px, py, mouseX, mouseY),0,480*sqrt(2),0,180);noStroke();fill(theColorAtLocationXY); // rotating the triangle at each pixel
push();translate(px, py);rotate(degrees(triangleRotate));triangle(0,0, triangleSize *2,0, triangleSize, triangleSize);}functionkeyPressed(){ // reducing the frame count each time a key is pressed
frames =constrain(int(frames *.5),1,10);}functionmousePressed(){ // increasing the frame rate each time the mouse is pressed
frames =constrain(int(frames *2),1,1000);}
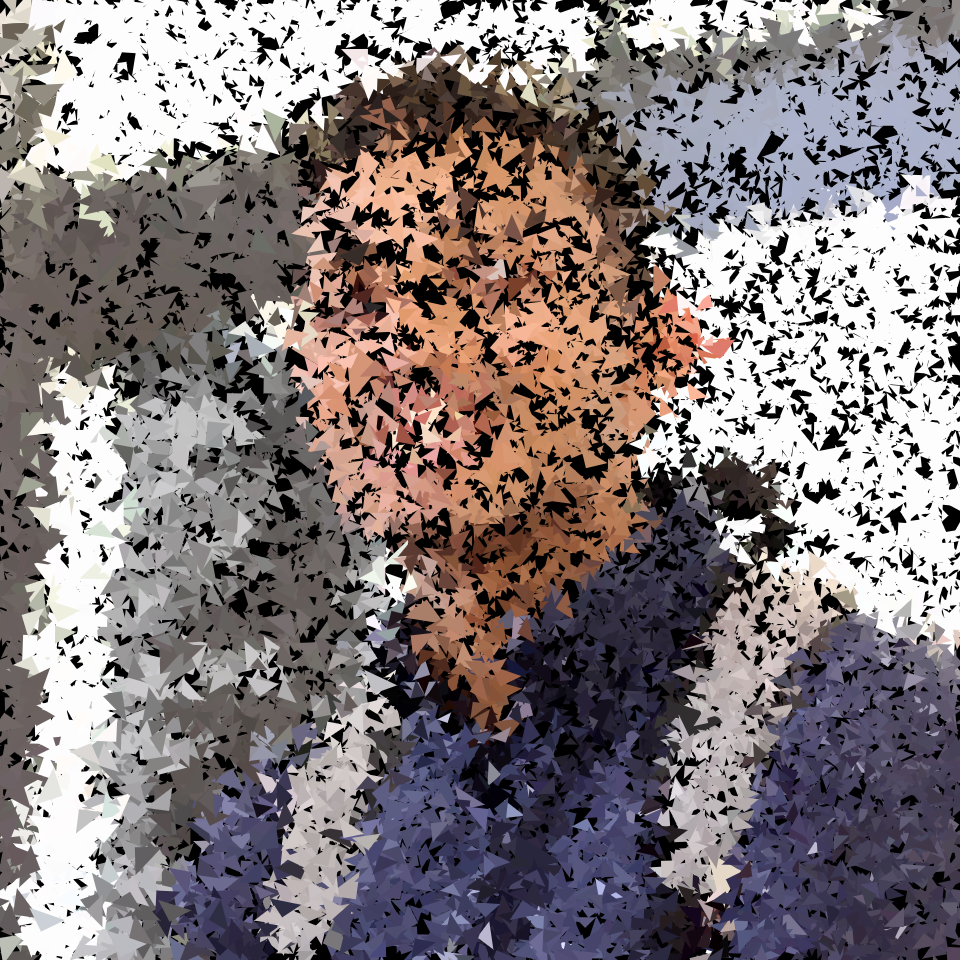
I was inspired to make an interactive self portrait that is based from my favorite shape, the triangle! By using the mouse to generate values, my program allows users to make my portrait more realistic or more distorted depending on where they keep the mouse. I think the combinations of rotation and triangle size create really interesting renditions of my selfie.
Original photo used for image generation.An almost finished version of my computational portrait using the photo above. Image produced after 2 minutes.
For this Looking Outwards project, I chose to focus on my classmate Jai Sawkar’s Looking Outwards 07 post. In this post, he talks about a project called Phantom Terrains created by Frank Swain and Daniel Jones which is an abstract representation of the data streams around us and is an attempt to visualize the invisible flows of data that run from our devices to routers back to our devices. The algorithm that drives Phantom Terrains works by having wireless data streams be transferred to a hearing aid, which then interprets the data flows as audio representations and sound signals. The sound signals can then be visualized as a topographic like map then.
A sample image showcasing the auditory signals and graph at the bottom and the information visualization of the data stream at the top.
I agree with Jai’s point that the project is very interesting in that it’s a compelling graphic that visualizes something we might not necessarily be able to see. In fact, it requires us to use our other senses of hearing to create a graphical information representation. The link to the website can be found here.
Eyeo 2015 video lecture given by Reza Ali, a computational designer and artist from Los Angeles.
The person whose work I chose to look into is Syed Reza Ali. According to his website, Reza is a computational designer, software engineer, and spatial artist out of Los Angeles. He comes from an electrical engineering and computational design background and currently does his own studio work related to user experience and augmented reality platforms. I admire Reza’s workflow of combining artistic and creative theory with the technical aspects of logical and algorithmic thinking that he exhibits in his projects such as his YCAM 3D printed computational forms or his art installations for the Carbone Smolan Agency. He challenges himself to integrate all different kinds of software to add effects and layers of visualization to each of his projects, such as through combining modeling software like 3D Max with algorithmic coding done in C++.
In his presentation, Reza explains his unique design methodology and goes into detail about how he translates programming logical into generative physical forms. He uses the example work experience of his residency at Autodesk to expand on that. His use of captivating images, GIFS, and videos/simulations that project behind him on the screen, such as when he talks about his ofxUI Timeline or his Data Driven Design digital forms, really help enforce his presentation because he can directly reference the purpose of the project or show the audience the visual effect he was going for as opposed to just talking about it.
A project featured on Reza’s website that showcases his installations for the Carbone Smolan Agency.
/* Ammar Hassonjee
ahassonj@andrew.cmu.edu
Section C
Project 07
*/var nPoints =100;var angle =0;var angle2 =0;var angle3 =0;functionsetup(){createCanvas(480,480);}functiondraw(){background(map(mouseY,0, height,0,255),map(mouseY,0, height,0,255),map(mouseY,0, height,80,255));var a =map(mouseX,0, width,30,300);var b = a *(3/8);var c = a /8; // Drawing the deltoid curves
fill(180,0,0);push();translate(width /2, height /2);rotate(radians(angle));drawDeltoidCurve(a);
angle +=map(mouseX,0,480,2,10);pop(); // Varying the rotation angle
fill(0);push();translate(width /2, height /2);rotate(radians(angle2 *-1));drawDeltoidCurve(b);
angle2 +=map(mouseX,0,480,2,10);pop();fill(180,0,0);push();translate(width /2, height /2);rotate(radians(angle));drawDeltoidCurve(c);
angle +=map(mouseX,0,480,2,10);pop(); // Drawing the Ranunculoid curve with multiple iterations
push();translate(width /2, height /2);rotate(radians(angle3));drawRanunculoidCurve(40);drawRanunculoidCurve(20);drawRanunculoidCurve(37);
angle3 +=map(mouseX,0, width,.1,5);pop();} // Deltoid curve has parameter to alter size
functiondrawDeltoidCurve(value){ // http://mathworld.wolfram.com/DeltoidRadialCurve.html
var x;var y;noStroke(); // Drawing the first deltoid
beginShape();for(var i =0; i < nPoints; i++){var t =map(i,0, nPoints,0, TWO_PI); // curve equation
x =(1/3)* value *(2*cos(t)+cos(2* t));
y =(1/3)* value *(2*sin(t)-sin(2* t));vertex(x, y);}endShape(CLOSE);} // function has parameter to alter Ranunculoid curve size
functiondrawRanunculoidCurve(size){ // http:mathworld.wolfram.com/Ranunculoid.html
var x;var y; // Varying the strokeweight and color of the Ranunculoid curve
stroke(map(mouseY,0, height,0,255));strokeWeight(map(mouseX,0, width,10,0.1));noFill();beginShape();for(var i =0; i < nPoints; i++){var j =map(i,0, nPoints,0, TWO_PI); // Curve equation
x = size *(6*cos(j)-cos(6* j));
y = size *(6*sin(j)-sin(6* j));vertex(x, y);}endShape(CLOSE);}
When I first started this assignment, I was a little overwhelmed by the requirements and confused about how to translate mathematical curves into a graphic. Once I found two curves however with simple mathematical formulas, the ranunculoid and deltoid, I was able to build functions and then vary their parameters using the mouseX and mouseY variables to make an interesting drawing!
![[OLD FALL 2019] 15-104 • Introduction to Computing for Creative Practice](../../wp-content/uploads/2020/08/stop-banner.png)