Angela Lee – Project 7 – Curves

sketch

/*
 * Angela Lee
 * Section E
 * ahl2@andrew.cmu.edu
 * Project 7 Curves
 */

 function setup() {
    createCanvas(480, 480);
 }

 function draw() {
    frameRate(20);
    background(0);

    push();
    // functions start at the middle of the canvas
    translate(width/2, height/2);
    // functions rotate with mouseX
    rotate(map(mouseX, 0, 480, 0, TWO_PI)); 
    hypotrochoid();
    epitrochoid();
    astroid();
    pop();
}

function astroid() {
    noStroke();

    // colors change smoothly by milliseconds 
    r = 100 + 100 * sin(millis() / 1000.0);
    g = 150 + 40 * sin(millis() / 1000.0 + HALF_PI);
    b = 230 + 60 * sin(millis() / 1000.0 - HALF_PI);
    fill(r, g, b);

    // outer & inner radii depend on user's mouse
    a = map(mouseX, 0, width, 0, 100);
    b = map(mouseY, 0, height, 0, 100);

    // drawing the astroid
    beginShape();
    for (var i = 0; i < 2000; i ++ ) {
        // angle for astroid formula
        angle = map(i, 0, 2000, 0, TWO_PI);
        var x = pow(cos(angle), 3) * a;
        var y = pow(sin(angle), 3) * b;
        vertex(x, y);
    }
    endShape();
}

function hypotrochoid() {
    strokeWeight(1);
    fill(0);

    // colors change smoothly by milliseconds
    r = 230 + 60 * sin(millis() / 1000.0);
    g = 240 + 80 * sin(millis() / 1000.0 + HALF_PI);
    b = 155 + 90 * sin(millis() / 1000.0 - HALF_PI);
    stroke(r, g, b);

    // outer & inner radii depend on user's mouse
    a = map(mouseX, 0, width, 50, 150);
    b = map(mouseY, 0, height, 5, 10);
    h = map(mouseY, 0, height, 100, 200);

    // drawing the hypotrochoid
    beginShape();
    for (var i = 0; i < 2000; i ++) {
        // angle for hypotrochoid formula
        angle = map(i, 0, 2000, 0, TWO_PI);
        var x = (a - b) * cos(angle) + h * cos((a - b) / b * angle);
        var y = (a - b) * sin(angle) + h * sin((a - b) / b * angle);
        vertex(x, y);
    }
    endShape();
}


function epitrochoid() {
    strokeWeight(1);
    // fill allows it to have no overlap with hypotrochoid
    fill(0); 
    // color changes smoothly by milliseconds
    r = 50 + 20 * sin(millis() / 1000.0);
    g = 150 + 150 * sin(millis() / 1000.0 + HALF_PI);
    b = 230 + 120 * sin(millis() / 1000.0 - HALF_PI);
    stroke(r, g, b);

    // inner & outer radii depend on user's mouse
    a = map(mouseX, 0, width, 50, 100);
    b = map(mouseY, 0, height, 0, 3);
    h = map (mouseX, 0, width, 0, 25);

    // drawing the epitrochoid
    beginShape();
    for (var i = 0; i < 2000; i++) {
        angle = map(i, 0, 2000, 0, TWO_PI);
        var x = (a + b) * cos(angle) - h * cos((a + b) / b * angle);
        var y = (a + b) * sin(angle) - h * sin((a + b) / b * angle);
        vertex(x, y);
    }
    endShape();
}


For this project, I was interested in seeing how multiple curves could overlap, interact, or mirror each other’s movements. So, I made the rotation for all three curves the same, but each curve’s parameter depends on mouseX and mouseY a little differently. Although I liked seeing how the curves could overlap, it got a very visually chaotic sometimes when they did, so I wanted to make the order of the curves constant so one curve was always the smallest, etc. The last part I tweaked about my curves was making the curves go out of the canvas, because the composition looked very restrained otherwise.

Angela Lee – Looking Outwards – 07

The Atlas of Emotion as designed by Stamen Design, with 5 universal emotions.

The Atlas of Emotions by Dr. Paul Ekman in collaboration with Stamen Design intrigues me because of its subject on emotion. When I think of data visualization, I typically imagine quantitative data, and while this project did incorporate some quantitative data, the categorization of emotions is much more qualitative. I was intrigued by this project because of how layered the research was. Not only did the team investigate emotions, they conducted research on moods (vs. emotions), triggers, intensity of emotion, and all these factors came into play in their final data visualization. The visuals were largely based off of circles so their algorithms must include ellipses that gradually grow when mouseX, mouse Y in the vicinity. I think their artistic sensibilities manifested in using primitive shapes to represent emotions and story rather than more iconic representations. I really enjoyed how they combined words and visuals to tell a compelling, universal story.

Angela Lee – Project 06 – Abstract Clock

sketch

/*
 * Angela Lee
 * Section E
 * ahl2@andrew.cmu.edu
 * Project 6 Abstract Clock
 */

 function setup() {
    createCanvas(400, 400);
 }

 function draw() {

    // background
    var top = color(249, 237, 201); // pale yellow color
    var bottom = color(237, 165, 117); // peach color
    setGradient(top, bottom); // background gradient

    // time
    var hours = hour();
    var minutes = minute();
    var seconds = second();
    var milli = millis();

    // halo changes color with milliseconds
    halo(milli);

    // the shadow grows longer with hours
    setting(hours);
    
    // the drink color changes with minutes
    behindGls(minutes);
    
    // the foam bubbles move with milliseconds
    foam(milli);
    
    // the drink color changes with minutes
    frontGls(minutes);
    
    // the straw moves with the seconds
    straw(seconds);
 }

 // BACKGROUND GRADIENT
function setGradient(color1, color2) {
    for(var a = 0; a <= height; a++) {
      var amount = map(a, 0, height, 0, 1);
      var back = lerpColor(color1, color2, amount);
      stroke(back);
      line(0, a, width, a);
    }
}

// ----------BELOW THIS LINE ARE PIECES OF THE DRAWING -----------


// HALO AROUND LATTE
function halo(milli) {
    big = 300; // big circle size
    med = 245; // medium circle size
    small = 185; // small circle size
    x = width/2 // x position
    y = height/2 - 30; // y position

    r = 15 * sin(milli / 1000.0);
    g = 15 * sin(milli / 1000.0 + HALF_PI);
    b = 30 * sin(milli / 1000.0 - HALF_PI);

    stroke("white");
    strokeWeight(1);
    fill(249 + r, 240 + g, 155 + b);
    ellipse(x, y, big, big);

    strokeWeight(2);
    fill(250 + r, 237 + g, 130 + b);
    ellipse(x, y, med, med);

    strokeWeight(3);
    fill(252 + r, 240 + g, 84 + b);
    ellipse(x, y, small, small);
}

// TABLE, SHADOW
function setting(hours) { 

    // table
    noStroke();
    fill(133, 88, 51);
    rect(0, 2/3 * height, width, height/3);
    
    // shadow
    fill(112, 67, 34);
    shadowW = map(hours, 0, 24, 160, 240);
    ellipse(240, 321, shadowW, 65);
}


// FIRST LAYERS OF LATTE
function behindGls(minutes) {
    // glass
    glsX = 119.799; // glass x-coordinate
    glsY = 148.193; // glass y-coordinate
    glsW = 160.403; // glass width
    glsH = 169.456; // glass height
    glsEllipseH = 50.513; // glass ellipse height

    fill(231, 239, 242);
    rect(glsX, glsY, glsW, glsH);
    ellipse(glsX + glsW / 2, glsY + glsH, glsW, glsEllipseH);

    // drink
    var clrChange = map(minutes, 0, 60, 0, 40);
    Green = color(197 - clrChange, 201 - clrChange, 125 - clrChange);
    drnkX = 128.906; // drink x-coordinate
    drnkY = 148.193; // drink y-coordinate
    drnkW = 142.071; // drink width
    drnkH = 165.456; // drink height

    drnkEllipseY = 313.65; // bottom of glass ellipse y-coordinate
    drnkEllipseH = 40.477; // bottom of glass ellipse height

    fill(Green);
    rect(drnkX, drnkY, drnkW, drnkH);
    ellipse(drnkX + drnkW / 2, drnkEllipseY, 
        drnkW, drnkEllipseH);
}

// FRONT LAYERS OF LATTE
function frontGls(minutes) {
    clrChange = map(minutes, 0, 60, 0, 50);
    // TOP GLASS ELLIPSE
    fill(231, 239, 242);
    ellipse(glsX + glsW / 2, glsY, glsW, glsEllipseH);

    // GREEN TOP ELLIPSE
    fill(166 - clrChange, 180 - clrChange, 76 - clrChange);
    ellipse(glsX + glsW / 2, glsY, drnkW, drnkEllipseH);
}

// FOAM
function foam(milli) {
    foamH = 41.592;

    // body of the foam
    fill(246, 249, 220);
    rect(drnkX, drnkY, drnkW, foamH);
    ellipse(drnkX + drnkW/2, drnkY + foamH, drnkW, drnkEllipseH);
    ellipse(164.455, 203.479, 34.55, 25.72);
    ellipse(206.343, 210.407, 62.807, 26.791);
    ellipse(239.538, 202.514, 34.55, 25.72);

    // big bubbles
    fill(197, 201, 125);
    bigBbl = 5; // size of big bubbles
    bigBblX = [143, 163, 180, 216, 219, 245, 253]; // big bubble x values
    bigBblY = [174, 195, 194, 208, 190, 200, 183]; // big bubble y values
    change = sin(map(milli, 0, 60, 0, 1)); 
    // the big bubbles move left and right depending on milliseconds
    for (var i = 0; i < bigBblX.length; i++) {
        ellipse(bigBblX[i] + change, bigBblY[i] + change, bigBbl, bigBbl);
    }

    // small bubbles
    fill(216, 216, 160);
    smlBbl = 5; // size of big bubbles
    smlBblX = [156, 170, 212, 239, 245]; // small bubble x values
    smlBblY = [203, 181, 194, 203, 177]; // small ubble y values
    // the small bubbles move left and right depending on milliseconds
    for (var i = 0; i < smlBblX.length; i++) {
        ellipse(smlBblX[i] - change, smlBblY[i] - change, smlBbl, smlBbl);
    }
}

// STRAW
function straw(seconds) {
    strX = map(seconds, 0, 60, 141, 218.587); // straw x-coordinate
    strY = 210.407; // straw y-coordinate
    strW = 12.49; // straw width
    strH = 94.115; // straw height

    strEllipseH = 4.065; // ellipse straw height
    fill("white");
    rect(strX, strY - 150, strW, strH);
    ellipse(strX + strW/2, strY - 150 + strH, strW, strEllipseH);
    ellipse(strX + strW/2, strY - 150, strW, strEllipseH);

    // shadow within the straw
    fill(232, 232, 232);
    ellipse(strX + strW/2, strY - 150, strW - 2, strEllipseH - 1);
}

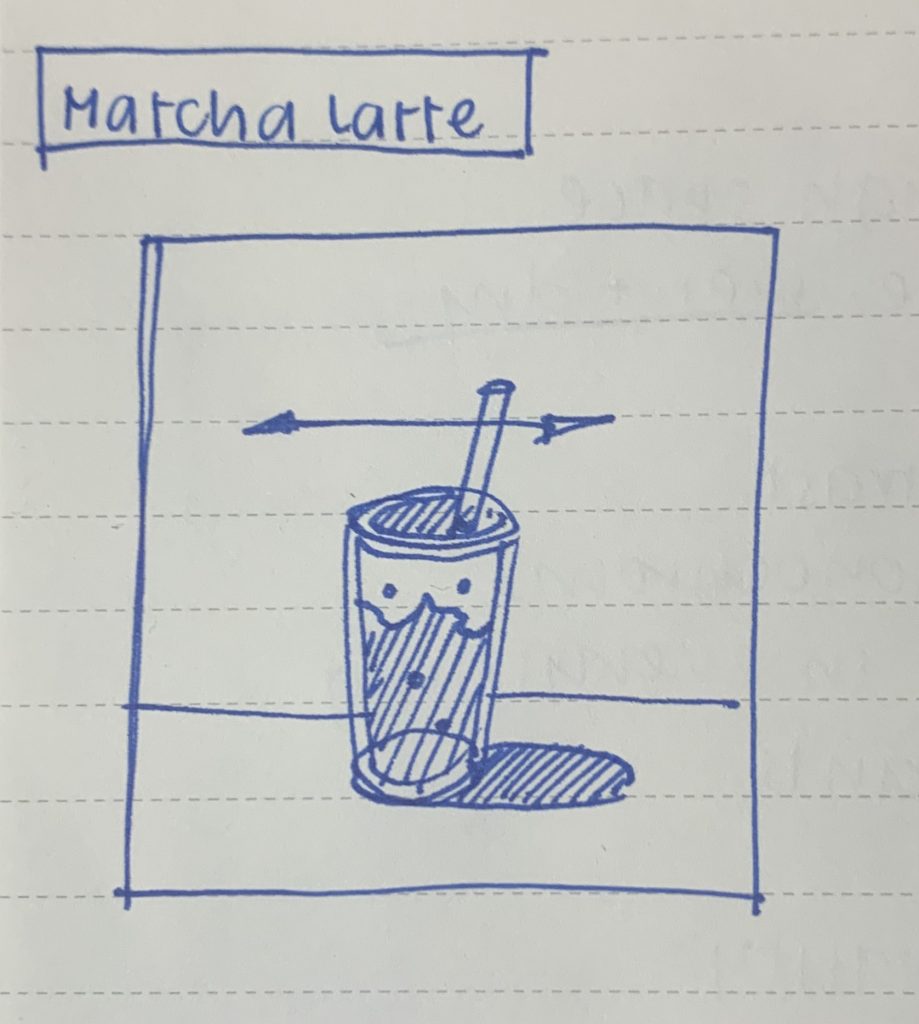
As I was sitting down to plan out my abstract clock, I was craving a matcha latte so I decided to make that the main visual of my clock. I wanted to create a piece that represented time in a more abstract manner, so I decided to make parts of my matcha latte move or change in accordance to different time variables. To plan out my piece, I first sketched out my matcha latte.

As I began to code the composition, I realized that I wanted more contrast between the latte and the background. So, I added a couple of halo-like ellipses to establish a focal point around the latte.

Angela Lee – Looking Outwards – 06

A still of one of the randomized outcomes when you press the canvas of Matt Deslauriers Generative Art.

Matt Deslauriers has created computational art that randomizes a “seed” based on where the user clicks, and an art piece render in real time from that seed/origin. To do this, he has combined code from Node.js and HTML. I admire the surprise element of his piece; although you know the seed will be placed every time you click, the color and form of the art that emerges change every time so you feel pleasantly surprised. To do so, the code randomizes the colors and forms that emerge from that middle seed. In his blog post, he addresses how his rendering algorithm is based on an old approach for a project called Generative Impressionism, where the particles are reset to random positions and rendered as line segments moving towards a direction. I think his artistic sense shined in his use of color. He sourced 200 of the most popular color palettes from ColourLovers.com API. Though he didn’t come up with the color schemes himself, I think it was wise for him to source the most popular color palettes because they gave a cohesive and appealing approach to color. His artistic sensibilities also manifested in the constancy of the piece. He was able to find a delicate balance between randomness and constancy that allowed the viewers to feel delighted without confusing or completely shocking the viewer. 

Angela Lee – Looking Outwards – 05

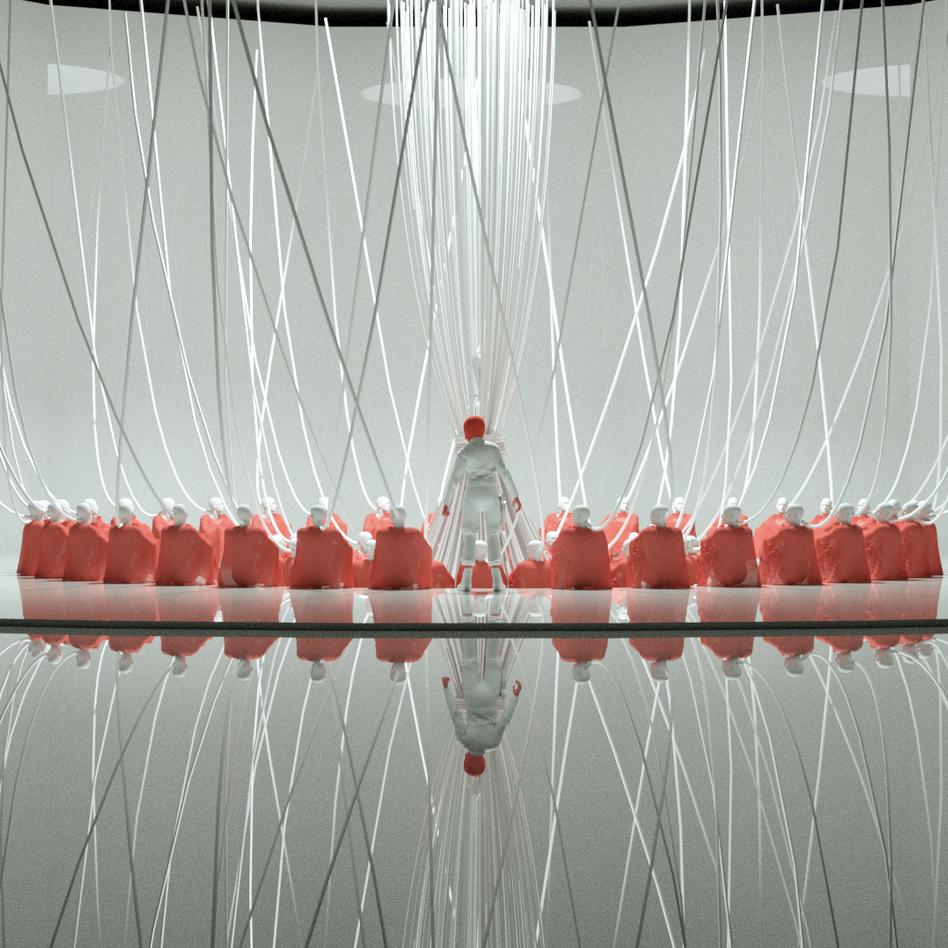
A part of his Ghost in the Shell inspired 3D artwork, can be found: https://www.zolloc.com/gits
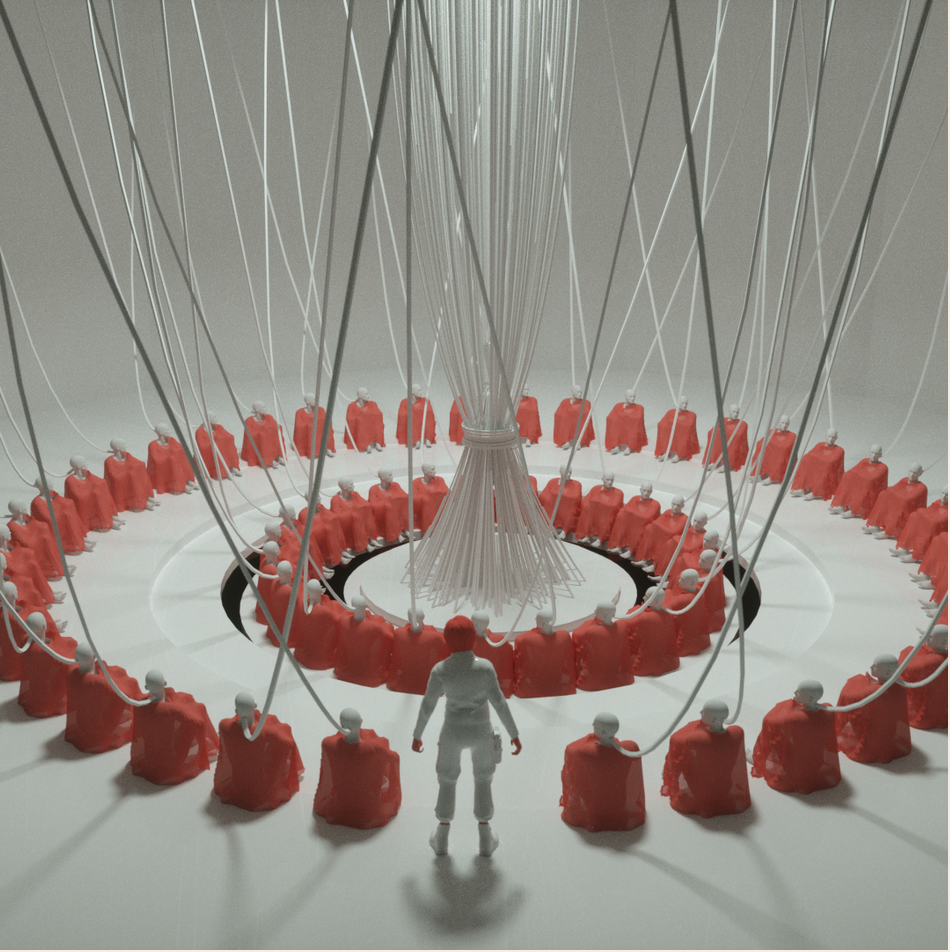
Another angle of the same subject inspired by Ghost in the Shell. Again, found this at: https://www.zolloc.com/gits

His images were unable to be embedded, so I screenshotted them and pasted the link below.

I have always been intrigued by Hayden Zezula, @zolloc on Instagram, whose work often warps humanoid figures with 3D abstract objects. On his portfolio, I particularly enjoyed his work inspired by the famous manga “Ghost in the Shell.” In this project, I admire his use of a minimal color palette—every hue he uses is very intentional and creates a thoughtful contrast against other objects. Additionally, his humanoid forms are recognizable and relatable as a human, but also not specific enough to alienate viewers. In general, I think that his graphic style is very thought-provoking and allows viewers to use their imagination to build a story around his work. While I’m not sure about the algorithms used to generate his work, I think that he must have used some centering functions and loops to create the circular formation of the humanoids.

Angela Lee – Project 05 – Wallpaper

sketch

/*
 * Angela Lee
 * Section E
 * ahl2@andrew.cmu.edu
 * Project 5 Wallpaper
 */

// spacing between circles
var spacing = 200;

function setup() {
    createCanvas(600, 600);
    var orangeBack = color(241, 94, 39); // orange color
    var blueBack = color(69, 95, 172); // blue color
    setGradient(orangeBack, blueBack); // background gradient
}

function draw() {
    // y position for loop
    for (var y = 50; y <= height - 50; y += spacing) {
        // x position for loop
        for (var x = 50; x <= width - 50; x += spacing) {
            // calling the two functions for drawing the circles
            orangeCircles(x, y);
            blueCircles(x, y);
        }
    }
}

// Function for creating my gradient background
function setGradient(color1, color2) {
    for(var a = 0; a <= height; a++) {
      var amount = map(a, 0, height, 0, 1);
      var back = lerpColor(color1, color2, amount);
      stroke(back);
      line(0, a, width, a);
    }
}

// Orange circle function
function orangeCircles(x, y) {
    noStroke();
    //outer circle
    fill(241, 94, 39);
    ellipse(x, y, 100, 100);

    // second-most outer circle
    fill(243, 109, 66);
    ellipse(x, y, 75, 75);

    // third-most outer circle
    fill(241, 135, 101);
    ellipse(x, y, 50, 50);

    // inner circle
    fill(248, 161, 117);
    ellipse(x, y, 25, 25);
}

// Blue circle function
function blueCircles(x, y) {
    noStroke();
    // blue circles are shifted right and down
    x = x + 100;
    y = y + 100;

    //outer circle
    fill(69, 95, 172);
    ellipse(x, y, 100, 100);

    // second-most outer circle
    fill(87, 114, 183);
    ellipse(x, y, 75, 75);

    // third-most outer circle
    fill(114, 141, 199);
    ellipse(x, y, 50, 50);

    // inner circle
    fill(147, 173, 218);
    ellipse(x, y, 25, 25);
}

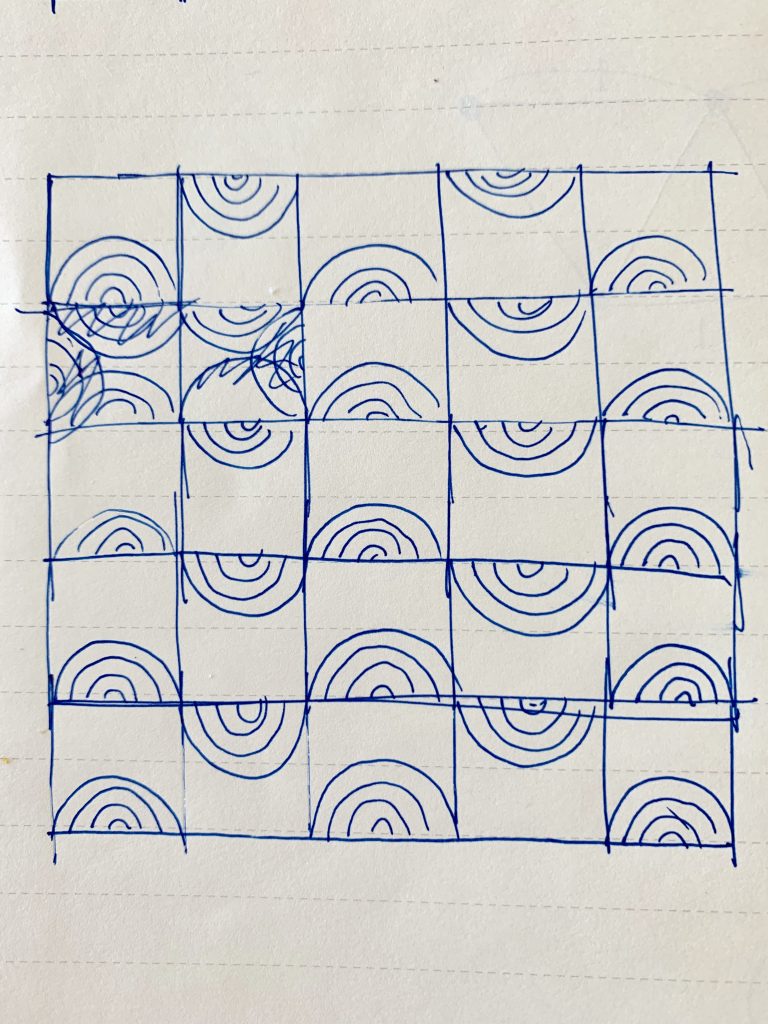
I personally love playing with complementary colors, so I wanted to experiment more with complementary contrasts in the wallpaper. In my initial plan, I sketched out semicircles, but I didn’t like how they created harsh edges in the composition. I chose the colors blue and orange and created circular patterns with them. I also wanted to try playing with gradients, so for the background, I created a smooth gradient and for the circles, I created gradient intervals of colors. I alternated between orange and circle to create a balance of colors.

Angela Lee – Project – 04

sketch

/*
 * Angela Lee
 * Section E
 * ahl2@andrew.cmu.edu
 * Project 4 String Art
 */

function setup() {
    createCanvas(400, 300);
    background("black");
}

function draw() {
    spacing1 = 40;
    spacing2 = 10;
    spacing3 = 5;
    red = mouseX;
    green = mouseX;
    blue = mouseY

    // LOOP FOR OUTERMOST STRINGS
    // the strings span the boundary of the canvas
    for(var a = 0; a <= 400; a += spacing1){
        // left bottom strings
        stroke(red, 0, 162);
        line(0, a, a, 300);

        // right top strings
        stroke(153, green, 0);
        line(400, a, a, 0);
    }

    // LOOP FOR GREEN, BLUE STRINGS
    // the strings are contained by the outermost strings 
    for(var b = 0; b <= 200; b += spacing2){
        stroke(0, 187, mouseY);
        // left top strings
        line(100 + b, 50, 100, 250 - b);
        // right top strings
        line(100 + b, 250, 300, 250 - b);
    }

    // LOOP FOR INNERMOST SQUARE
    // the strings are contained within a box 
    // the box specs: rect(150, 100, 100, 100)
    for(var a = 0; a <= 100; a += spacing3){
        // bottom left
        stroke(red, green, 162);
        line(150, 100 + a, 150 + a, 200);

        // top left
        stroke(150, green, blue);
        line(150 + a, 100, 150, 200 - a);

        // top right
        stroke(red, 150, blue);
        line(150 + a, 100, 250, 100 + a);

        // bottom right
        stroke(red, 100, blue);
        line(250, 100 + a, 250 - a, 200);

    }


}

For this project, I wanted to make a composition that had a fixed form but some element that was controlled by the user. I stuck to a strict geometry that relied on square and rectangle boundaries but allowed the colors of the strings to change based on the users’ mouse position.

Some of my notes when planning: first, it took me a while to understand how to program the string curves nicely. Then, I planned out the composition I wanted in my final piece.

Angela Lee—Looking Outwards—04

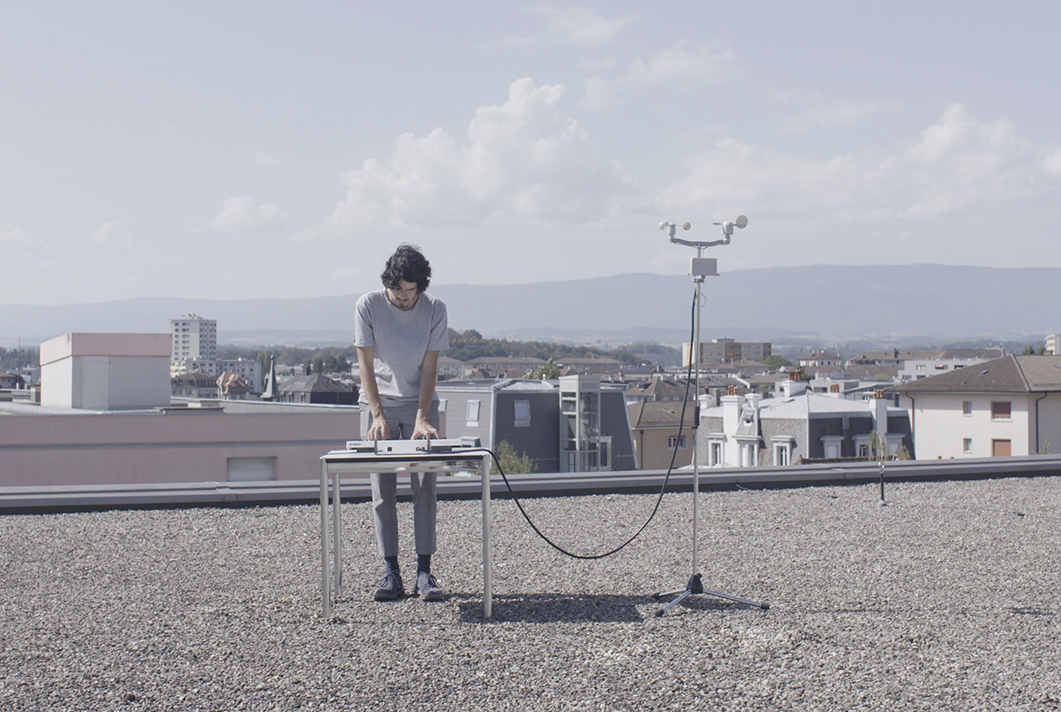
Adrien Kaeser, the creator of “Weather Thingy,” using his own device.
The interface of the device, which allows users to amplify or reduce the composition.

“Weather Thingy,” designed by Adrien Kaeser controls musical instruments using real time climate-related events that are collected/measured by a rain gauge, wind vane, and anemometer. Users also have some control over the piece, and can choose to amplify or reduce some of the output through the device. What I enjoy about this piece is that it allows people to take in information through the sense of hearing. I also appreciate how the visual design was intuitive through its use of colors and form because it shows how he thoughtful he was in considering how the user would interact and perceive the device itself. As a design student, I’ve created data visualizations and know how challenging they are, and this reminds me of a data visualization but done in an audio form. I’m not sure how Kaeser structured his algorithm, but I think it would make sense if he had defined variables that helped determine how chaotic or serene the composition based on the climate in real time. 

Angela Lee – Project – 03

angela-dynamic-drawing

/*
 * Angela Lee
 * Section E
 * ahl2@andrew.cmu.edu
 * Assignment-03
 */

// variables for x & y position of circle following cursor
var x = 300;
var y = 300;
var diffx = 0;
var diffy = 0;


function setup(){
	createCanvas(640, 480);
}

function draw(){
    // defining variable for distance from mouse position to center
    mouseDist = dist(mouseX, mouseY, width/2, height/2);
    // width and height of the circles
    circle = 80 + mouseDist/6;
	background(0);
    noStroke();

    // small white circle following the mouse
    diffx = mouseX - x;
    diffy = mouseY - y;
    x = x + 0.2 * diffx;
    y = y + 0.2 * diffy;
    fill ("white");
    ellipse(x, y, 20, 20);

    // middle square
    push();
    translate(320, 240);
    rectMode (CENTER);
    rotate(radians(mouseDist));
    fill(mouseX, mouseY, 100);
    rect(0, 0, 15, 15);
    pop();

    // TOP CIRCLE
    // red, yellow values change based on mouse's x and y position
    fill(mouseX, mouseY, 150);
    // ellipse goes top based on mouse's distance from center
    ellipse(320, 114 - mouseDist/2, circle,
     circle);

    // RIGHT CIRCLE
    // green, blue values change based on mouse's x and y position
    fill(242, mouseX, mouseY);
    // ellipse goes right based on mouse's distance from center
    // ellipse gets bigger as mouseDist gets bigger
    ellipse(445 + mouseDist/2, 240, circle,
     circle);

    // LOWER CIRCLE
    // red, green values change based on mouse's x and y position
    fill(mouseX, mouseY, 40);
    // ellipse goes bottom based on mouse's distance from center
    // ellipse gets bigger as mouseDist gets bigger
    ellipse(320, 365 + mouseDist/2, circle,
     circle);

    // LEFT CIRCLE
    // red value changes based on mouse's x position
    fill(mouseX, 13, 174);
    // ellipse goes left based on mouse's distance from center
    // ellipse gets bigger as mouseDist gets bigger
    ellipse(195 - mouseDist/2, 240, circle,
     circle);

    // TOP RIGHT SQUARE
    push();
    // translate origin to where the square is, based on mouseDist
    translate(407.5 + mouseDist/5, 151 - mouseDist/5);
    // rotate the square from its center as it moves
    rectMode(CENTER);
    rotate(radians(mouseDist));
    fill(23, 250, 255);
    rect(0, 0, 50, 50);
    pop();

    // BOTTOM RIGHT SQUARE
    push();
    // translate origin to where the square is, based on mouseDist
    translate(407.5 + mouseDist/5, 328.5 + mouseDist/5);
    // rotate the square from its center as it moves
    rectMode(CENTER);
    rotate(radians(-mouseDist));
    fill(141, 29, 221);
    rect(0, 0, 50, 50);
    pop();

    // BOTTOM LEFT SQUARE
    push();
    // translate origin to where the square is, based on mouseDist
    translate(231 - mouseDist/5, 328.5 + mouseDist/5);
    // rotate the square from its center as it moves
    rectMode(CENTER);
    rotate(radians(mouseDist));
    fill(255, 169, 210);
    rect(0, 0, 50, 50);
    pop();

    // TOP LEFT SQUARE
    push();
    // translate origin to where the square is, based on mouseDist
    translate(231 - mouseDist/5, 151 - mouseDist/5);
    // rotate the square from its center as it moves
    rectMode(CENTER);
    rotate(radians(-mouseDist));
    fill(7, 57, 239);
    rect(0, 0, 50, 50);
    pop();
}


This project helped me really understand the mechanisms of push, pop, and translation in the context of rotation. I think it was tricky to figure out how to make things rotate a certain place (e.g. rotate on its center while the position of the object changed places depending on the user). I also think that proportion was especially important for me in this exercise. While most of my user interaction was based on how far the cursor was from the center of the canvas, determining how fast something was moving or big something got depended on a fraction of that distance.

Angela Lee — Looking Outwards —03

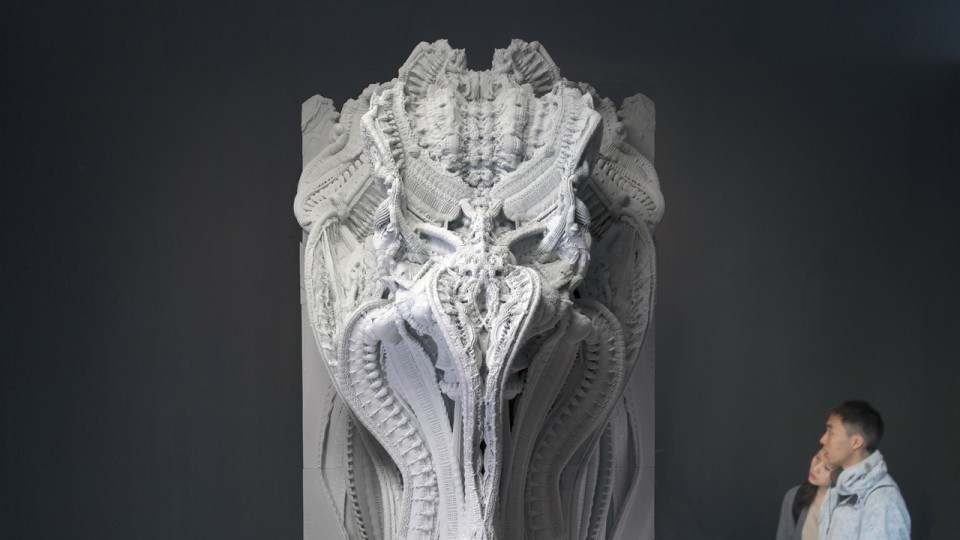
“The Arabesque Wall” in relation to viewers, photo from Benjamin Dillenburger’s website.
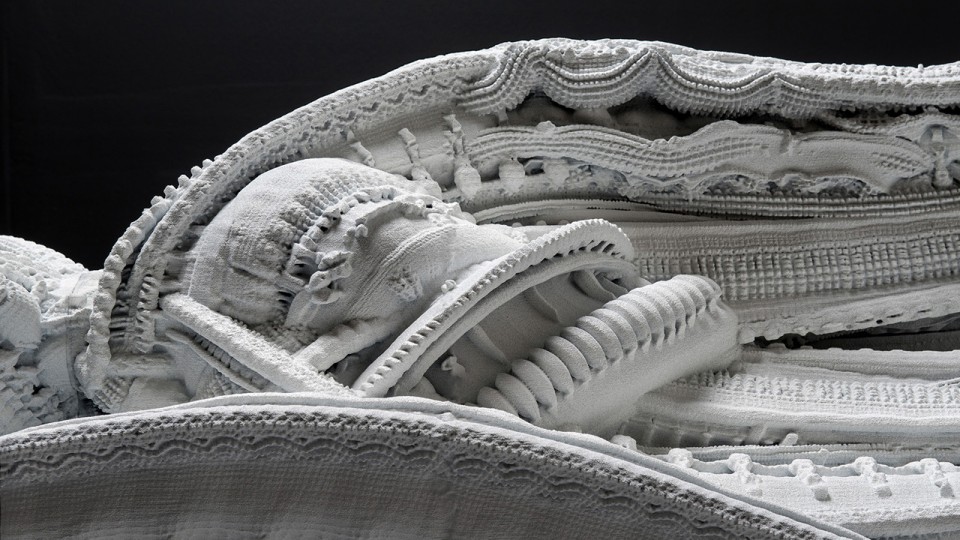
Details of “The Arabesque Wall” by Benjamin Dillenburger, sourced from his website.

“The Arabesque Wall,” created by Benjamin Dillenburger in collaboration with Michael Hansmeyer, is an ornate, 3D printed wall generated with algorithmic geometry. This piece was particularly interesting to me because of how it pays homage to elaborate, arabesque historical architectural trends while also appealing to modern users. I think that modern design trends are often associated with simplicity and efficiency, yet this wall breaks those assumptions with its delicate curves and excessive details. In his website, Dillenburger explains how the algorithm used to create this piece was geometric, mathematical, but iterative; these qualities allow for a sense of cohesiveness throughout the piece but also completely unique tiles, which add to the richness and wonder elicited by the wall. What excites me about this piece also is how 3D printing was used to create such a physically complex design. “The Arabesque Wall” not only transcends modern paradigms surrounding aesthetics and designs but also opens my eyes to the possibilities of what can be created using 3D printing