Chelsea Fan-Project 07-Curves

Curves

/* Chelsea Fan
Section 1B
chelseaf@andrew.cmu.edu
Project-07
*/

function setup() {
    createCanvas(480, 480);
}

function draw() {
    background(mouseX/2, width/2, 255);
    drawHypocycloid1(); //draw hypocloid 1
    drawHypocycloid2(); //draw hypocycloid 2
}

function drawHypocycloid1() {
	//constrain mouse values to only affect when on canvas
	var x = constrain(mouseX, 0, width);
	var y = constrain(mouseY, 0, width); 
    noFill(); //no fill color
    strokeWeight(2); //line thickness
    stroke(width-mouseX); //stoke color changes based on mouseX

    //Hypocycloid 1
	push();
	translate(width/2, height/2); //begin at center of canvas
	var a = map(mouseX, 0, width, 0, 100);
	var b = map(mouseY, 0, height, 0, 100);
	beginShape();
	    for (var i = 0; i<=100; i++) {
    	    var t = map(i, 0, 100, 0, TWO_PI); //angle variable
    	    //hypocycloid1 equations
    	    x = (a+b)*cos(t) + b*cos((a+b)*t); 
    	    y = (a+b)*sin(t) - b*sin((a+b)*t);
    	    vertex(x, y);
    }
    endShape();
	pop()
}

function drawHypocycloid2() {
	//Hypocycloid 2
	push();
	translate(width/2, height/2); //begin at center of canvas
	var a = map(width-mouseX, 0, width, 0, 100);
	var b = map(width-mouseY, 0, height, 0, 100);
	beginShape();
	    for (var i = 0; i<=150; i++) {
    	    var t = map(i, 0, 100, 0, 360); //angle variable
    	    //hypocycloid2 equations
    	    x = (a+b)*cos(t) + b*cos((a+b)*t); 
    	    y = (a+b)*sin(t) - b*sin((a+b)*t);
    	    vertex(x, y);
    }
    endShape();
	pop()
}

Hypocycloid 1
Hypocycloid 2
Both Hypocycloids

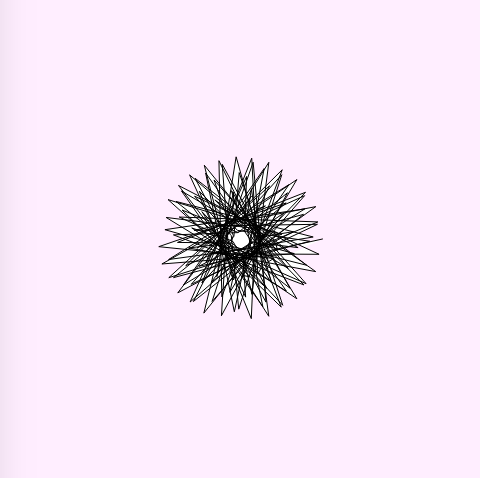
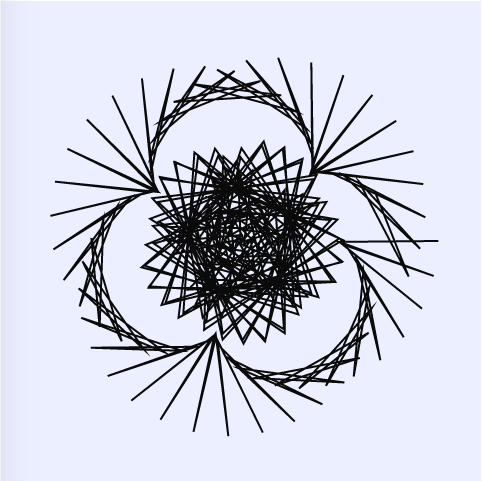
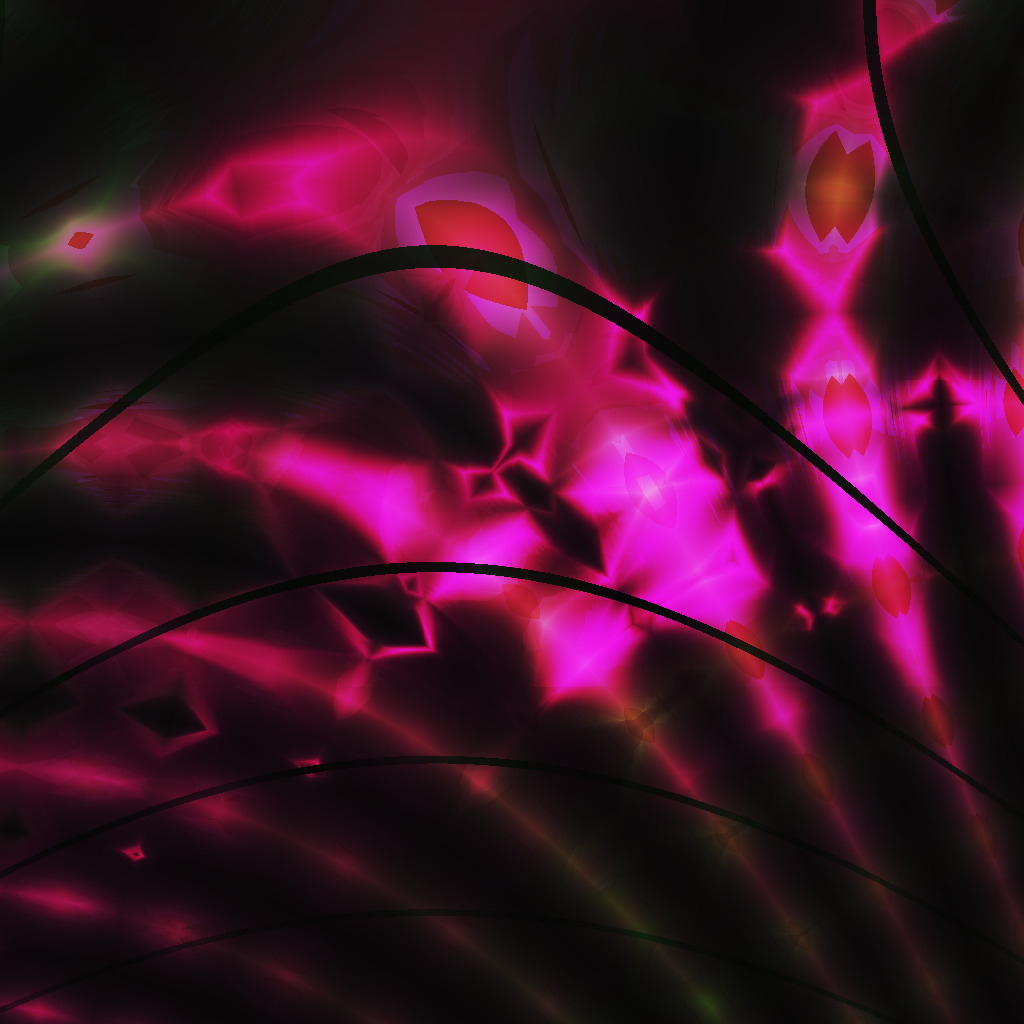
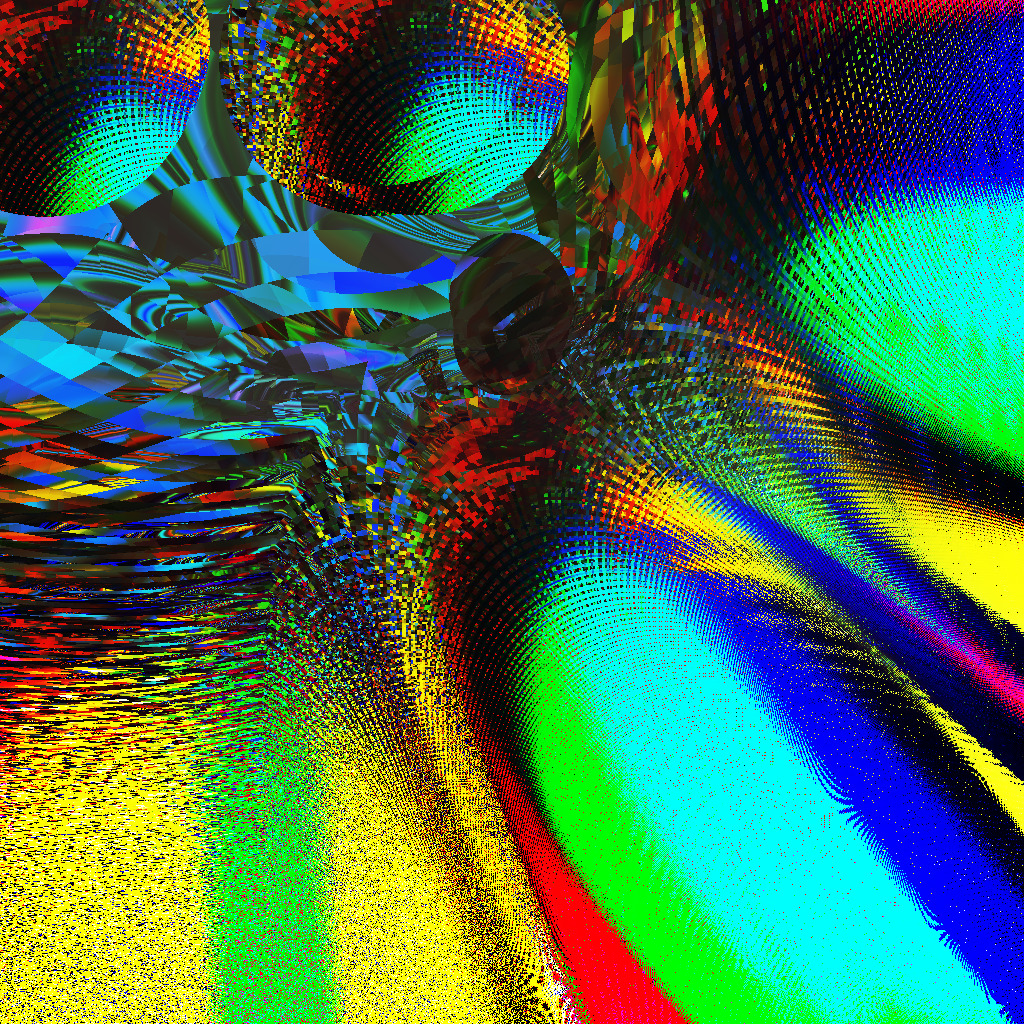
It took me quite a while to figure out how to use an equation of a hypocycloid in javascript. In addition, I spent a lot of time looking through the MathWorld website looking at different curves and equations. I really enjoyed looking at the curves. I like the colors that I chose. The background is blue when the mouse is on the left and changes to pink as the mouse moves right. In addition, I like that the color of the hypocycloid drawings change from black to white and contrasts the background color. I am pretty happy with my product. However, I prefer being able to imagine (in my mind) what my code will create/draw. And, I can imagine what one individual hypocycloid looks like on the screen, but I could never imagine all the changes of my drawing based on where the mouse is.

Chelsea-Fan-Looking Outward-07

Wes Grubbs created an interactive data visualization software to collect data about Hate Flyering across the USA for the Southern Poverty Law Center.

Users are able to zoom to view, select each state to see the statistics, and also see the change in Hate Flyering over time. The interactive visualization allows you to select the time range from 2018-2019, see the different groups of flyers and the types of flyering.

I really admire that Grubbs created an interactive visualization for something very prevalent in today’s society. I don’t know what algorithms generated this work, but I am astounded by the creativity of Grubbs to create an actual map drawing of the USA with 3D bar graphs. The bar heights increase with the number of Hate Flyerings. In addition, the bay is specifically located (on the map) on the location (in the US) where the data was gathered. This seems like such a simple idea, yet the creativity manifests in this form of presentation.

Grubbs Interactive Data Visualization (n.d.): USA Map Hate Flyering Bar Graph
Grubbs Interactive Data Visualization (n.d.): Winchester Hate Flyering Statistics in 2018

Chelsea Fan-Project 06

AbstractClock

/* Chelsea Fan
Section 1B
chelseaf@andrew.cmu.edu
Project-06
*/

var ocean = 255; //background "ocean" color
var fishx = [];
var fishy = [];


function setup() {
    createCanvas(480, 400);
    for (i = 0; i<=59; i++) { //from 0-59 seconds
    	fishx[i]= random(100, width); //random location of fish x coord
        fishy[i] = random(175, 275); //random location of fish y coord
    }
}

function draw() {
	noStroke();
    var S = second();
    var M = minute();
    var H = hour();
	//var mappedH = map(H, 0, 23, 0, width);
    
    //changing background color to darken every hour
    background(240-5.31*(H-1), ocean-5*(H-1), 255);

	for (i=0; i<S; i++) { //draw for number of seconds on clock
		fill(255, 160, 122); //orange fish color
		ellipse(fishx[i], fishy[i], 15, 5); //fish bodies
		triangle(fishx[i], fishy[i], fishx[i]-10, fishy[i]+4, fishx[i]-10, fishy[i]-4);//fish tails
	}
	//Shark moving across screen counts minutes
	//measured at inner corner of shark's mouth
    fill(160, 160, 160, 170); //gray color
	arc(20+M*(1/59*width)-30, height/2, 400, 150, QUARTER_PI, 11*PI/6); //shark head
    triangle(M*(1/59*width)-100, height/2, M*(1/59*width)-400, height/2-75, M*(1/59*width)-400, height/2+75); //shark tail
	fill(255); //white color
	ellipse(M*(1/59*width)+20, height/2-45, 20, 20); //outer eye
	fill(0); //black color
    ellipse(M*(1/59*width)+20, height/2-45, 10, 10); //inner eye

}

It took me a while to come up with a good idea for an abstract clock. My mind kept returning to ideas similar to the example bar length or a circular clock with standard hands. I had some difficulty figuring out the ratio of colors to keep the background blue (background changes based on the hour). Overall it was an interesting project. I don’t enjoy not being able to run through everything to see the colors of every hour. However, I did enjoy being able to create a “clock” or time measurer without any restrictions. I was able to create whatever I wanted in whatever shape, size, color, etc. I enjoy having that freedom.

Chelsea Fan-Looking Outward-06

Andrej Bauer started a Random Art Project that generates expression trees that describe an image. An interesting part of his random art is the functions he uses. He does not use a generation algorithm to create his artwork.

Andrej Bauer Falcon Punch Piece (n.d.)

His website for his artwork allows viewers to rate the artwork and sort the pieces by popularity.

I admire that Bauer creates an abundance of different pieces. His artwork has a specific”style” that really represents “Andrej Bauer Art”. Because the pieces are so different and diverse, yet still similar through the style, viewers can tell a certain piece is created by Bauer. One critique I have is that his website is fairly limited and doesn’t reach a wide audience of people.

Andrej Bauer Doubledown Hoobris Piece (n.d.)

Chelsea Fan-Project-05


Wallpaper

/* Chelsea Fan
Section 1B
chelseaf@andrew.cmu.edu
Project-05
*/

function setup() {
    createCanvas(400, 400);
    background(255, 250, 205);
}
var xCoord = 10; //x coordinate of rect
var yCoord = 10; //y coordinate of rect
var xRect = 10; //width of rect
var yRect = 50; //height of rect
var spacing = 20; //spacing between rect
var horiz = -16; //horiz spacing between rect
var r = 255; //red color 
var g = 220; //green color
var b = 220; //blue color

function draw() {
	for (var i = 0; i < 13; i++) {
		stroke(0); //stroke color black
		fill(r, g, b); //color of rect
	    rect((xCoord+spacing)*i+horiz*spacing, (yCoord+spacing)*i, xRect, yRect); //rectangles
	    stroke(255); //change stroke color to white
	    line(30*i, 0, 30*i, height); //vertical white stripes
	    }
	horiz = horiz + 3; 
	r = r - 3; //change in red color
	g = g + 3; //change in green color
	b = b + 3; //change in blue color

    for (var i = 0; i < 21; i++) { 
    	line(0, 20*i, width, 20*i); //horizontal white stripes
    }

}

Chelsea Fan-Looking Outward-05

Chaotic Atmospheres creates 3D depictions of environments and landscapes. I admire that Chaotic Atmospheres creates illustrations from a wide variety of nature.

Chaotic Atmospheres’ Caustic Icebergs Illustration (n.d.)
Chaotic Atmospheres’ Eroded Leaves (n.d.)

Not only are there illustrations of scenery from far away, but Chaotic Images used a flow map on a personal project to create a series of up close images. Eroded Leaves is a vegetation flow map of the Sycamore Maple Acer Trees. This series includes 3D depictions of the Japanese Maple, the Silver Maple, the Cappadocian Maple, and more.

One critique that I have is that although Chaotic Images creates an abundance of different pieces, it does not seem as if there is any specific”style” that really represents “Chaotic Images’ Art”. Because the pieces are so different and diverse (up close vs far away, animals vs scenery, realistic vs animated) there isn’t any notable part of his art that tells viewers that a certain piece is created by Chaotic Images. This makes it less likely that the name and brand Chaotic Images has created will be widely known or spread.

Artwork by Chaotic Images can be viewed at this link: https://www.behance.net/chaotic_atmospheres/

Chelsea Fan-Project-04-String Art

StringArt

/* Chelsea Fan
Section 1B
chelseaf@andrew.cmu.edu
Project-04
*/
var spacing = 15; //spacing for each line
var y = 1; //green line variation
var w = 100; //pink line variation

function setup() {
    createCanvas(400, 300);
    background(0);
    strokeWeight(1.5); 
}

function draw() {
	//Green Lines
	stroke(150, 255, 150); //green color
    for (var x = 100; x<=300; x+=spacing) {
    	line(x, 0, x*y, 300);
    	y = y*0.7;
    }
    //Blue Lines
	stroke(150, 150, 255); //blue color
    for (var x = 0; x<=100; x+=spacing/2) {
    	line(x, 0, 400-x, 300);
    }

    //Pink Lines
    stroke(255, 0 ,250); //pink color
    for (var x = 0; x<=100; x+=spacing/2) {
    	line(x+300, 0, w-x, 350);
    	w = w*0.9;

    }
    //Yellow Lines
    stroke(230, 250, 0); //yellow color
    for (var x = 0; x<=100; x+=spacing) {
    	line(0, x+100, 400, 300-x);
    noLoop(); //don't keep drawing lines
    }
}

I wanted to have bright colored lines with a dark background to make the design POP. It took me a while to fine a design of lines that were simple but interesting to view.

Chelsea Fan-Looking Outward-04

BIY (Believe It Yourself) is a studio based in Shanghai that created three different computing kits (BIY.SEE, BIY.MOVE, and BIY.HEAR) that let you build your own harmonious products. The BIY.MOVE kit uses fengshui and Chinese Geomancy to find a “good location” based off of GPS location of mountains and rivers nearby. The BIY.SEE helps you “see” everything good and bad around you through Italian superstitions and logic of the Smorfia. The BIY.HEAR uses a numerical language to find meaning in names and objects through training from Indian Numerology and Astrology.

I admire that BIY is completely unique and combines technology and superstition beliefs. I really like that the product kits comes in a defined technological form of wires, lights, buttons, etc. However, I find it very interesting that such a defined product is doing something (like finding a balanced place) so abstract and non-definite. I don’t know anything about the algorithms that generated such work, but I love that the kits are meant to help you help you “see luck” or “interpret your destiny.”

BIY.MOVE Kit including the “Harmonious Compass” that uses GPS Location to find a good location.

Chelsea Fan-Project-03-Dynamic Drawing

DynamicDrawing

/* Chelsea Fan
Section 1B
chelseaf@andrew.cmu.edu
Project-03
*/

//Changes in size, position, shape, and distance
function setup() {
    createCanvas(640, 480);
    noStroke();
}

function draw() {
    background(173, 216, 230);
    fill(255,255,0);
    //MouseX can move from 50 to 450
    var mouse = max(min(mouseX, 450), 50);
    var size = mouse * 400.0 / 640.0;
//Rabbit 1
    //Body
    fill(250, 250 , 250);
    ellipse(10+mouse*350/640, 225, size, size+50);
    //Tummy
    fill(255, 228, 225);
    ellipse(10+mouse*350/640, 235, size/1.5, size+20);
    //Head
    fill(250, 250, 250);
    ellipse(10+mouse*350/640, 180, size, size);
    //Ear
    ellipse(3+mouse*350/640, 160, size/8, size);
    ellipse(15+mouse*350/640, 160, size/8, size);
    //Eyes
    fill(211, 211, 211);
    ellipse(mouse*350/640-3, 180, size/4, size/4);
    ellipse(15+mouse*350/640, 180, size/4, size/4);
    fill(0)
    ellipse(mouse*350/640-3, 180, size/8, size/8);
    ellipse(15+mouse*350/640, 180, size/8, size/8);

//Purple square
    fill(216, 191, 216);
    size = 300-size;
    rect(width-mouse*350/640-140, 230, size, size);
    rectMode(CENTER); // center rect around 0,0
}
   

I used my last Project’s bunny drawing as a template for this new and improved dynamic bunny. I enjoyed learning how to incorporate the mouse location into the dynamic drawing.

Chelsea Fan-Looking Outward-03

Digital Fabrication by Marius Watz consists of 3D Printing, CNC Technology, and innovation to create new digital crafts. Watz uses creative technologies to make 3D artwork for various uses.

I admire that Watz uses 3D printing not just for art, but for daily needs such as Furniture Assembly, jewelry like rings and earrings, light installations, etc. His artwork has a sense of uniqueness for each individual piece. It is inspiring to see art that incorporates a different “look” and use.

Watz used 3D printing to create Connectors for Easy Furniture Assembly. (Undated)

One critique that I have is that although Watz creates an abundance of different pieces for various reasons, it does not seem as if there is any specific”style” that really represents “Watz’s Art”. There isn’t any notable part of his art that tells viewers that a certain display/piece is created by Watz. This makes it less likely that the name and brand Watz has created will be widely known or spread.

Watz’s Wearable Sculpture (Undated)

More artwork by Watz is available at this link: https://www.pinterest.com/watzmarius/digital-fabrication/