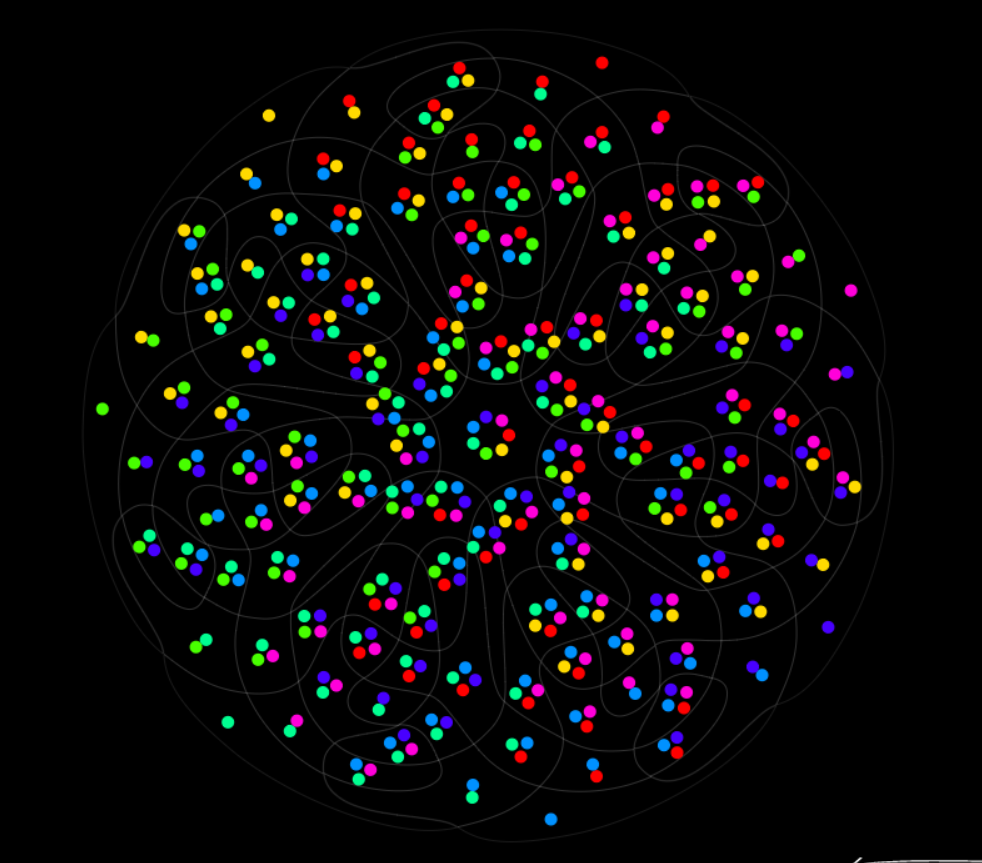
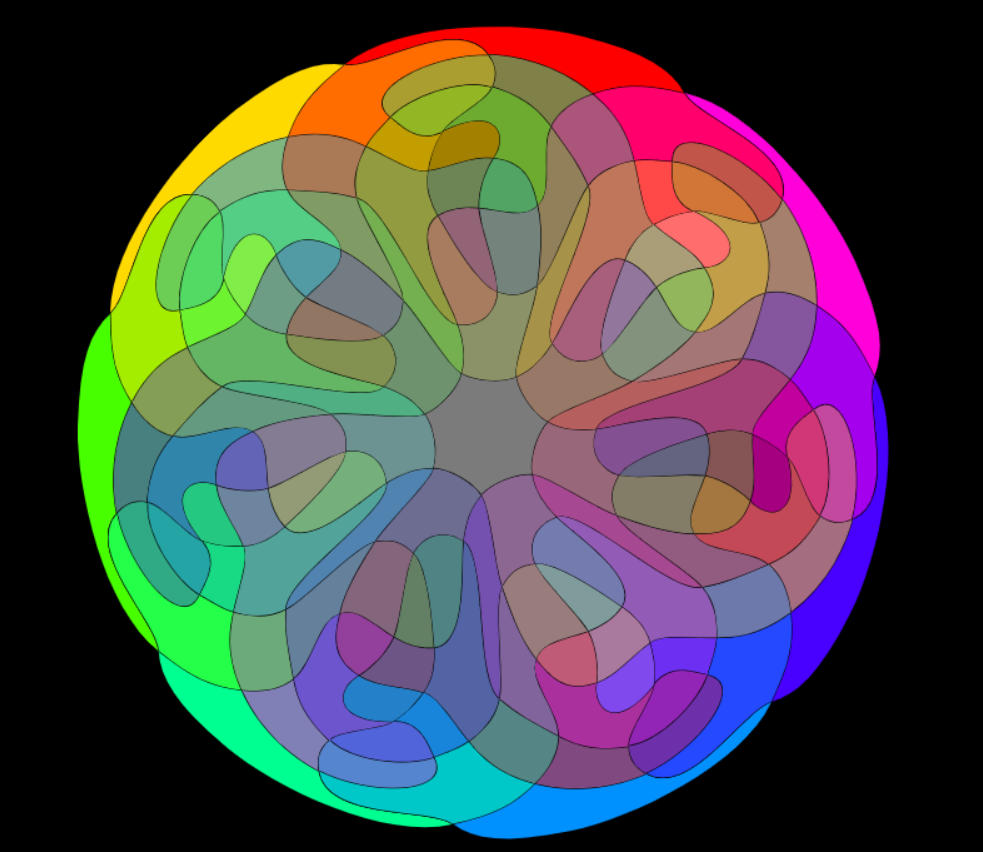
7 Sets Venn Diagram is a creative visual by Santiago Ortiz that replicates the color wheel in a way that represents different mixtures of colors. He was inspired by Newton’s theories on light and color spectrum and used the actual colors instead of numbers. Ortiz created the wheel so that on Side A, there are little circles that when you hover your mouse over the names of the colors appear in the bottom. On Side B, the mandala consists more of filled in sections, but similarly has the names of the hues shown after you hover over the color.
Santiago Ortiz is the Head at Moebio Labs which consists of data visualization developers and designers. Ortiz also specializes in interactive information visualization which this project is an example of the type of work he may do in that field.
//Carly Sacco
//Section C
//csacco@andrew.cmu.edu
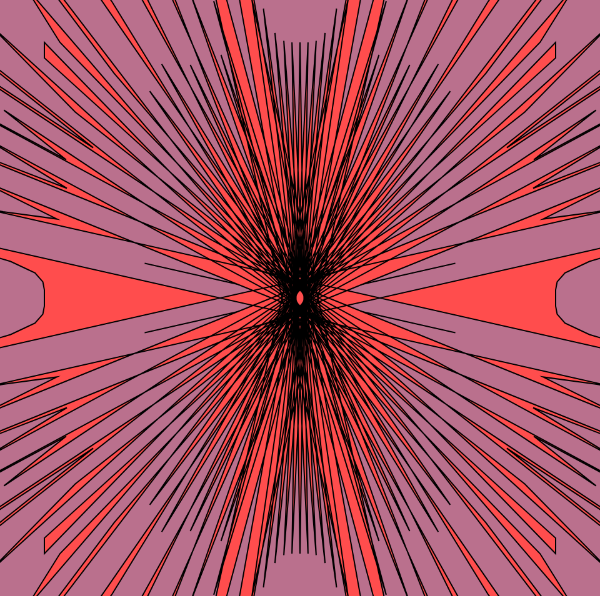
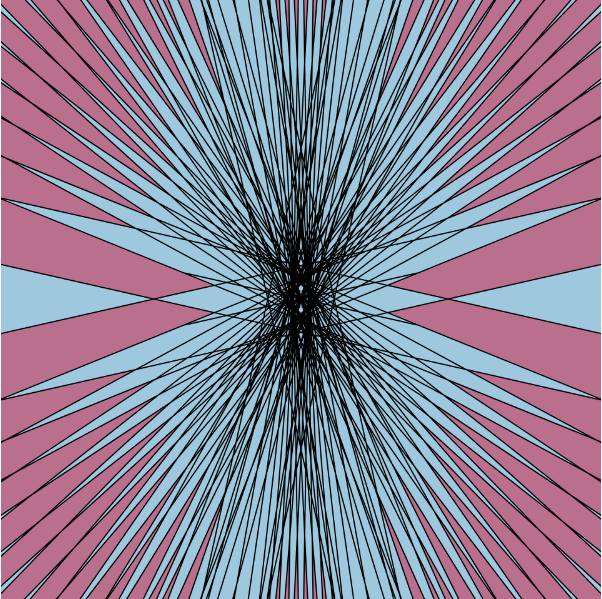
//Project 07 - Composition with Curves
var points =200 //number of points
// for an episprial this will be sections
//the equation for an epispiral
//r = a sec (ntheta)
functionsetup(){createCanvas(480,480);}functiondraw(){background(186,112,141); //calling the curve functions
drawCraniodCurve1();drawCraniodCurve2();}functiondrawCraniodCurve1(){var x;var y;var r;var a =map(mouseX,0, width,0, width /2); //makes the first epispiral relate to mouseX
var c =map(mouseY,0, height,0, height /2); //makes the second epispiral relate to mouseY
var b = a /5;var p =100;var theta; //calling the curve functions to be drawn
push();translate(width /2, height /2);fill(158,200,222); //blue
beginShape();for(var i =0; i < points; i +=1){
theta =map(i,0, points,0, TWO_PI);
r =(a *(1/cos((i + points)* theta))) //epispiral equation
x = r *cos(theta);
y = r *sin(theta);vertex(x, y);}endShape(CLOSE);pop();}functiondrawCraniodCurve2(){push();translate(width /2, height /2);fill(255,77,77); //red
beginShape();for(var i =0; i < points; i +=1){var c =map(mouseY,0, height,0, height /2);
theta =map(i,0, points,0, TWO_PI);
r =(c *(1/cos((i + points)* theta))) //epispiral equation
x = r *cos(theta);
y = r *sin(theta);vertex(x, y);}endShape(CLOSE);pop();}
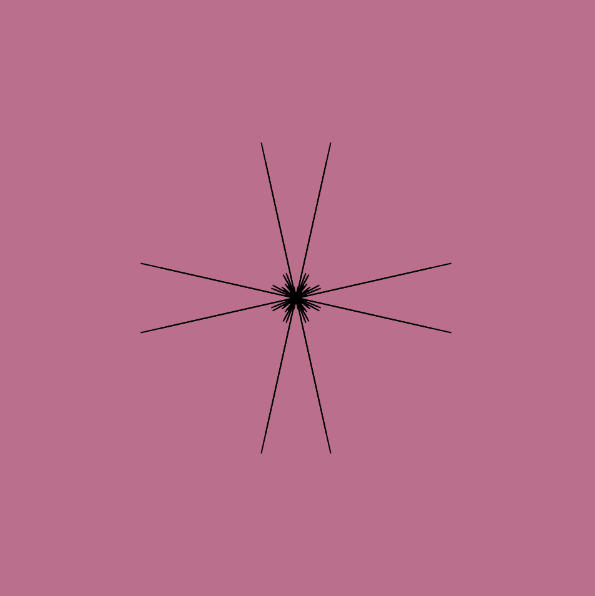
For this project, I at first was trying to create an image more similar to a typical spirograph. However, after choosing to work with the epispiral, I liked how it almost looked like shattered glass. It reminded me of a comic strips and when an action was done there would be action bubbles. I then chose to animate it similarly to a “POW” action that could be drawn in the comics. Therefore, I overlayed the original epispiral with another with colors that could seem comic book like.
//Carly Sacco
//Section C
//csacco@andrew.cmu.edu
//Project 6 - Abstract Clock
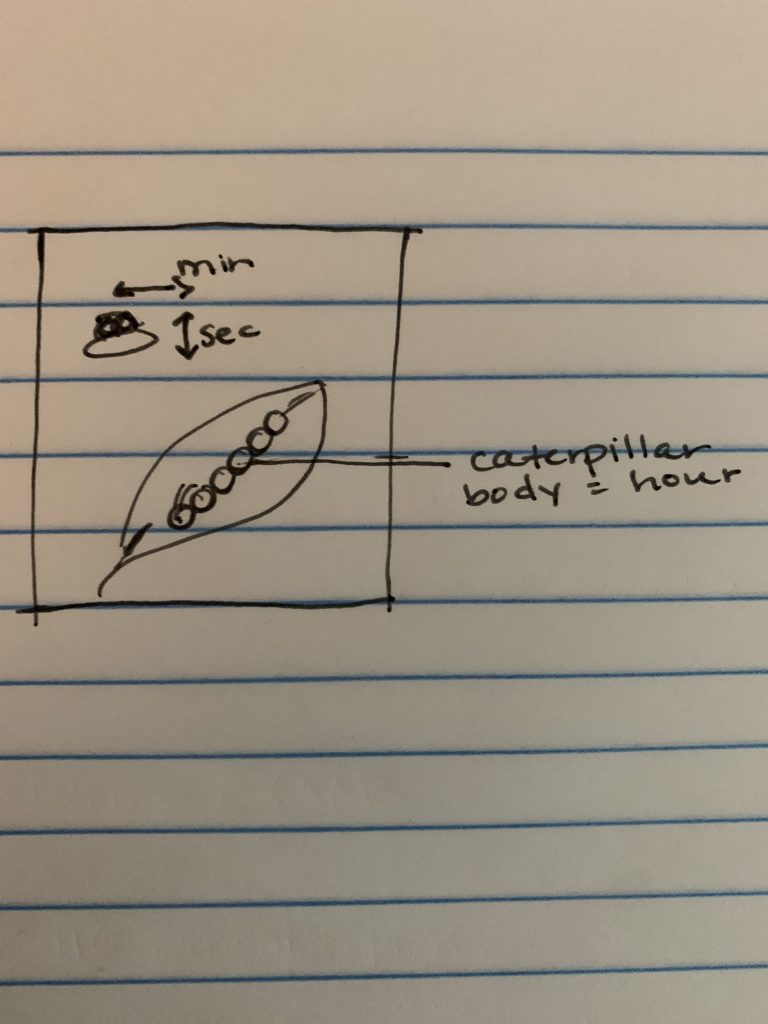
functionsetup(){createCanvas(450,450);}functiondraw(){var sec =second();var min =minute();var hr =hour();var start =140; //start is how far over on x axis you start drawing
var diameter =20;background(225,244,252); //leaf
fill(96,163,140);stroke(96,163,140);bezier(400,150,350,400,250,450,100,400); //bottom of leaf
bezier(400,150,250,200,250,150,100,400); //top of leaf
fill(151,209,185);bezier(400,150,325,200,400,350,100,400);bezier(400,150,200,250,250,250,100,400); //caterpillar
k = hr %12for(i =1; i <= k; i +=1){noStroke();fill(217,56,102);ellipse(start +((diameter)*(i)),385-(i *18), diameter, diameter);} //caterpillar face
fill(255,231,153);ellipse(155,365,5,5);ellipse(160,370,5,5); //antennas
noFill();stroke(0);bezier(160,360,162,360,165,355,170,354);bezier(165,365,162,363,164,362,170,360); //nose
noStroke();fill(255,195,186);ellipse(155,370,7,7); //fly
var wingy =90var flyBodyY =100noStroke();let flyBodyX =map(min,0,60,0,450); // makes the x position correspond to the minute
//and the width of the canvas
if(sec %2==0){//makes the fly bounce every second
//fly wing
fill(162,166,168);ellipse(flyBodyX, wingy,45,15); //fly body
fill(208,212,214)ellipse(flyBodyX, flyBodyY,50,20); //fly eye
fill(0);ellipse(flyBodyX +15, wingy +5,5,5);}else{ //wing
fill(162,166,168);ellipse(flyBodyX, wingy +5,45,15); //body
fill(208,212,214)ellipse(flyBodyX, flyBodyY +5,50,20); //fly eye
fill(0);ellipse(flyBodyX +15, wingy +10,5,5);}}
When I was thinking about what to make for this project a fly had landed on my computer. I then thought about a creative way to use insects to represent the time. I thought an easy way to represent hour was by using a caterpillars body, and each circle of his body could represent the hour. The fly flapping every second was my next idea and then by letting him move across the screen to represent the minutes I thought was a cute way to add more motion to the screen.
I at first had trouble with how to convert the actual time to numbers to run in the code, but after solving those minor issues, I enjoyed drawing on the face and adding the leaf.
Perlin Noise is a visual representation of what “natural” texture and surfaces that were created to contrast with the “machine – like” look of graphics at the time. Although the algorithm is simple, the components of it are kept simple. The images are produced off of a box – grid system with random gradient vectors, computation of the dot products of the distance and gradient vectors, and an interpolation between these. Random number generators can be used and by the altering of the algorithm, different images can appear every time.
Ken Perlin invented this algorithm in 1983 because he wanted there to be a way for something natural to appear even on a screen. After creating this algorithm he was awarded an Academy Award for Technical Achievement and continued to use the algorithm for texture synthesis and 3D implecations.
//Carly Sacco
//Section C
//csacco@andrew.cmu.edu
//Project 5: Wallpaper
functionsetup(){createCanvas(400,500);}functiondraw(){background(145,185,217);fill(255); //white rectangles
noStroke();for(var x =0; x <100; x = x +1){rect(x,20, width,25); //top two white lines
rect(x,100, width,100);rect(x,440, width,25); //bottom two white lines
rect(x,300, width,100);}fill(178,206,219); //blue rectangles
noStroke();for(var y =0; y <100; y = y +1){rect(x +50, y, x,25); //top set of three rectangles
rect(x +200, y +50, x,25);rect(x -100, y +50, x,25);rect(x +50, y +205, x,25); //middles set of rectangles
rect(x +200, y +250, x,25);rect(x -100, y +250, x,25);rect(x +50, y +420, x,25); //bottom set of rectangles
rect(x +200, y +470, x,25);rect(x -100, y +470, x,25);}stroke(186,191,194); //grey line set
line(125,0,125,500);line(275,0,275,500);line(115,0,115,500);line(135,0,135,500);line(265,0,265,500);line(285,0,285,500);stroke(214,120,145); //pink
line(0,30,500,30); //top set of three pink lines
line(0,20,500,20);line(0,45,500,45);line(0,440,500,440); //bottom set of pink lines
line(0,450,500,450);line(0,465,500,465);}
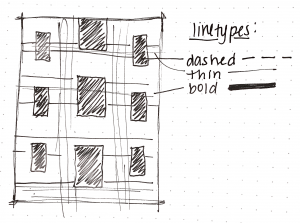
The inspiration for my wallpaper were different types of line types that were abstracted. Therefore, I used dotted lines, different line thicknesses, and different colored lines.
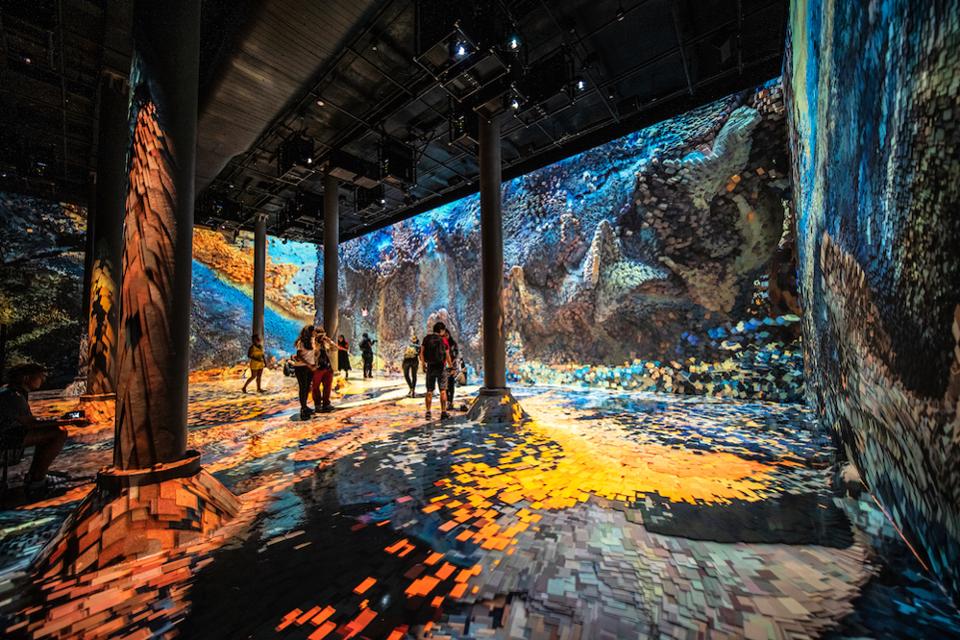
An image from Machine Hallucination at ARTECHOUSE in New York City.
Machine Hallucination by Refnik Anadol has recently debuted in New York City at ARTECHOUSE in New York City. This exhibit uses machine learning algorithms on a data set of images of architectural styles and movements. The result reveals the correlation between moments in architectural history. The images produced help visually represent moments in a city that may have gone unnoticed to the user prior. Fluid motions are used to represent how city movements are continuous and the images projected on them help show how complex cities are.
Refnik Anadol is a media artist, director, and entrepreneur in the aesthetics of machine learning. This project allowed him to merge his traits and compose an exhibit that was rooting in machine learning but has an artistic execution of the data collected. He presents a new way to look at images from a city by showing viewers what they’ve already seen but in a fluid, continuous memory.
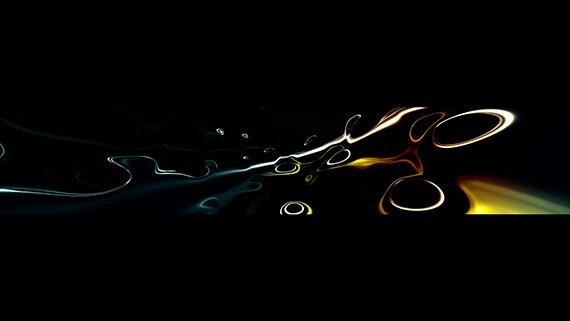
The Mylar Typology is an audio – visual performance of continuous textures that seem to shimmer and flow with the amplification of sound. I thought this project was particularly appealing because of the calming effects the visual and audio had as you watch it. The muted colors that seemingly blend together and create swift vibrations seem to always be rippling off of each other.
One of the visuals Prudence uses in “The Mylar Typology.”
I could imagine that the algorithms used to create these visuals are complex since they not only have to correlate to each other, but also to the changing sounds that occur. Paul Prudence shows his artistic abilities in this project with his attention to details of the sounds played and how the visual reacts.
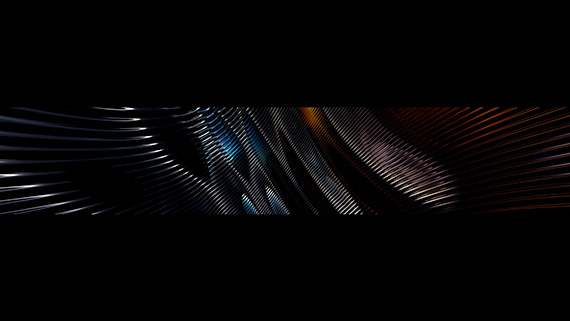
A key striation effect Prudence uses that appears to shimmer with the audio.
//Carly Sacco
//Section C
//csacco@andrew.cmu.edu
//Project 4
var x1 =5;var x2 =9;var y1 =5;functionsetup(){createCanvas(400,300);}functiondraw(){background(0);for(var i = x1; i <400; i += y1){ //blue curves
stroke(95,158,176);line(i +200,300, i * x2 + mouseX, i);line(i +200,300,-i * x2 +-mouseX, i); //green
stroke(109,199,111);line(i,0, x1 *80, i); //orange
stroke(214,56,39); //line(i + 400, 0, -x2 * 10, i * 5);
line(i,300,0, i); //purple
stroke(173,142,212);line(i * x1, y1,500, i *10);}}
Once I had made the blue curves that work oppositely of each other they reminded me of wings of a bird. I then decided to make the other curves mimic the shape of a peacock’s feather and chose the colors accordingly.
//Carly Sacco
//Section C
//csacco@andrew.cmu.edu
//Project 3
var x =300;var y =400;var dx =1;var dy =-1;functionsetup(){createCanvas(640,480);}functiondraw(){background(95, mouseX *.7,227); //fish head
fill(50,162,168);noStroke();push();translate(width /2, height /2);rotate(PI /4);rect(-50,-50,300,300,30);pop();fill(184,213,214);noStroke();push();translate(width /2, height /2);rotate(PI /4);rect(-25,-25,250,250,30);pop(); //fish eyes
fill('white');ellipse(290,315,50,65);ellipse(350,315,50,65);fill('black'); //letting the black of the eye move based on the mouse
eyeY =constrain(mouseY,310,330);ellipse(290, eyeY,35,35);ellipse(350, eyeY,35,35); //fish mouth
fill(227,64,151);noStroke();push();translate(320,410);rectMode(CENTER)rotate(mouseX /150); //the mouth spins based on mouseX
rect(0,0,100,100,30);pop();fill(120,40,82);noStroke();push();translate(width /2, height /2);rotate(PI /4);rect(95,95,50,50,30);pop(); //fins
fill(209,197,67);quad(460,350,510,300,510,450,460,400);quad(200,350,150,300,150,450,200,400); //bubbles
var bub =random(25,60);fill(237,240,255);ellipse(x, y,50,50);ellipse(x, y, bub, bub);ellipse(200, y, bub, bub);ellipse(mouseX *.5, mouseY *.5, bub, bub);ellipse(mouseX *.25, mouseY *.25, bub, bub);ellipse(mouseX *.75, mouseY *.75, bub, bub);ellipse(mouseX *.5, mouseY *.25, bub, bub);ellipse(500, y, bub, bub);ellipse(250,500, bub, bub);
x += dx;
y += dy; //so that they bounce off the edges
if(x >640){
dx =-dx;}if(y <0){
dy =-dy;}if(y >480){
dy =-dy;}if(x <0){
dx =-dx;
dy =random(1,5);}}
I thought making a fish with aspects that moved based on the cursor would be a fun way of how humans normally try to get fish’s attention. I learned a lot about how certain things can be controlled and how with others it’s fun to let them just run.
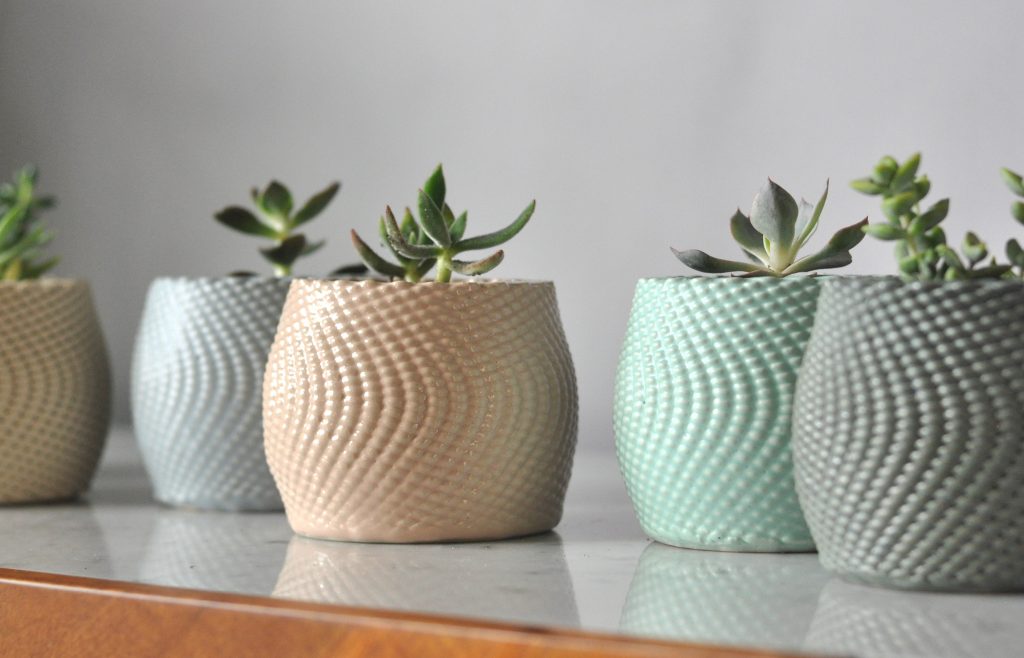
Coded Clay is a project and business where 3D parametric fabrication creates pots and vases for people to use in their homes. This project is particularly interesting because code is used to alter every aspect of the 3D printing process to create unique vases. The 3D printer is also custom built to be able to print clay after using parametric coding in grasshopper.
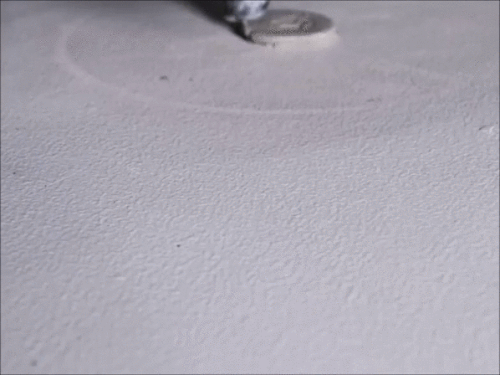
The 3D printer prints clay in an arrangement coded and designed parametrically.
The process taken to create the pots starts by a sketch idea of a form/shape. Then by the use of parametric coding in grasshopper, the forms are digitally modified until the desired aspects of the pot are met. Lastly, the pots are 3D printed, fired twice, and hand glazed. Brian Peter is the creator of these and he if interested in both computational architecture as well as pottery. He went to undergrad for Studio Art and completed a ceramic residency – where the 3D printed clay idea started.
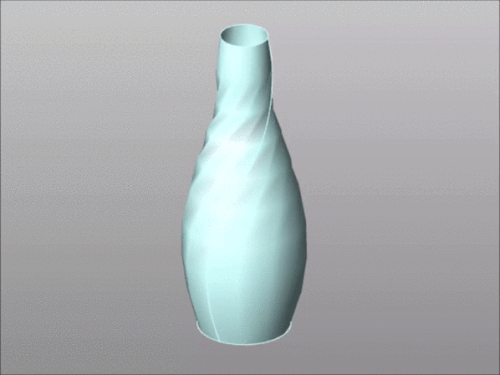
The pots are coded parametrically before the printing process begins.
![[OLD FALL 2019] 15-104 • Introduction to Computing for Creative Practice](../../../../wp-content/uploads/2020/08/stop-banner.png)