Joanne Chui – Curves -Project 07

sketch

/*
Joanne Chui
Section C 
Project 6
*/

var nPoints = 200;

function setup(){
  createCanvas(400,400);
  frameRate(10);
}

function draw(){
  background(227, 127, 190);
  stroke(227, 175, 127);
  spirograph();
  push();
  translate(200, 200);
  for(var a = 0; a < 5; a++){
    rotate(a * PI/2);
    strokeWeight(3);
    spirograph();
  }
  pop();

}

function spirograph(){
  var x = constrain(mouseX, 0, width);
  var y = constrain(mouseY, 0, height);
  var r = 40;
  var s = 100; 

  push();
  translate(200, 200);
  beginShape();
  noFill();
  for(i = 0; i<nPoints; i++){
    var t = map(i, 0, nPoints, 0, 5*TWO_PI);
    x = (s - r)*cos(r*t/s) + i*(mouseX/100)*cos((1 - r/s)*t);
    y = (s - r)*sin(r*t/s) + i*(mouseX/100)*sin((1 - r/s)*t);
    vertex(x, y);
  }
  endShape(CLOSE);
  pop();
}

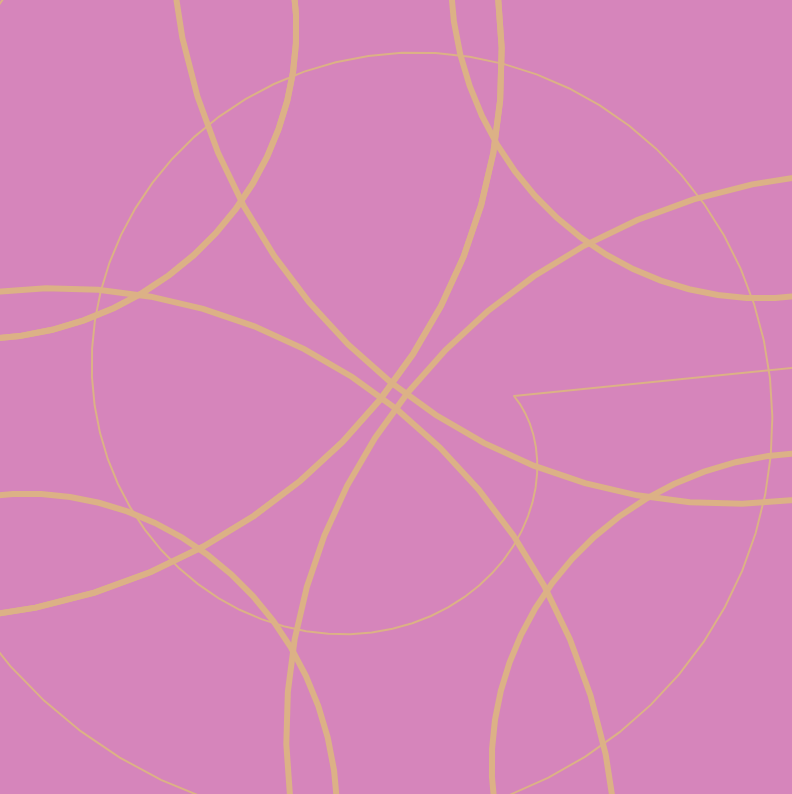
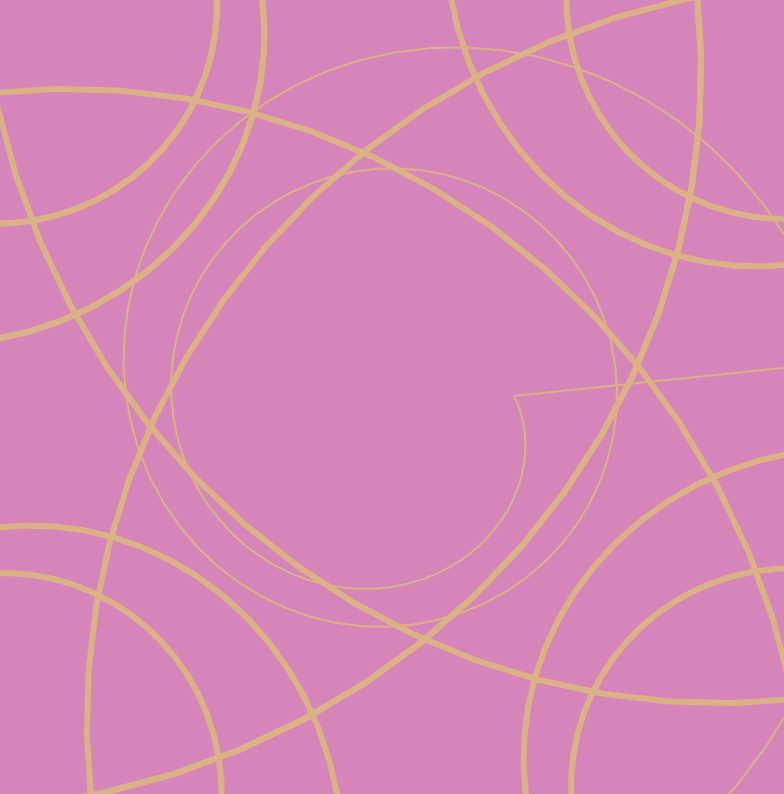
I made the original curve visible so that when a pattern is generated on the screen you can see where the pattern is derived from. I also liked the look of fewer lines so that the pattern seems more abstract.

Joanne Chui – Looking Outwards 07

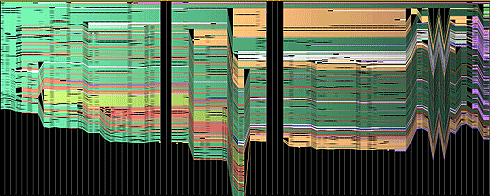
image on the edit history of abortion by Martin Wattenberg

In collaboration with Fernanda Viegas, the set of visualizations titled History Flow are representations of the edit history of Wikipedia articles. With these visualizations, it is interesting to see how a pattern emerges. For example, with the abortion visualization above, the zig zag pattern on the right delineates an argument of differing opinions. The black columns that cut through the graph shows when the article was erased and instead substituted with something offensive, which Wattenberg states is not uncommon on controversial topics. I’m curious to see what the colors in each visualization represent, and if it was words that were plotted onto the graph or ideas.

Joanne Chui – Looking Outwards – 06

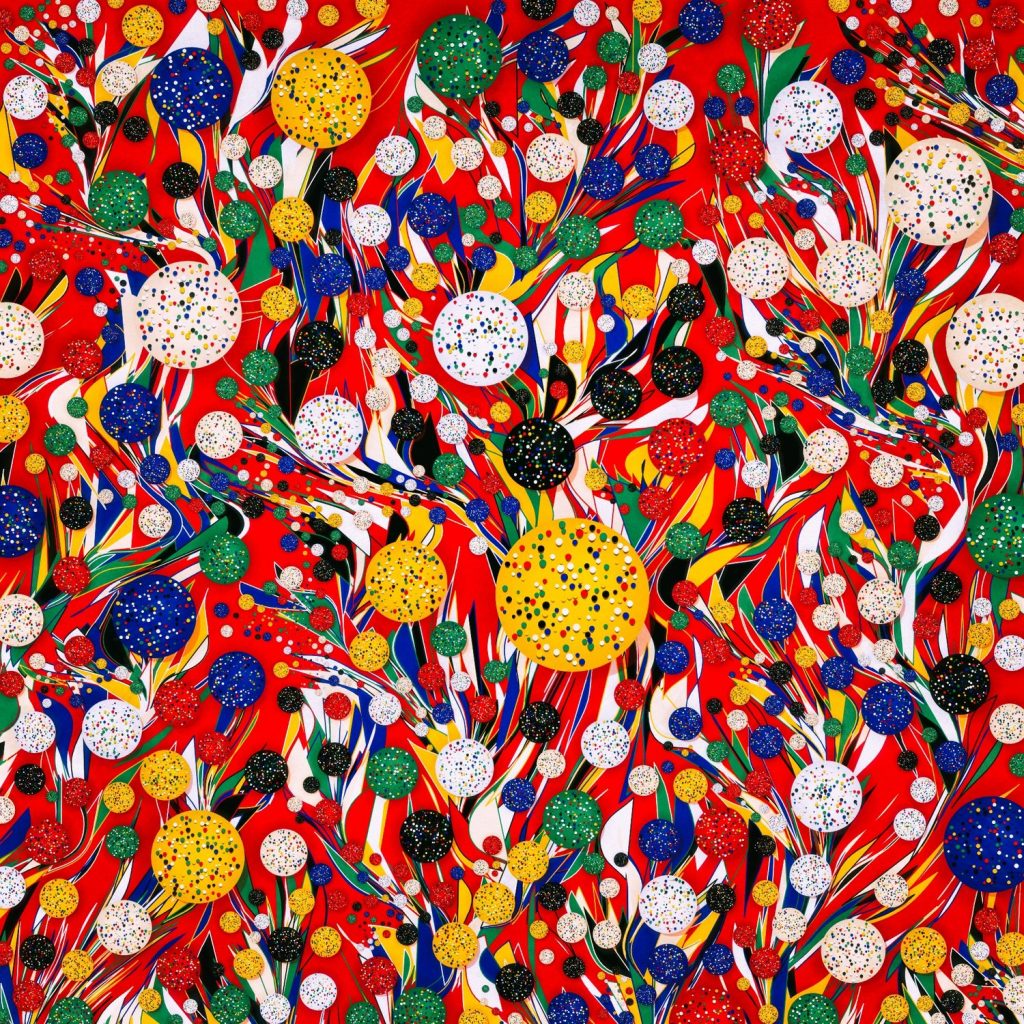
generative art by Manolo Gamboa Naon

What is extremely interesting about Manolo’s art is that he basically mimics certain design logic of existing paintings, but with a twist. He reduces the paintings into their simplest geometries, and with that pieces back the painting through code and algorithms to produce a fresh and more modern version of the precedents. Manolo manages to keep the spirit and core of each art piece but putting a more computation spin onto them. It is really interesting to see how minute changes in variables can produce such beautiful and unique artworks, and in a way makes the art more accessible to viewers by having a more recognizable methodology of computation.

Joanne Chui – Abstract Clock – 06

sketch

/*
Joanne Chui
Section C 
Project 6
*/

function setup(){
    createCanvas(400,400);
}


function draw(){ 
    var s = second();
    var m = minute();
    var h = hour() % 12;

    background(255, 194, 38);

    stroke(150, 50, 40);
    fill(255, 212, 105);

    //second
    strokeWeight(15);
    noFill();
    stroke(255, 212, 105);
    arc(200, 200, 300, 300, -HALF_PI, TWO_PI * (s/60)-HALF_PI)
  		
  	//minute
  	for(i = 0; i < m; i++){
  		strokeWeight(1);
  		ellipse(200, 200, 300 - (i*5), 300 - (i*5));
  	}

  	//hour
  	strokeWeight(30);
    noFill();
    stroke(255, 225, 150);
    arc(200, 200, 350, 350, -HALF_PI, TWO_PI * (h/12)-HALF_PI)

}


I was interested in visually embedding the amount of time that had passed into the image so that the time was still readable. I was inspired by the various simplistic apple watch faces.

Joanne Chui – Project 05 -Wallpaper

sketch

/*
Joanne Chui
Section C 
Project 5
*/

function setup(){
	createCanvas(400, 400);
	background(0, 25, 100);
}


function draw(){
	for(i = 0; i < 5; i++){
		for(a = 0; a < 5; a++){
			var quadX = i * 100 - 50;
			var quadY = a * 100;
			noStroke();
			fill(255, 182, 56);
			if(i % 2 == 0){
				quad(quadX, quadY, quadX + 150, quadY, quadX + 75, quadY + 50, quadX - 75, quadY + 50);
				stroke("white");
				strokeWeight(2);
				line(quadX, quadY, quadX - 75, quadY + 50);
			}else{
				noStroke();
				fill(170, 120, 40);
				quad(quadX + 50, quadY + 50, quadX + 100, quadY + 50, quadX + 50, quadY + 100, quadX - 50, quadY + 100);
				stroke("white");
				strokeWeight(2);
				line(quadX, quadY, quadX + 50, quadY + 100);
				line(quadX, quadY, quadX + 100, quadY);
			}
		}
	}
}

I wanted to create a wallpaper that showed depth and had a lot of layers. I also experimented with creating an abstract design.

Joanne Chui – Looking Outwards- 05

Andy Lomas “Growth by Aggregation”

Andy Lomas is a mathematician and a computational artist. He creates computer generated 3D sculptures that explore and simulate different processes of growth. Growth by Aggregation is a study of how natural forms can produce such complex intricate aggregations just by adhering to simple mathematical laws. This is based on simulating disposition and flow and how these natural processes can create structures similar to coral. The artist’s creative sensibilities manifest in this computer graphic in how a lot of Lomas’s graphics visualize the process of expanding and contracting, dividing and multiplying, etc. What I find interesting about not only this computer graphic but also his other ones are the constraints that he uses in order to restrict the form that is produced, rather than creating a general massed aggregation.

Joanne Chui – Project 04 – String Art

sketch

// Joanne Chui
//jchui1@andrew.cmu.edu
// Assignment-04-A
// Section C 

function setup(){
	createCanvas(400, 300);
	background("black");
}


function draw(){
	for(let i = 0; i < 25; i++){
		ay = i * 6;
		bx = 200 - (i * 8);
		cy = i * 12;
		dx = i * 16;
		stroke(220, 255, 150);
		strokeWeight(.1);
		//"quad1"
	 	line(200, ay, bx, 150);
	 	//"quad2"
	 	line(200, ay, 200 + bx, 0);
	 	//"quad3"
	 	line(400, cy, 400 - bx, 0);
	 	line(200, 150 + ay, 200 + bx, 0);
	 	line(200, 150 + ay, 400 - bx, 300);
	 	//"quad4"
	 	line(0, 150 + ay, bx, 150);
	 	line(dx, 300, 400, 300 - cy)
	 	line(200, ay, bx, 300);
	}
}

I created this image based on the idea of fabric, and trying to make the lines appear as a continuous surface. This is why there aren’t any endpoints floating in the canvas, and everything is connected.

Looking Outwards – 04 – Joanne Chui

an example of a milkdrop visualization

Milkdrop is a music visualizer that was first created in 2001 by geissworks. It starts out with multiple preset options to start from, in which the music would work to morph and distort certain variables in the presets. Users are allowed to also customize and create their own presets, even being able to write new code to be able to have more control over the visualization. I really like this aspect of the music visualizer because it allows for the program to be extremely user friendly and evolve further from the original program/creator’s intent. It seems that the algorithm relies on a lot of variables, such as color, speed, etc… in which the inputs are constantly being edited depending on the music. I wonder how the visualizations would be different if you were able to start without a preset, and base all the initial variable inputs on the music itself, rather than having the music edit the preset.

http://www.geisswerks.com/about_milkdrop.html

Joanne Chui – Project 03 – Dynamic Drawing

proj3code

/*
Joanne Chui
Section C 
Project 3
*/

function setup(){
	createCanvas(480, 640);
}

var angle = 0;
var elbow = 215;
var wrist = 220;
var height = 20;

function draw(){
	background(204, 166, 149);
	strokeWeight(0);
	//view
	fill(215, 195, 210);
	rect(130, 130, 200, 300);
	fill(240, 220, 235);
	ellipse(155, 190, 20, 20);//cloud1
	ellipse(175, 190, 30, 30);
	ellipse(195, 190, 25, 25);
	ellipse(215, 190, 20, 20);
	ellipse(250, 250, 15, 15);//cloud2
	ellipse(270, 250, 35, 35);
	ellipse(290, 250, 20, 20);
	ellipse(305, 250, 15, 15);
	//blinds
	if(mouseY > 130 & mouseY < 430){
		for(var i = 0; i < 30; i++){
			if(i % 2 == 0){
				fill(200, 186, 183);
			}
			else {
				fill("white");
			}
			rect(130, 130 + i * ((mouseY - 130)/30), 200, (mouseY - 130)/30); 
		}
	}
	//windowsill
	stroke(144, 120, 109);
	strokeWeight(10);
	line(130, 430, 130, 130);
	line(115, 130, 345, 130);
	line(330, 130, 330, 430);
	line(345, 430, 130, 430);
	strokeWeight(0);
	if(mouseY > 430){
		background(144, 120, 109);
		fill(200, 186, 183);
		rect(130, 130, 200, 300);
		fill(150, 140, 140);
		for(var i = 0; i < 30; i += 2){
				rect(130, 130 + i*10, 200, 10);
		}
		//lighton
		fill(252, 247, 187, 80);
		beginShape();
		vertex(360, 317);
		vertex(290, 305);
		vertex(270, 470);
		vertex(375, 470);
		endShape();
		//windowsilldark
		stroke(110, 88, 78);
		strokeWeight(10);
		line(130, 430, 130, 130);
		line(115, 130, 345, 130);
		line(330, 130, 330, 430);
		line(345, 430, 130, 430);
		strokeWeight(0);
	}
	//DESK
	fill("black");
	rect(30, 470, 400, 30, 7);
	rect(40, 500, 30, 140);
	rect(390, 500, 30, 140);
	//LAMP
	fill(170, 125, 125);
	rect(340, 460, 80, 10, 3);
	strokeWeight(13);
	stroke(170, 125, 125);
	line(380, 460, 360, 320);
	strokeWeight(10);
	line(360, 317, 290, 310);
	//GIRL
	//neck
	strokeWeight(0);
	fill(102, 83, 63);
	stroke(102, 83, 63);
	rect(135, 330, 40, 50);
	//sweater
	fill(102, 29, 53);
	stroke(102, 29, 53);
	rect(130, 365, 50, 20, 5);
	rect(90, 380, 130, 40, 20);
	//writing arm
	strokeWeight(30);
	line(210, 395, elbow, 470);
	line(elbow, 470, wrist, 470);
	stroke("black");//pen
	strokeWeight(5);
	line(wrist + 10, 410, wrist + 10, 470);
	fill(102, 83, 63);//hand
	strokeWeight(0);
	ellipse(wrist + 10, 470, 35, 35);
	if (mouseX > 210 & mouseX < 300){
		wrist = mouseX;
		elbow = .5 * (wrist - 215) + 215;
	}
	//chair
	fill(40, 20, 15);
	rect(80, 580, 25, 100);
	rect(205, 580, 25, 100);
	fill(43, 64, 69);
	stroke(43, 64, 69);
	rect(70, 400, 170, 130, 10);
	fill(32, 48, 50);
	rect(70, 525, 170, 60, 10);
	//head
	push();
	translate(157, 315);
	rotate(angle - QUARTER_PI);
	stroke(102, 83, 63);//face
	fill(102, 83, 63);
	ellipse(0, 0, 70, 80);
	strokeWeight(1); //bun
	stroke(60, 38, 33);
	fill(60, 38, 33);
	ellipse(-7, -5, 80, 100);
	fill(84, 53, 45);
	ellipse(-27, -50, 50, 50);
	fill(60, 38, 33);
	strokeWeight(3);
	ellipse(-37, -55, 20, 30);
	noFill();
	arc(-27, -54, 35, 40, PI + HALF_PI, PI);
	fill(102, 83, 63);//ear
	stroke(102, 83, 63);
	ellipse(28, 5, 10, 22);
	noFill();
	stroke(60, 38, 33);
	arc(37, -5, 10, 50, HALF_PI, PI); //hair tendril
	fill(36, 24, 24); //bun
	stroke(36, 24, 24);
	ellipse(-32, -55, 8, 15);
	stroke("white");//airpods
	fill("white");
	ellipse(30, 7, 3, 8);
	line(28, 7, 30, 17);
	//headbob
	if (mouseX > 0 & mouseX < 480){
		angle = mouseX * (1/280);
	}
	pop();


}

I was interested in creating two different scenes, and having different parts of the drawing activated based on if the mouse was moving vertically or horizontally.
Joanne Chui – Looking Outwards 03

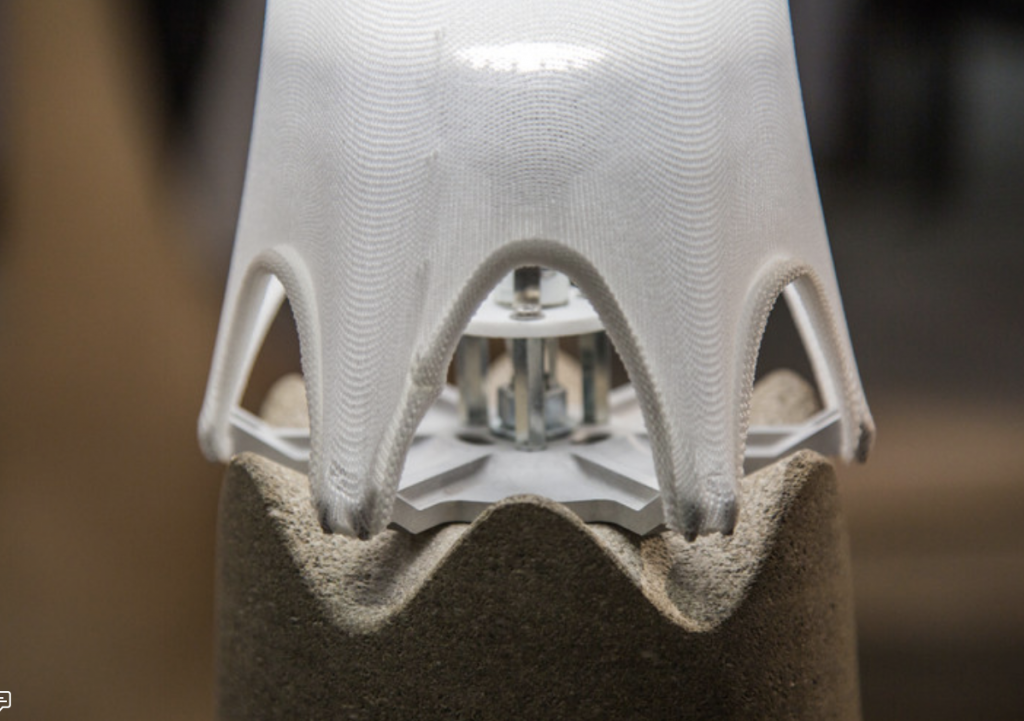
Autodesk’s Generative Design Pavilion 2016
https://www.archdaily.com/804456/autodesks-generative-design-pavilion-plays-with-properties-and-fabrication-processes-in-stone-and-fabric

Autodesk’s Generative Design Pavilion was designed by architect Sean Ahlquist and research engineer Andrew Payne to explore materiality using stone and fabric. It is interesting in how it wants to compare the different material properties of stone and fabric, juxtaposing the strength of the limestone to the flexibility of the fabric, but also merge them to create similar forms. Not only was the form generatively designed, but the fabric was customized as well. Although the fabric and the stone created similar forms, the algorithms used to create them would have been extremely different. The algorithm for fabric would have worked to exploit how the fabric stretched, while the one for the stone would have worked to calculate its breaking points and subtraction of form. The designers’ artistic sensibilities arise in the final structure not only through the form, in which the completely different materials manifest the same form, but also in the joinery that connects them. Where the fabric and stone meets, they elegantly are able to describe both material properties with having the strength of the stone stretch the canopy of fabric above.