Minjae Jeong- Final Project

sketch

//Minjae Jeong
//Section B
//minjaej@andrew.cmu.edu
//Final Project

var human = []; //array to save x y position
var count = 0;
var transp = 255; //transparency

function preload() {
    //simplified world map
    worldMap = loadImage("https://i.imgur.com/Kviuun0.png");
}

function setup() {
    createCanvas(600, 348);
    textAlign(CENTER);
}

function draw() {
    background(132, 181, 229); //rgb of image's body of water
    tint(255, transp); //this makes the water to fill up as you click
    image(worldMap, 0, 30);

    //title
    textSize(24);
    fill('red');
    text("UNTIL WHEN CAN THE EARTH SUPPORT US?", width / 2, 27);//Have you thought about it

    //Draw human + CO2
    strokeWeight(1);
    for (var i = 0; i < human.length; i++) {
        xx = human[i][0];
        yy = human[i][1];
        fill('black');
        drawHuman(xx, yy);
        drawco2(xx, yy - 5);
    }

    //display global warming text
    if (count > 20 & count < 40) {
        textSize(20);
        fill("red");
        text("GLOBAL WARMING", 350, 330);
        // count = count + 1;
    }

    //display "No more penguins and polar bears." Could be very soon
    if (count > 40 & count < 60) {
        textSize(20);
        fill("red");
        text("NO MORE PENGUINS & POLAR BEARS", 320, 50);
    }

    //display "No more place to live"
    //(Elon Musk please)
    if (count > 70 & count < 100) {
        textSize(27);
        fill("red");
        text("NO MORE PLACE TO LIVE", width / 2, height / 2);
    }

    //changes background color to black
    if (count > 90 & count < 100) {
        fill("black");
        rect(0, 0, width, height);
        fill("red");
        text("NO MORE PLACE TO LIVE", width / 2, height / 2);
    }

    //"What will you do?"
    if (count >= 100){
        fill('black');
        rect(0, 0, width, height);
        fill('red');
        textSize(30);
        text("WHAT WILL YOU DO?", width / 2, height /2);
    }
}

//draw human
function drawHuman(x, y) {
    ellipse(x, y, 5);
    rect(x - 2, y + 5, 4, 11);
    line(x - 2, y + 7, x - 8, y + 2);
    line(x + 2, y + 7, x + 8 , y + 2);
}

//CO2
function drawco2(x, y) {
    textSize(9);
    text("+ CO2", x, y);
}

function mousePressed() {
    human.push([mouseX, mouseY]); //Save mouseX, mouseY
    transp = transp - 3.3; //Water fills up the land
    count += 1;
}

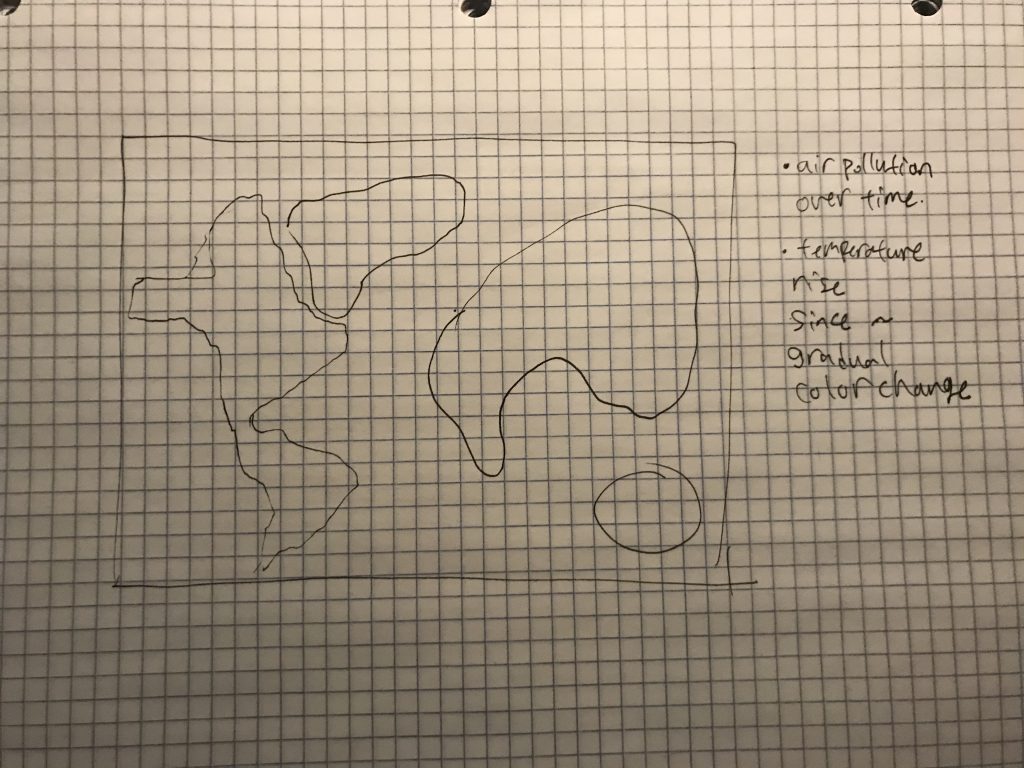
For the final project, I made an interactive map that I wish to deliver some message. Click to add people on the map, keep on adding as it represents human population on the Earth.

My final project is little different from the proposal, because the original idea, which was to indicate temperature rise and deforestation, did not have clear message compared to what it actually shows. So I rather made a simple interactive map that shows what is happening as we grow on the Earth.

Minjae Jeong-Looking Outwards 12

Relevant to my project, which is to visualize the climate change on a world map, I find this visualization of temperature rise from 1880 to 2018 by NASA Global Climate Change very helpful. The idea is very similar in a sense that I am also considering to use color change to show the change.

Global Temperature Anomalies from 1880 to 2018

https://climate.nasa.gov/climate_resources/139/graphic-global-warming-from-1880-to-2018/

Another information visualization that shows the global forest loss with Global Forest Watch is similar to my final project.

“With Global Forest Watch, you can see where forest loss is most pervasive, threatening indigenous lands, or reducing biodiversity, so we can act quickly when deforestation happens where it shouldn’t.”

https://www.globalforestwatch.org/

Two projects both used different methods to express the change, and with more brainstorming, it is possible to find another way to express the change happening over time.

Minjae Jeong- Project 12-Final proposal

For the final project, we want to create an information visualization map of the world that represents climate crisis by emphasizing either the rise of temperature around the world due to global warming, or the amount of electricity used around the world. To further elaborate on one of the idea we have proposed, the map could possibly show the amount of light (or even how big the city is) of each places. For instance, places like United States will be much brighter with more use of lights compared to third world countries. In the United States, depending on how many parts we divide it into, bigger cities like New York city or Los Angeles will light up much brighter than Wyoming. Moreover, the world map that displays the gradual increase of temperature on Earth may also be very attractive potential topic. We believe the matter of issue on global warming may be effective in order to visualize information because it is our reality that the Earth’s temperature is constantly increasing.

I will be collaborating with Jenny Lee on the final project, ylee1@andrew.cmu.edu Section C

Jenny will be responsible for coding to design the illustrative aspects of the map and Minjae will be responsible for coding the interactive aspect (of lighting up certain areas, for instance). We will both help each other to create this map art and fairly divide the work together.

Minjae Jeong-Project 11-landscape

sketch

//Minjae Jeong
//Section B
//minjaej@andrew.cmu.edu
//Project-11

var trees = [];

function setup() {
    createCanvas(480, 400);
    // collection of trees
    for (var i = 0; i < 10; i++){
        var rx = random(width);
        trees[i] = makeTrees(rx);
    }
    frameRate(100);

}

function draw() {
    background('lightblue');
    drawRoad();
    updateTrees();
    removeTrees();
    addNewTrees();
    drawRedcar(180, 230);
    drawYellowcar(260, 330);
    drawSun();
}

function drawSun() {
    fill(255, 102, 0);
    ellipse(440,20, 130);

}

function drawRoad() {
    //grey road
    fill(163);
    rect(0, 220, 480, 180);

    //white line
    fill('white');
    rect(0, 290, 480, 5);
}

function drawRedcar(x , y) {
    strokeWeight(0);

    //body
    fill('red');
    rect(x, y, 100, 20);
    rect(x + 20, y - 20, 50, 20);

    //tires
    fill('black');
    ellipse(x + 20, y + 20, 21, 21);
    ellipse(x + 80, y + 20, 21, 21);

    //wheels
    fill('white');
    ellipse(x + 20, y + 20, 15, 15);
    ellipse(x + 80, y + 20, 15, 15);

    fill('red');
    ellipse(x + 20, y + 20, 3, 3);
    ellipse(x + 80, y + 20, 3, 3);

    //windows
    fill(102, 204, 255);
    rect(x + 28, y - 17, 35, 15);
}

function drawYellowcar(x , y) {
    strokeWeight(0);

    //body
    fill('yellow');
    rect(x, y, 100, 20);
    rect(x + 20, y - 20, 50, 20);

    //tires
    fill('black');
    ellipse(x + 20, y + 20, 21, 21);
    ellipse(x + 80, y + 20, 21, 21);

    //wheels
    fill('white');
    ellipse(x + 20, y + 20, 15, 15);
    ellipse(x + 80, y + 20, 15, 15);

    fill('blue');
    ellipse(x + 20, y + 20, 3, 3);
    ellipse(x + 80, y + 20, 3, 3);

    //windows
    fill(102, 204, 255);
    rect(x + 28, y - 17, 35, 15);
}

function updateTrees(){
    for (var i = 0; i < trees.length; i++){
        trees[i].move();
        trees[i].display();
    }
}

function removeTrees(){
    var treesToKeep = [];
    for (var i = 0; i < trees.length; i++){
        if (trees[i].x + trees[i].breadth > 0) {
            treesToKeep.push(trees[i]);
        }
    }
    trees = treesToKeep; // remember the surviving buildings
}

function addNewTrees() {
    //probability of new trees
    var newTreeLikelihood = 0.01;
    if (random(0,1) < newTreeLikelihood) {
        trees.push(makeTrees(width));
    }
}

// method to update position of tree every frame
function treeMove() {
    this.x += this.speed;
}

// draw the trees
function treeDisplay() {
    fill(119, 83, 0);
    noStroke();
    push();
    translate(this.x, height - 230);
    noStroke();
    rect(0, 0, 15, 50);
    pop();

    fill(0, 153, 0);
    noStroke();
    push();
    translate(this.x, height - 230);
    noStroke();
    ellipse(0, 20, 40);
    ellipse(10, 3, 40);
    ellipse(20, 20, 40);
    pop();
}

function makeTrees(birthLocationX) {
    var tree = {x: birthLocationX,
                y: 200,
                breadth: 50,
                speed: -1.0,
                move: treeMove,
                display: treeDisplay}
    return tree;
}

For this project, I wanted to create a project that displays cars and the surroundings, which are sky, trees, road, and a sun. It was more challenging than my expectation but will be fun and useful once I absorb it.

Minjae Jeong-LookingOutwards11

While browsing through the provided list of women practitioners, I found Heather Kelley and her game “Superhypercube” very interesting. Superhypercube is a “first person puzzler” on PlaystationVR.

“To play, you control a group of cubes, rotating it to fit through a hole in a series of floating walls that are constantly moving toward you. Each time you fit through another wall without crashing, more cubes are added to your cluster. Head tracking is critical in the game – as your cluster of cubes gets bigger, you will need to lean around it to see the hole and quickly determine what rotations to make. Stay alive as long as possible, and add your high scores to the ranks of players around the world!”

Superhypercube trailer

What I find interesting about this game is that while I am still not familiar with VR games, this game is a seemingly simple educational puzzle game but playing it in VR actually makes it more fun, which is very important aspect in games.

Heather Kelley is a co-founder of Kokoromi, an experimental game collective, with whom she has produced and curated GAMMA event, promoting experimental games as a creative expression in a social context.

Minjae Jeong-project10-sonic sketch

sketch

//Minjae Jeong
//Section B
//minjaej@andrew.cmu.edu
//Project-10-SonicSketch

var myTopL;
var myTopR;
var myBotL;
var myBotR;

function preload() {
    myTopL = loadSound("https://courses.ideate.cmu.edu/15-104/f2019/wp-content/uploads/2019/11/808bass.wav");
    myTopR = loadSound("https://courses.ideate.cmu.edu/15-104/f2019/wp-content/uploads/2019/11/bass-1.wav");
    myBotL = loadSound("https://courses.ideate.cmu.edu/15-104/f2019/wp-content/uploads/2019/11/snare-1.wav");
    myBotR = loadSound("https://courses.ideate.cmu.edu/15-104/f2019/wp-content/uploads/2019/11/hihat.wav");
}

function setup() {
    createCanvas(400, 400);
    //======== call the following to use sound =========
    useSound();
}

function soundSetup() { // setup for audio generation
    myTopL.setVolume(0.5); //808 bass
    myTopR.setVolume(0.3); //bass
    myBotL.setVolume(0.3); //snare
    myBotR.setVolume(0.3); //hihat
}

function draw() {
    background(0);
//draw each squares
    push();
    translate(40, 40);
    fill('yellow');
    rect(0, 0, 150, 150);
    pop();

    push();
    translate(210, 40);
    fill('red');
    rect(0, 0, 150, 150);
    pop();

    push();
    translate(40, 210);
    fill('blue');
    rect(0, 0, 150, 150);
    pop();

    push();
    translate(210, 210);
    fill('green');
    rect(0, 0, 150, 150);
    pop();
}

//when a square is pressed, play the sound
function mousePressed() {
    if (mouseX > 40 & mouseX < 190 && mouseY > 40 && mouseY < 190) {
        myTopL.play();//808bass
    }
    if (mouseX > 210 & mouseX < 360 && mouseY > 40 && mouseY < 190) {
        myTopR.play();//bass
    }
    if (mouseX > 40 & mouseX < 190 && mouseY > 210 && mouseY < 360) {
        myBotL.play();//snare
    }
    if (mouseX > 210 & mouseX < 360 && mouseY > 210 && mouseY < 360) {
        myBotR.play();//hihat
    }
}

For this project, I wanted to create a very simple version of “launchpad.” The four sounds are some of the most common sounds used in beat-making.

Each button plays different sounds:

Yellow – 808 Bass

Red- Bass

Blue – Snare

Green – Hi-hat

Minjae Jeong-looking outwards-10-computational music

For this week’s looking outwards, I found a Tedx talk by Ge Wang, who makes computer music. He uses a programming language called “Chuck,” and what surprised me the most in the beginning of his lecture was that I expected the software to be something similar to Logic X pro and Qbase which are professional producing softwares, but he was literally “coding”
to generate a sound. Although the basic demonstration was very simple but with the use of technology, Stanford laptop orchestra performs a piece of music with each laptop as an instrument. One of the most attractive thing about computational music to me is the ability to generate any sound, and with such ability, computational music can really create any music or sound that the “composer” wants to express.

Minjae Jeong-project09

sketch

//Minjae Jeong
//Section B
//minjaej@andrew.cmu.edu
//Project-9


var underlyingImage;

function preload() {
    var myImageURL = "https://i.imgur.com/4WraCGa.jpg";
    underlyingImage = loadImage(myImageURL);
    underlyingImage.resize(480,480);
}

function setup() {
    createCanvas(480, 480);
    background(0);
    underlyingImage.loadPixels();
    frameRate(10);
}

function draw() {
    var px = random(width);
    var py = random(height);
    var ix = constrain(floor(px), 0, width-1);
    var iy = constrain(floor(py), 0, height-1);
    var theColorAtLocationXY = underlyingImage.get(ix, iy);

    noStroke();
    fill(theColorAtLocationXY);
    var size = random(10, 30); //random from 1-10
    ellipse(px, py, size, size); //draw circles!

    var theColorAtTheMouse = underlyingImage.get(mouseX, mouseY);
    stroke(theColorAtTheMouse);
    textSize = random(10, 30);
    text("SQUARE", mouseX, mouseY); //draw "squares"
}

For this project, I used a photo of my roommate. One issue I could not solve was to adjust the size of the picture according to the canvas size, which is currently 3024 x 4032. Because of it, I do not think canvas is showing the whole image properly, which is why there are so many browns on canvas.

Minjae Jeong-Looking Outwards-09

For this looking outwards post, I found Jenny Lee’s post on “eCLOUD”, created by artist Aaron Koblin. I think this interactive installation is interesting in a way that it replicates the shape and volume of a cloud real time. I agree with Jenny’s assessment on the cloud that the installation gives the audience chance to feel the different weather from different locations. I personally like this project more because it is installed at San Jose international airport, which makes the audience more relative to the project since they are in weather-sensitive situation. I also think this project has major potential in expanding the installation, by implementing weather elements that are important to travelers, like precipitation and wind.

Minjae Jeong-Looking Outwards-08

Daniel Shiffman is an Associate Arts Professor at the Interactive Telecommunications Program at NYU’s Tisch School of Arts. He uploads creative coding tutorials every week on his youtube channel “The Coding Train”.

Daniel Shiffman is definitely one of the most inspiring person among the other speakers. Before I registered 15-104, I wanted to explore what p5.js is, and I found Shiffman’s youtube channel, The Coding Train. His lectures were very easy to understand, fun, and less overwhelming than other programming lectures or tutorials I used to see. It is very obvious that he provides quality lectures rich in information when the reading assignments are his youtube videos. Although I do not watch his videos often, but as I continue learning p5.js, it is one of the websites I would go on if I don’t understand or need more studying.