YouieCho-LookingOutwards-07

The animated map allows to see the big picture in train movements and to spot systemic effects. Peak Spotting by Christian Au, Moritz Stefaner, Stephan Thiel, Christian Laesser, Gabriel Credico, Lennart Hildebrandt, and Kevin Wang

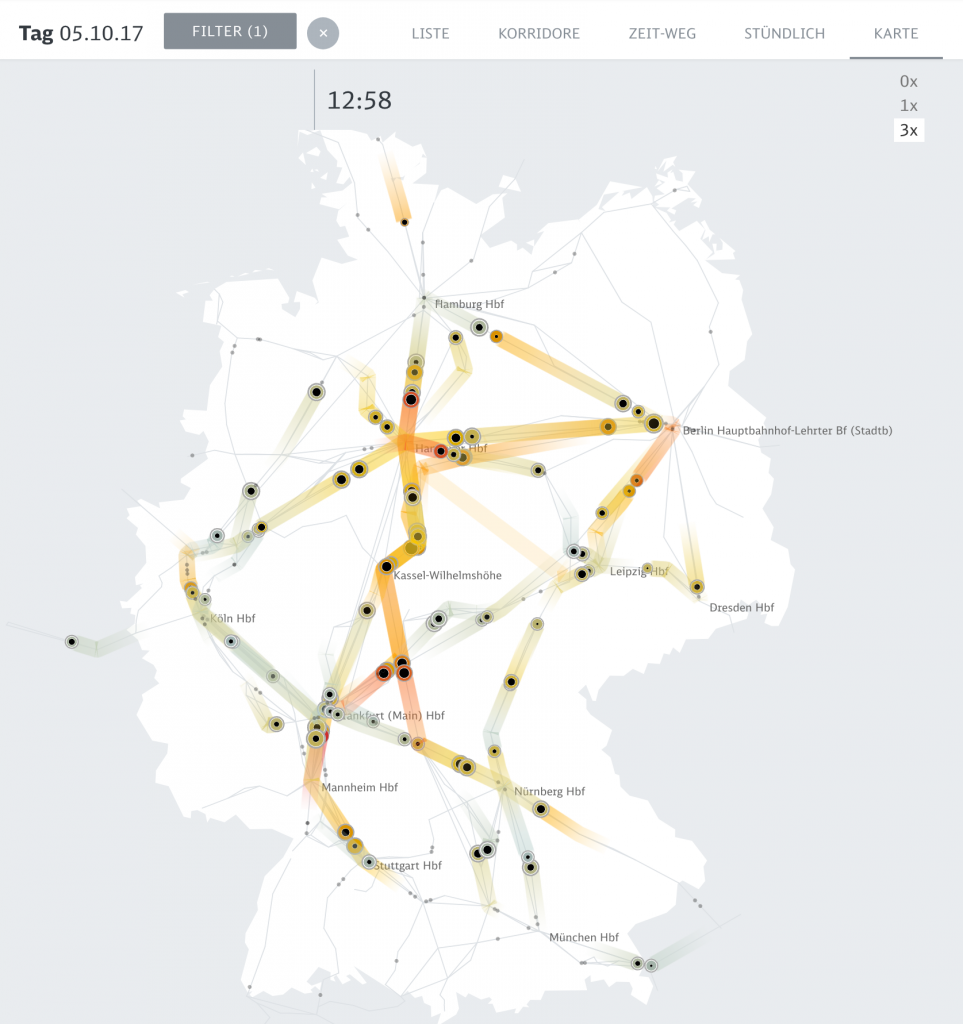
The computational information visualization that I looked at is “Peak Spotting.” This is a means to combine machine learning and visual analytics methods to help manage the passenger loads on trains in Germany. It has a futuristic elements in the web application that integrates millions of datapoints over 100 days in the future to make predictions, and custom developed tools such as animated maps, path-time-diagrams, and stacked histograms create a vast range of types of data. The clearly color-coded visualizations point out what the critical bottlenecks are within the traffic difficulties. I think that the overall aesthetics is very helpful for understanding the data because it is subtle and readable with highly effective key colors. I can immediately know what kind of data I am looking at, and what time period the data are relevant to. Navigation also gives a good guidance.

Peak Spotting Preview

YouieCho-Project-07-Composition-with-Curves

sketch

/* Youie Cho
   Section E
   minyounc@andrew.cmu.edu
   Project-07-Composition-with-Curves*/

var nPoints = 500;

function setup() {
    createCanvas(480, 480);
}

function draw() {
    //background color changes based on mouse location
    background(mouseX / 2, 50, mouseY / 2);
    Epitrochoid();
}

function Epitrochoid() {
    stroke(255);
    strokeWeight(0.5);
    //fill color changes based on mouse location
    fill(mouseX, mouseX / 2, mouseY);
    push();
    //begin at the center of the canvas
    translate(width / 2, height / 2);
    //constrain through mouseX and mouseY
    var consx = constrain(mouseX, 0, mouseX, 0, width);
    var consy = constrain(mouseY, 0, mouseY, 0, height);
    //define constants that depend on mouse position
    var a = map(consx, 0, width, 0, width / 3);
    var b = map(consy, 0, width, 0, width / 5);
    var h = map(consy, 0, height, 0, 400);
    //draw primary epitrochoid curve
    beginShape();
    for (var i = 0; i < nPoints; i ++) {
        var t = map(i, 0, nPoints, 0, TWO_PI);
        var x = (a + b) * cos(t) - h * cos((a + b) / b * t);
        var y = (a + b) * sin(t) - h * sin((a + b) / b * t);
        vertex(x, y);
        //draw secondary epitrochoid curve rendered with small rectangles
        rect(x * 1.5, y * 1.5, 15, 15);
        //draw terciary epitrochoid curve rendered with large rectangles
        rect(x * 3, y * 3, 30, 30);
    }
    endShape(CLOSE);
    pop();
}

I chose to use the Epitrochoid curve. I chose this curve because first, I wanted to play around with many constants, and second, I thought that the curly movement is interesting. Because of the way the curve draws in a curly and dynamic way, I though it would be more harmonious to use differently rendered curves derived from the primary curve, instead of adding new Epitrochoid curves that would overlap with the primary curve. It was difficult to understand the different values in the equation, and which valuables controlled the curve in what ways, but after studying it for a while, I could make it so that the details that I wanted were being displayed on the canvas at an appropriate scale. It was very fun to be able to create something very complex and dynamic with the help of a mathematical equation.


YouieCho-Project-06-Abstract-Clock

sketch

/* Youie Cho
   Section E
   minyounc@andrew.cmu.edu
   Project-06-Abstract-Clock*/

function setup() {
    createCanvas(300, 480);
}

function draw() {
    background(0);

    // Current time
    var M = minute(); // MIN: face width
    var S = second(); // SEC: face color, mouth curve, sparkling background
    var H = hour(); // HR: eyebrow angle, white bar progression
    noStroke();

    // SEC background sparkles as one frame is displayed per second
    for (var i = 0; i < 60; i ++) {
        frameRate(1);
        var x = random(0, width);
        var y = random(0, height);
        var diam = random(0.1, 2);
        ellipse(x, y, diam, diam);
    }

    // MIN face changes from narrow to wide from 0 to 59 minutes
    var face = map(M, 0, 59, 120, 230);
    // SEC face color gets redder from 0 to 59 seconds
    var g = map(S, 0, 59, 197, 21);
    var b = map(S, 0, 59, 143, 0);
    fill(225, g, b);
    ellipse(150, 150, face, 195);

    //SEC mouth changes from a downward to an upward curve from 0 to 59 seconds
    fill(255, 116, 74);
    var mouth  = map(S, 0, 59, 0, width);
    bezier(110, 180, 130, 220 - mouth / 3, 170, 220 - mouth / 3, 190, 180);

    //HR eyebrows move from horizontal lines to angled lines from 0 to 23 hours
    stroke(255);
    strokeWeight(7);
    var brow = map (H, 0, 23, 95, 75);
    line(105, 95, 130, brow);
    line(170, brow, 195, 95);

    //HR white bar progresses from left until the flame icon from 0 to 23 hours
    noStroke();
    fill(30);
    rect(67, 350, 176, 20);
    fill(255);
    var HBar = map(H, 0, 23, 0, 176);
    rect(67, 350, HBar, 20);

    //static elements:
    //eyes
    stroke(0);
    fill(0);
    ellipse(120, 120, 8, 8);
    ellipse(180, 120, 8, 8);
    //flame icon
    ellipseMode(CENTER);
    noStroke();
        //outer flame
    fill(168, 45, 0);
    ellipse(238, 364, 31, 31);
    triangle(223, 359, 238, 329, 253, 359);
        //inner flame
    fill("yellow");
    ellipse(238, 369, 21, 21);
    triangle(228.5, 364, 238, 349, 247, 364);
}

The idea I had for this project was showing stress level throughout the day in a comical way, because I was particularly very tired and frustrated when I began working on this. The face shows a sad expression, redder color, etc. as the time passes, and the bar at the bottom shows how much you are through the day. I could really understand how a clock can work by starting with the base code. I think it was a good opportunity for me to clarify what different variables can mean. For instance, if I make a “second” variable, I have to know if I am referring to the exact number, or a variable that somewhat represents the change of numbers. Overall, it was fun.

YouieCho-LookingOutwards-06

Computer-art image by Aaron Marcus, 1967

This work is an computer artwork done by Aaron Marcus. It was created by random filling in a grid of lines and solid areas. The randomness in filling was done by receiving results from a random-number generator. I believe that these numbers were random, as opposed to pseudo-random. I find this inspiring because the visual complexity and handcrafted artifact quality give it compelling characteristics. It shows a high-tech style, but also a more traditional art style. The straight lines and corners interact within the round circle shape in an interesting way, and the circle feels more defined in some places along the circumference, more blurry in other parts. I think the simplicity of black and white reinforces the effects that the randomness creates.

Evolving Gravity by Aaron Marcus, 1972-4. An early computational work by Marcus

YouieCho-LookingOutwards-05

Guardians of the Galaxy Vol. 2, Marvel Studios, 2017
Baby Groot in Guardians of the Galaxy Vol. 2, Framestore, 2017

For this week’s Looking Outwards, I chose the computer graphics work of Baby Groot character that was animated in Guardians of the Galaxy Vol. 2. I think this is a work that is very important in the movie because it has so many cute elements with natural animation. The sequence was done by Framestore, whose animation supervisor was Arslan Elver. Framestore intiially looked into characteristics of babies and young children. Then, they modified the design so that it would feel more mature than a human baby, and “autistic.” After creating the graphics, they had to animate within various contexts in the movie. I think an inspiring process is the way Framestore did animation tests to see how its walking and running cycle would be; there especially had to be sensible decisions made for it to be moving next to other human figures. how they added an extra distance in the movement so that it wouldn’t need extra steps.

Baby Groot in Guardians of the Galaxy Vol. 2, Framestore, 2017

YouieCho-Project-05-Wallpaper

sketch

/* Youie Cho
   Section E
   minyounc@andrew.cmu.edu
   Project-05-Wallpaper*/

function setup() {
    createCanvas(600, 600);
    noStroke();
}

function draw() {
    background(0);
    drawPattern();
}

function drawPattern() {
    var diam = 5; // dots
    var r = 0;
    var b = 0;
    var ratioC = 0; //increase for circle
    var ratioR = 0; //increase for rectangle
    var increment = 25;
    for (var y = increment; y < height; y += increment) {
        for (var x = increment; x < width; x+= increment) {
            //color gradient
            r = map(y, 0, height, 255, 0);
            b = map(x, 0, height, 0, 255);
            fill(r, 100, b);
            //dot
            ellipse(x, y, diam, diam);
            //outer circle increases from bottom to top
            noFill();
            stroke(r, 100, b);
            strokeWeight(0.5);
            ratioC = map(y, 0, height, 110, 0);
            ellipse(x, y, diam + ratioC, diam + ratioC);
                //inner circle increases from bottom to middle
                if(y < width / 2) {
                    strokeWeight(0.3);
                    ellipse(x, y, diam + ratioC / 2, diam + ratioC / 2);
                //squares decrease from bottom to middle
                } else {
                    rectMode(CENTER);
                    ratioR = map(y, height, 0, 60, 0);
                    rect(x, y, diam + ratioR, diam + ratioR);
                }
        }
    }
    noLoop();
}

During this project, it was fun to experiment with mapping color, scale, and shapes along vertical and horizontal axes. The pattern shapes are composed of: 1. dot + inner circle + outer circle, and 2. dot + inner circle + square.

Initial layout with pattern shapes

YouieCho-Project-04-String-Art

sketch

/*Youie Cho
  Section E
  minyounc@andrew.cmu.edu
  Project-04-String Art*/

  var a = 7
  var b = 1

  function setup() {
      createCanvas(400, 300);
      angleMode();
  }

  function draw() {
      background(255, 179, 0);
      //pink sequence
      for (var i = 1; i < 1000; i++) {
          stroke(255, 69, 128);
          line(mouseX, i * a* mouseY / 100, i * a, height / 4);
      }
      //black sequence and rotation
      for (var i = 1; i <= 1000; i++) {
          stroke(0);
          rotate(90);
          line(mouseX, i * mouseY / 50, i * b, height / 2);
      }
      //yellow sequence and rotation
      for (var i = 1; i <= 1000; i++) {
          stroke(255, 215, 69);
          rotate(180);
          line(mouseX, i * mouseY / 25, i * a, height / 1.333333);
      }
      //purple sequence and rotation
      for (var i = 1; i <= 1000; i++) {
          stroke(174, 82, 255);
          rotate(270);
          line(mouseX, i * mouseY / 10, i * b, height);
      }
  }

I tried to play around with changing ratios to generate different sequences on different parts of the canvas, and rotated them to create complexity. I tried complex lines because interesting shapes and patterns can be generated through the movement of the mouse. It was challenging to understand the mechanism of loop, but I enjoyed how dynamic it could be.

YouieCho-LookingOutwards-04

Weather Thingy – Real time climate sound controller , created by Adrien Kaeser at ECAL

Weather Thingy is a sounds controller that takes real time climate-related events data to control and modify the stings of musical instruments. It is made up of a weather station on a tripod microphone, and a custom built controller that is connected to the weather station. I think this is very inspiring for me because I had never thought of connecting weather data with sound production. This has sensors that observe the climate and assign various parameters received to audio effects. The creator’s artistic sensibilities, in my opinion, especially come in the very clear and minimal that makes use of clear color-coded buttons, as well as customized parts of the project as a whole. It is also notable that there are many real-time interactions going on.

The user can at any time constrain the value received or amplify it with two potentiometers on the edges of the screen  (Creative Applications Network).

YouieCho-Project-03-Dynamic-Drawing

sketch

/*Youie Cho
  Section E
  minyounc@andrew.cmu.edu
  Project-03-Dynamic-Drawing*/

function setup() {
    createCanvas(480, 640);
    rectMode(CENTER);
}

function draw() {
    //background changes color based on mouse movement
    background(mouseX, mouseY, 180);
    //gray boundary frames background
    noFill();
    stroke(150);
    strokeWeight(5);
    rect(width / 2, height / 2, width, height);
    // mouseX is limited to 70-350
    var m = max(min(mouseX, 350), 70);
    var size = m * 350.0 / 480.0;
    strokeWeight(2);
    //purple square (rectangle)
    fill(210, 171, 255);
    rect(50 + m * 190.0 / 480.0, 200.0, size, size);
    //pink square
    fill(255, 207, 236);
    size = 350 - size;
    rect(150 + m * 190.0 / 480.0, 200.0, size, size);
    //blue square
    fill(179, 255, 255);
    size = 350 - size;
    rect(200 + m * 190.0 / 480.0, 200.0, size, size);

    /*yellow squares translate and rotate based on mouse movement
      color warmth changes based on mouseY*/
    stroke(200);
    strokeWeight(1);
    fill(255, mouseY + 150, 100);
    //yellow square 1
    push();
    translate(mouseX * 2.1, mouseY * 2.1);
    rotate(radians(mouseX / 10));
    rect(100, 250, 20, 20);
    pop();
    //yellow square 2
    push();
    translate(mouseX * 1.3, mouseY * 1.3);
    rotate(radians(mouseX / 10));
    rect(150, 290, 20, 20);
    pop();
    //yellow square 3
    push();
    translate(mouseX * 0.7, mouseY * 0.7);
    rotate(radians(mouseX / 10));
    rect(210, 340, 20, 20);
    pop();
    //yellow square 4
    push();
    translate(mouseX * 0.3, mouseY * 0.3);
    rotate(radians(mouseX / 10));
    rect(280, 400, 20, 20);
    pop();
    //yellow square 5
    push();
    translate(mouseX * 0.1, mouseY * 0.1);
    rotate(radians(mouseX / 10));
    rect(360, 470, 20, 20);
    pop();


    /*pink circles translate based on mouse movement
      they vary in size and rate of rotation*/
    fill(255, 110, 131);
    stroke(100);
    //pink circle 1
    push();
    translate(p5.Vector.fromAngle(millis() / 1000, 150));
    rotate(radians(mouseX / 10));
    ellipse(250, 400, 20, 20);
    pop();
    //pink circle 2
    push();
    translate(p5.Vector.fromAngle(millis() / 950, 150));
    rotate(radians(mouseX / 10));
    ellipse(255, 395, 30, 30);
    pop();
    //pink circle 3
    push();
    translate(p5.Vector.fromAngle(millis() / 900, 150));
    rotate(radians(mouseX / 10));
    ellipse(260, 390, 40, 40);
    pop();
    //pink circle 4
    push();
    translate(p5.Vector.fromAngle(millis() / 850, 150));
    rotate(radians(mouseX / 10));
    ellipse(265, 385, 50, 50);
    pop();
    //pink circle 5
    push();
    translate(p5.Vector.fromAngle(millis() / 800, 150));
    rotate(radians(mouseX / 10));
    ellipse(270, 380, 60, 60);
    pop();
    //pink circle 6
    push();
    translate(p5.Vector.fromAngle(millis() / 750, 150));
    rotate(radians(mouseX / 10));
    ellipse(275, 375, 70, 70);
    pop();
    //pink circle 7
    push();
    translate(p5.Vector.fromAngle(millis() / 700, 150));
    rotate(radians(mouseX / 10));
    ellipse(280, 370, 80, 80);
    pop();
}

It was fun to try controlling range of colors and creating movements that can change over time based on mouse movement.

YouieCho-LookingOutwards-03

Keyboard Frequency Sculpture by Michael Knuepfel, 2011

This is “Keyboard Frequency Sculpture” designed by a NYU design student Mie Knuenfel. This work caught my attention because it is simple, but a very straightforward computational digital fabrication showing a simple set of data. Although there are many other sophisticated works with abstract or complex data, as well, this work was inspiring for me because I could easily relate to and it seemed approachable to look into. This is a 3D visualization of the frequency of which keys on the keyboard are used. The frequencies are spatialized onto a QWERTY keyboard, represented in blocks of different heights. I think the artist was sensible in the way he created a rather straightforward representation with the Apple keyboard that most people are familiar with. I believe that creating computational digital fabrication with complex algorithms and high technology is important and appreciable, but it is also important to keep in mind how the work would appeal to its audience. This work spoke to me with its directness and clarity.

Process