Min Ji Kim Kim – Project 07 – Curves

sketch

/*
Min Ji Kim Kim
Section A
mkimkim@andrew.cmu.edu
Project-07
*/

function setup() {
    createCanvas(480, 480);
}

function draw () {
    background(0);
    drawHypotrochoid(); //draw the Hypotrochoid
    drawHypocycloidPC(); //draw the Hypocycloid Pedal Curve
}

function drawHypotrochoid() { //http://mathworld.wolfram.com/Hypotrochoid.html
    var a = int(map(mouseX, 0, width, 100, 200)); //radius of Hypotrochoid
    var b = int(map(mouseY, 0, height, 50, 80)); //radius of circle b
    var h = int(map(mouseX, 0, width, 40, 50)); //distance between center and point P of circle with radius b    
    //draw Hypotrochoid
    push();
    translate(width / 2, height / 2); //move center to middle of canvas
    fill(150, mouseX, mouseY); //color changes depending on mouseX and mouseY
    beginShape(); 
    for(var i = 0; i < 100; i++) { 
        var tH = map(i, 0, 100, 0, TWO_PI); //map theta angle
        var x = (a - b) * cos(tH) + h * cos((a - b) * tH); //parametric equations
        var y = (a - b) * sin(tH) - h * sin((a - b) * tH);
        vertex(x, y);
    }
    endShape();
    pop();
}

function drawHypocycloidPC() { // http://mathworld.wolfram.com/HypocycloidPedalCurve.html
    var a = int(map(mouseY, 0, height, 30, 80)); //map the radius with mouseX movement
    var n = int(map(mouseX, 0, width, 5, 20)); //map the number of cusps with mouseX movement
    //draw Hypocycloid Pedal Curve
    push();
    translate(width / 2, height / 2); //move center to middle of canvas
    fill(mouseY, 100 , 120); //color changes depending on mouseY
    beginShape();
    for(var i = 0; i < 500; i++) {
        var t = map(i, 0, 500, 0, TWO_PI); //map theta angle
        var x = a * ((n - 1) * cos(t) + cos((n - 1) * t)) / n; //pedal curve equations
        var y = a * ((n - 1) * sin(t) + sin((n - 1) * t)) / n;
        vertex(x, y);
    }
    endShape();
    pop();
}

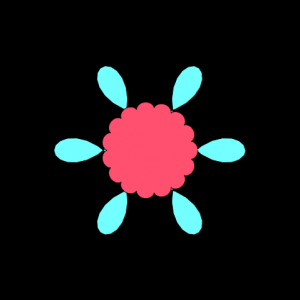
I think this was the hardest project to do so far. I didn’t really understand the assignment so I just started by looking at the curves on MathWorld and I was really interested in the Hypotrochoid and the Hypocycloid Pedal Curves. I decided to use those for this project and layer them to create a flower like effect. I think the hardest part of this project was trying to figure out the formulas and how to manipulate the variables but once I got it, it was fun to play around with the shapes and colors. I used mouseX and mouseY to manipulate the variables and the colors to create pretty flowers.

top left
bottom right
top right

Min Ji Kim Kim – Looking Outwards – 07

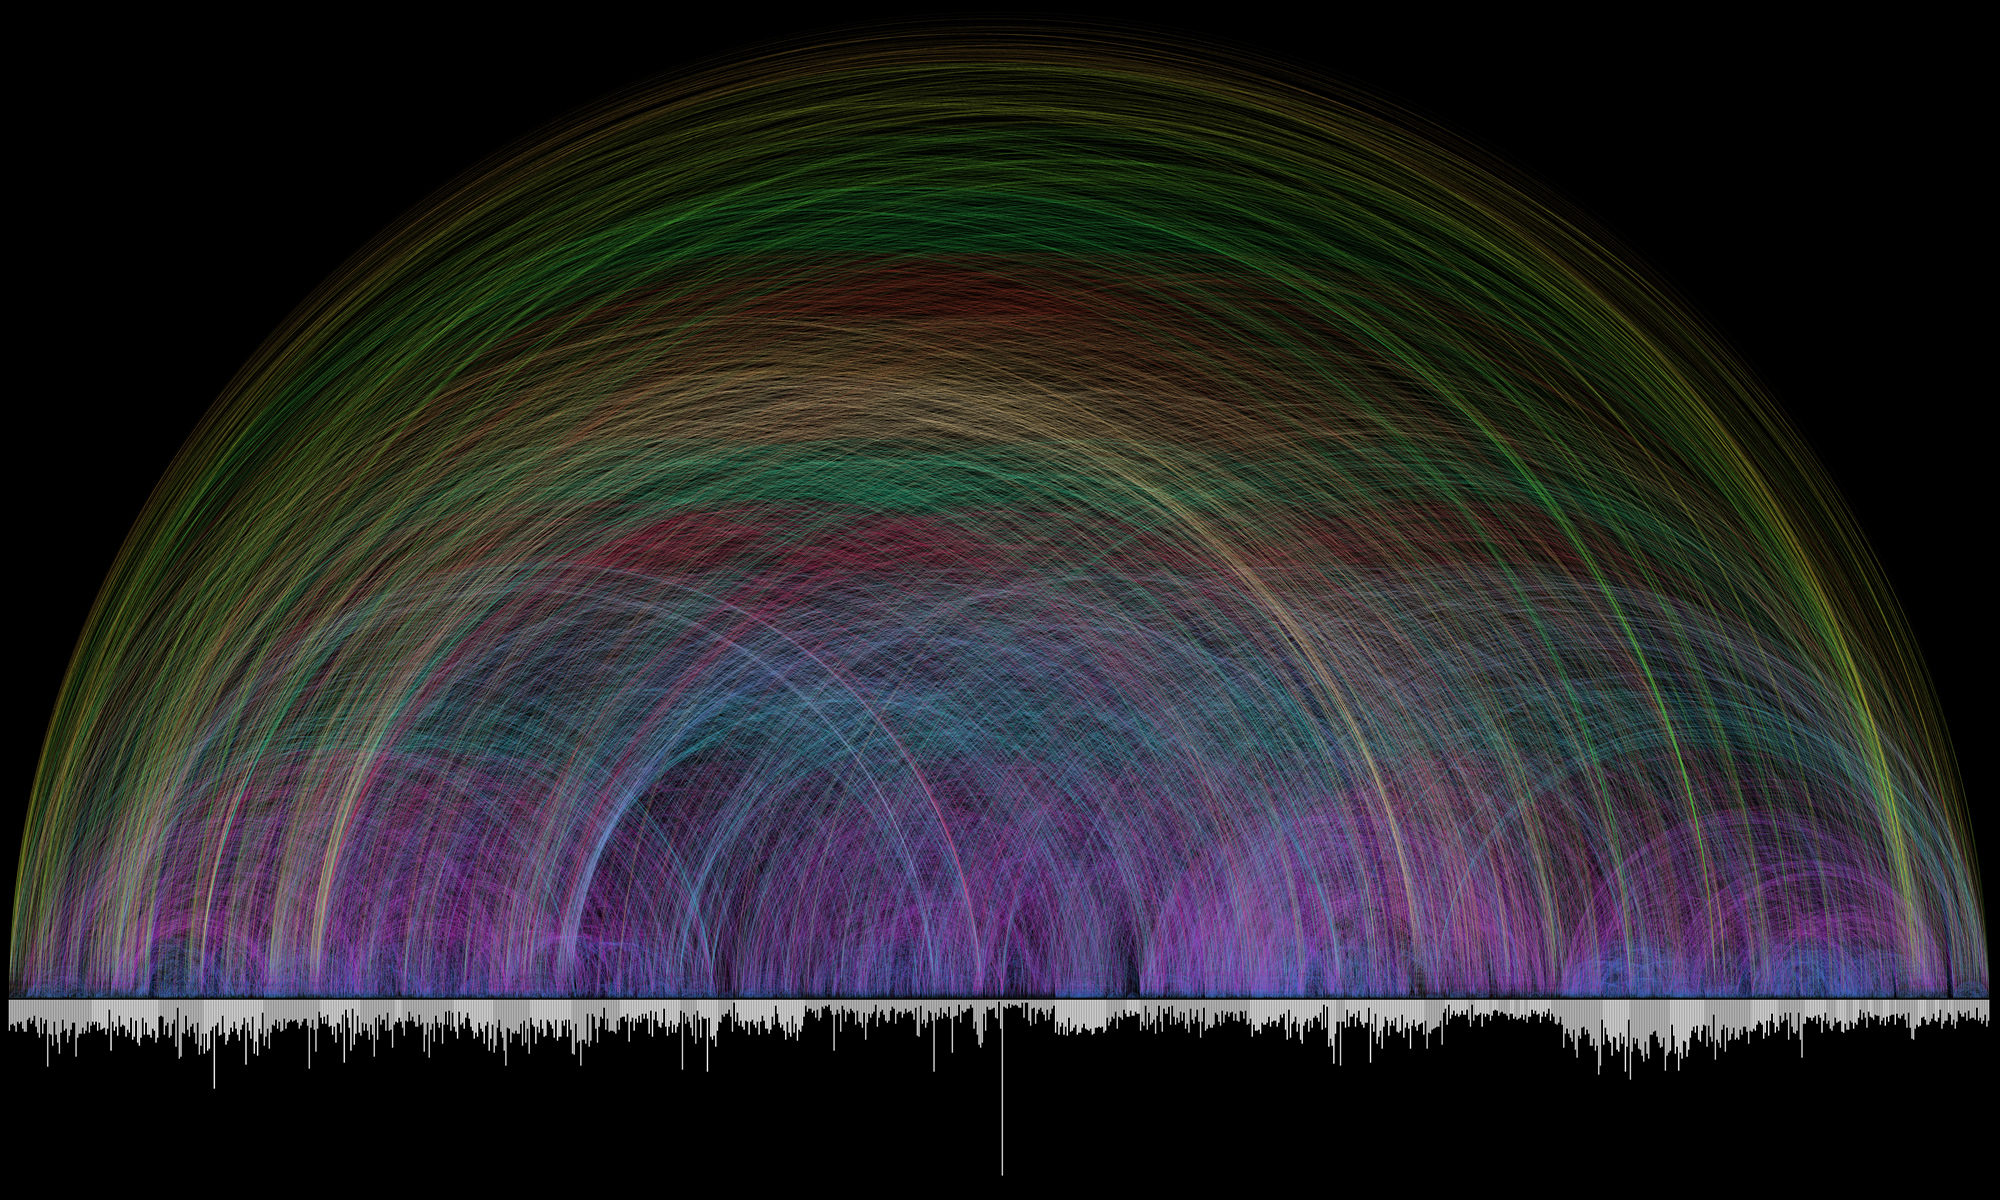
Chris Harrison’s Bible Cross-References data visualization

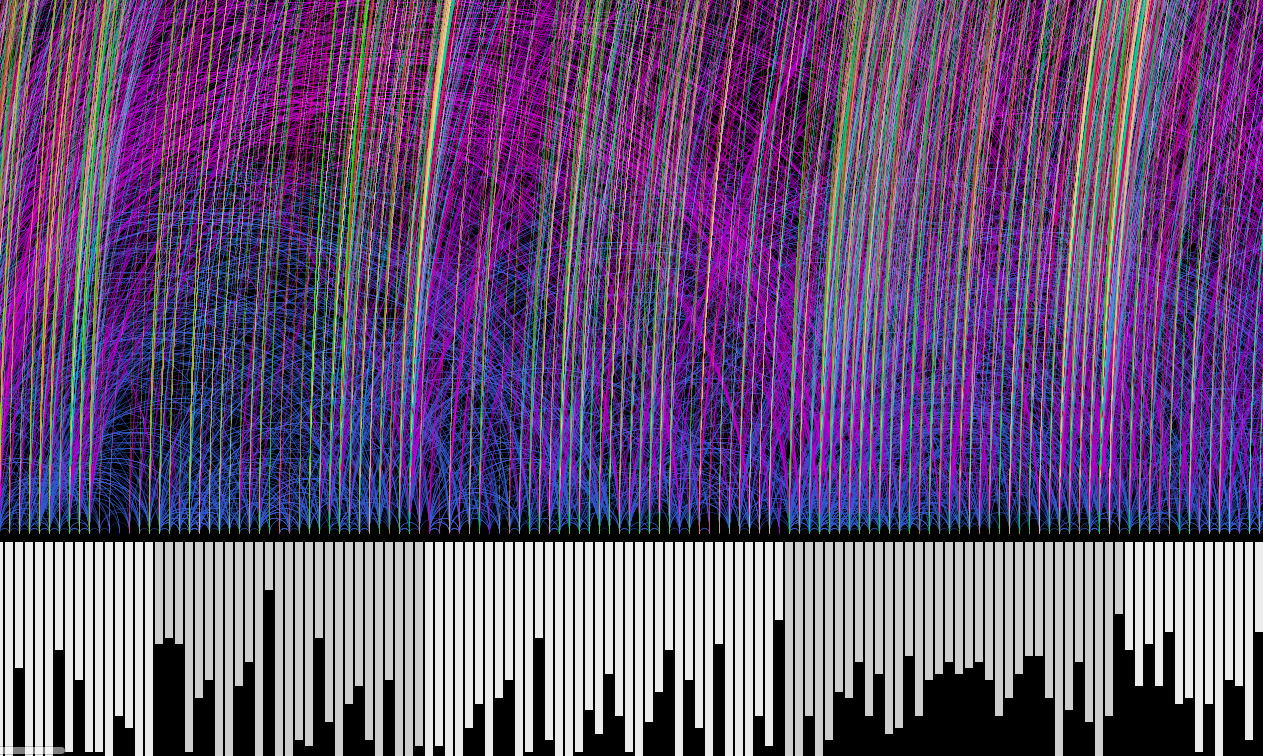
Bible Cross-References is a collaboration piece between Chris Harrison and Pastor Christoph Römhild. Pastor Römhild had begun putting together data on cross-references within the Bible and wanted to visualize them with the help of Harrison. Together, they were able to take over 63,000 cross references to create this beautiful rainbow. The bottom bars are the different books of the Bible (alternating color between white and gray) and the bar length is how many verses each chapter has. The arc color denotes the distance between the cross-referenced chapters.

Closeup of a portion of the Bible Cross-References data visualization piece.

I am a Christian, and while reading my study Bible there have been multiple times I have thought, “There are so many cross-references to other books, I wonder if we could analyze them… that would be amazing”. When I found this piece, I was fascinated. Looking at these cross-references visually though Harrison’s work has really shed a light on how extensively connected the Bible is and I am in awe. I really appreciate how Harrison and Römhild were able to create such a beautiful piece using data from the Bible.

You can see his other data visualization projects here.

Min Ji Kim Kim – Project 06 – Abstract Clock

sketch

/*
Min Ji Kim Kim
Section A
mkimkim@andrew.cmu.edu
Project-06
*/

function setup() {
    createCanvas(350, 480);
}

function draw() {
    var h = hour();
    var m = minute();
    var s = second();

    background(0); //map time to fit the boxes
    mS = map(s, 0, 59, 0, 110);
    mM = map(m, 0, 59, 0, 110);
    mH = map(h, 0, 23, 0, 110);
    
    //purple rectangle
    noStroke();
    fill('#804FB3');
    rect(150, 140, 20, 40);
    
    //yellow rectangle
    fill('#edd011');
    rect(190, 300, 20, 40);

    //blue hour
    strokeWeight(10);
    stroke('#e3edff');
    fill('#0058ff');
    rect(60, 20, 120, 120);
    
    //red minute
    stroke('#ffdbdb');
    fill('#ff3333');
    rect(140, 180, 120, 120);
    
    //green second
    stroke('#d7ffcf');
    fill('#2bcf2b');
    rect(105, 340, 120, 120);

    //changing the box color inside to match time
    noStroke();
    fill('#82adff');
    rect(65, 25, 110, 110 - mH); //hour
    fill('#ff9696'); //minute
    rect(145, 185, 110, 110 - mM);
    fill('#a2fc90'); //second
    rect(110, 345, 110, 110 - mS);

    //display time on top
    noStroke();
    fill(255);
    text(nf(h, 2, 0) + ":" + nf(m, 2, 0) + ":" + nf(s, 2, 0), 270, 30);
    textSize(18);
}

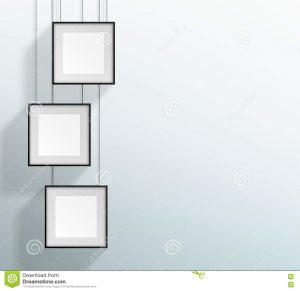
At first I didn’t really know how to approach this project, so I started looking at what kind of shapes I wanted to use for my clock. I ultimately found inspiration from a picture of hanging frames online. I started by sketching the shapes using magic numbers and then I tried to figure out how to use the hour, minute, and second functions to manipulate the time. I used the map function to manipulate the time increments to fit the box height. I decided to use primary colors for the boxes and secondary colors for the small rectangles connecting the boxes. Time is indicated by the increasing darker hues in the lighter hue background. Overall, I had a lot of fun creating this abstract clock.

inspiration from dreamstime

Min Ji Kim Kim – Looking Outwards – 06

Blue White Black 0.48 by Tyler Hobbs

Blue White Black 0.48 by Tyler Hobbs is one of his many algorithmic computational pieces that displays the properties of randomness. Hobbs is a generative artist that particularly focuses on the interaction between randomness and order. This particular piece models how brush strokes would appear on a physical canvas. At first glance, the painting exudes a loose and free vibe. However, upon closer inspection, you can actually notice the fine structure and detail involved in the rendering of each brush stroke. By using computational algorithms, Hobbs created an art piece that seems random at first, but is actually made with extreme mathematical precision. 

A close-up of a portion of Blue White Black 0.48

I was attracted to this art piece because of how realistic the brush strokes and paint drips were rendered. These brush strokes looked really random to me at first but after looking closely, the details and preciseness involved amazed me. I really loved how Hobbs was able to blend the dichotomy of loose painting and precise algorithmic computation into this piece.

You can check out Tyler Hobbs’ portfolio here.

Min Ji Kim Kim – Project 05 – Wallpaper

sketch

/*
Min Ji Kim Kim
Section A
mkimkim@andrew.cmu.edu
Project-05
*/

function setup() {
    createCanvas(500,500);
    background(255);

    //navy diamonds
    fill('#002548');
    for (var y = 0; y < height; y += 70) {
        for (var x = 0; x < width; x += 70) {
            quad(x + 45, y + 15, x + 65, y + 45, x + 45, y + 75, x + 25, y + 45);
        }
    }

    //inside blue diamond with white outline   
    stroke(255);
    strokeWeight(3);
    fill('#5A7189');
    for (var y = 0; y < height; y += 70) {
        for (var x = 0; x < width; x += 70) {
            quad(x + 45, y + 30, x + 55, y + 45, x + 45, y + 60, x + 35, y + 45);
        }
    }

    //blue circles
    noStroke()
    fill('#5A7189')
    for (var y = 0; y < height; y += 70) {
        for (var x = 0; x < width; x += 70) {
            var db = 25; //big circle diameter
            circle(x + 10, y + 10, db);
        }
    }

    //small magenta dots
    noStroke()
    fill('#6C4971')
    for (var y = 0; y < height; y += 70) {
        for (var x = 0; x < width; x += 70) {
            var ds = 10; //small circle diameter
            circle(x + 10, y + 45, ds);
        }
    }
    noLoop();
}

I need a new shower curtain, so for this week, I chose to design something that I would be willing to buy.  The circle and diamonds reminded me of water droplets and I kept a general blue color palette to go with the water theme.

Min Ji Kim Kim- Looking Outwards – 05

Peter Nowacki’s “The Race Day”

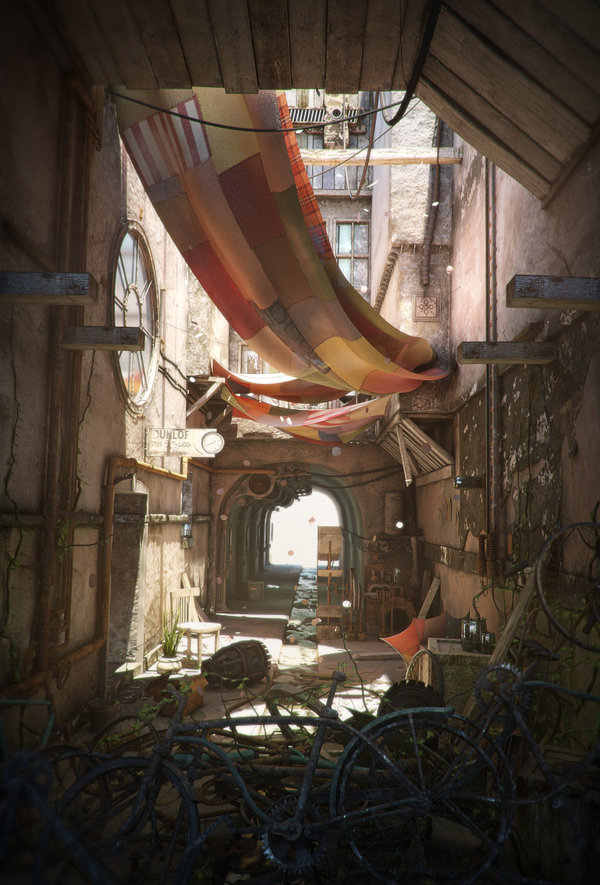
The Race Day is a 3D environment created by Peter Nowacki. Inspired by concept artist Gary Tonge’s Old Backstreet, Nowacki sought to recreate the environment with a more “steampunk” vibe. Utilizing tools like 3ds Max and Vray, Nowacki clay sculpted the basic components of the environment first and then spent a lot of time creating UV maps, which is essentially projecting a 2D image onto a 3D surface, to add texture and make the environment more realistic. 

Clay model of “The Race Day”

He then proceeded to create the gears, bicycles and dust details for the steampunk effect using Zbrush and Mudbox and added finishing touches on AfterEffects. 

Before and after adding the steampunk details.

Overall, I was in awe of Nowacki’s portfolio, but I was particularly attracted to this piece because it showed me the power of 3D rendering. I admire how Nowacki was able to recreate the 2D graphic design and bring it to another dimension, creating an even fuller and more complete environment by adding details and depth that can’t be captured in 2D. I think Nowacki’s twist of adding the steampunk vibe was a very good artistic choice. 

You can read more about Nowacki’s process here, and see his portfolio here.

Min Ji Kim Kim – Project 04 – String-Art

sketch

/*
Min Ji Kim Kim
Section A
mkimkim@andrew.cmu.edu
Project-04
*/

function setup() {
    createCanvas(400, 300);
    background(0);
}

function draw() {
    background(0);
    for (i = 0; i < width / 2; i += 30) {
        stroke(30, 255, 50); //bottom left green lines
        line(mouseX, i, i, height);

        stroke(255); //top right white lines
        line(i, mouseY, width, i);

        stroke(220, 0, 214); //top right pink lines
        line(i, mouseY, width, -i);

        stroke(255); //bottom left white lines
        line(mouseX, i, -i, height);
    }
   
    for (i = 0; i < 400; i += 10) {
        stroke(230, 240, 39); //yellow curve
        line(mouseX, i, i, height - mouseY);

        stroke(34,206,255); //blue curve
        line(-mouseX, i, i, mouseY);
    
        stroke(140, 0, 255); //purple curve
        line(mouseX, i, i, -mouseY);

        stroke(255, 131, 0); //orange curve
        line(width - mouseX, i, i, mouseY);
    }
}

This week’s project was both fun and challenging at the same time. I initially struggled trying to manipulate the movement of the curves but after a little while I got used to it. I got the color inspiration from the lasers at Illenium’s concert.

Min Ji Kim Kim – Looking Outwards – 04

Video Demonstration of the Weather Thingy created by Adrien Kaeser at ECAL.

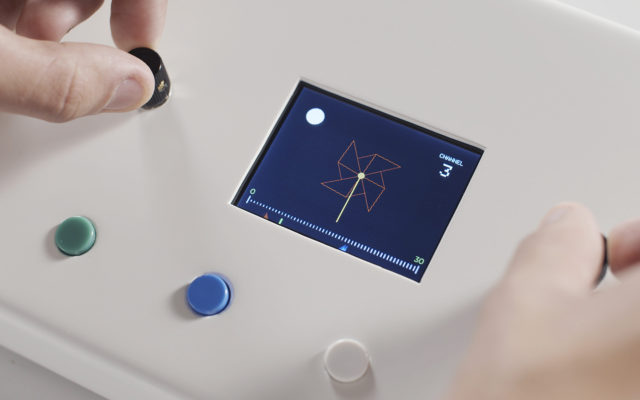
Weather Thingy, created by Adrien Kaeser at ECAL in September 2018, is a sounds controller that takes live climate data to modify the sounds of musical instruments. There are two parts to this device. The tripod microphone includes a wind vane, controlling pan, an anemometer, controlling the LFO, and a rain gauge, controlling the chorus. All of these parts are connected to the main controller with which the composer can manipulate these different elements. Through the Weather Thingy, Kaeser wanted to aurally share with the audience his live source of inspiration and how climate impacted his musical compositions. Software used to create the Weather Thingy include Arduino, C++ and MIDI protocol.

Controller interface of the anemometer input measuring wind speed.

I found this project to be astounding because, having composed music myself, sometimes I wish I could share my sources of inspiration and really let my audience visualize the atmosphere in which I wrote a song in. The Weather Thingy combines musical composition with natural elements in the environment and seeing how Kaeser wasn’t only able to get inspiration from nature but also incorporate nature directly into his compositions, is something I found really refreshing.

Weather Thingy – Real time climate sound controller

Min Ji Kim Kim – Project 03 – Dynamic-Drawing


sketch

I tried playing with a lot of different shapes, sizes and colors to create an abstract design. I had so much fun using mouseX and mouseY and manipulating them to get different effects.

/*
Min Ji Kim Kim
Section A
mkimkim@andrew.cmu.edu
Project-03
*/
var angle = 0; //angle used to rotate rectangle

function setup() {
    createCanvas(480, 640);
}

function draw() {
    noStroke();

    //change background color depending on mouseX position
    background(204, 255, 200);
    if (mouseX > width / 2) {
        background(170, 170, 230);
    }

    //navy rectangle
    fill(0, 76, 152);
    rectMode(CENTER);
    rect(width / 2, height / 2, mouseX, 200); //change rectangle width according to mouseX position

    //turquoise circle
    fill(0, 180, 159);
    circle(mouseY, mouseX, 80); //circle moves inversely to mouse

    //light blue circle
    fill(176, 211, 234);
    circle(300, 500, mouseY / 2); //expand or shrink circle by a factor of 1/2 depending on mouseY position 

    //light pink rectangle
    fill(245, 199, 231);
    rectMode(CENTER);
    rect(249, mouseY, 50, 100); //rectangle follows mouseY

    //salmon color rectangle translation and rotation
    push();
    translate(width / 3, 200);
    rotate(radians(angle));
    fill(250, 152, 167);
    rectMode(CENTER);
    rect(0, 0, 90, 90);
    pop();

    //mouseX controls salmon colored rectangle's rotation direction
    if (mouseX < width / 3) { //if mouseX is on the left 1/3 of the canvas, rotate anticlockwise
        angle = angle - 3;
    } else { //if mouseX is on the right 2/3 of the canvas, rotate clockwise
        angle += 3;
    }

    //small magenta circle 
    fill(110, 0, 70);
    ellipseMode(CENTER);
    ellipse(mouseX, mouseY, 35); //circle follows the mouse

    //orange rectangle
    fill(255, 178, 149);
    rect(mouseX, 380, 170, 25); //rectangle follows mouseX
}

Min Ji Kim Kim – Looking Outwards – 03


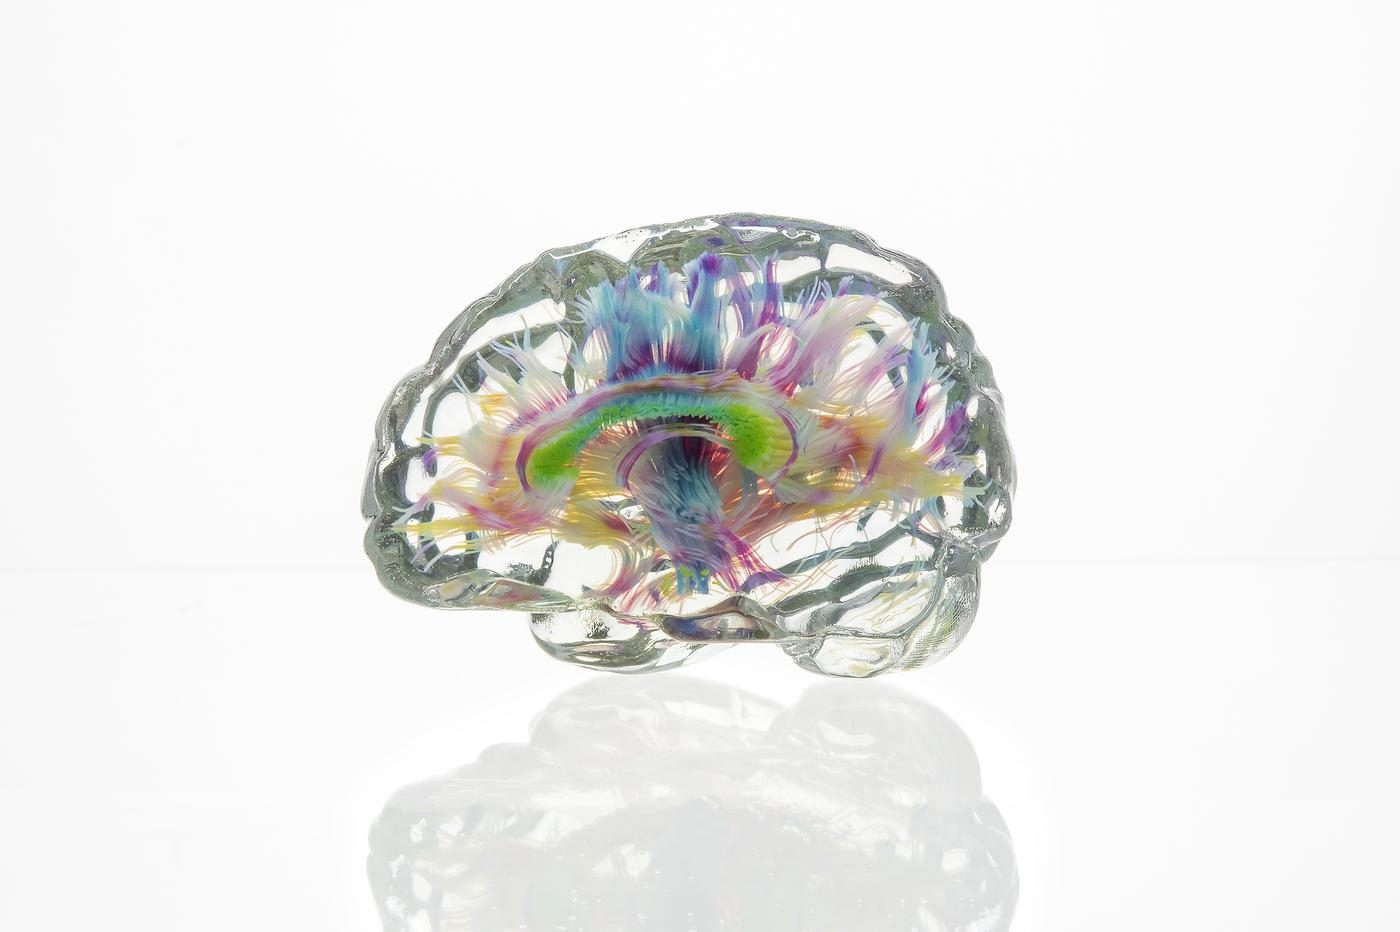
3D voxel-printed model of a human brain visualizing axon bundles. The Mediated Matter Group.

This model of the human brain was created through voxel-printing, which is a new 3D printing method created by MIT Media Lab’s Mediated Matter Group. Printing in voxels, which are the equivalent of 3D pixels, allows for much more precise renderings of the complex and fine details present in 3D computerized data. Further, it allows one to properly visualize any “floating” structures that aren’t directly connected to the body of the object. Before voxel-printing, 3D printing required a computerized model of the structure first, which often distorted images. With the availability of voxel-printing, 3D printed objects are now created in much higher definition.

Close-up of a voxel-printed 3D model of human lung tissue. The Mediated Matter Group.

I am fascinated by this recreation of lung tissue and how this new 3D printing method is able to capture the most fine and minute details, recreating computerized data into extremely accurate physical visualizations. Because voxel-printing can also print “floating” structures, computer models will no longer suffer a loss in quality when they’re physically brought to life. I believe that voxel-printing will improve the 3D printing industry and open doors for new ways of modeling and creating objects. 

https://www.media.mit.edu/projects/making-data-matter/overview/