Paul Greenway – Looking Outwards – 07

Wind Map by Martin Wattenberg

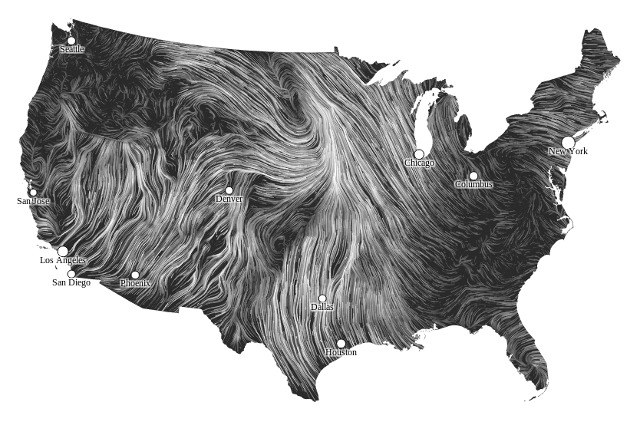
The project Wind Map, is a data visualization by Martin Wattenberg that became the first web art to be included in the MoMA’s permanent collection. The project shows winds flowing over the US from day to day with speed and direction of the lines representing wind behavior pulled from the National Digital Forecast database updating once per hour. While the representation is slightly abstracted to increase readability of the map, the overall patterns it captures are very informative and show the overall wind trends across the country in an informative and beautiful way. The project is created entirely in Javascript and HTML and shows the possibilities of computational techniques to visualize data. I found the project to be a fairly simple yet very well executed example of information visualization and thought the use of animation made understanding the previously less interesting raw wind data very intuitive and engaging.

Video of data based wind movement

Paul Greenway – Looking Outwards – 06

Random Lissajous Webs by Keith Peters

This art piece by generative artist Keith Peters is called Random Lissajous Webs. Peters makes use of Adobe Flash to code abstract generative art with this project specifically exploring the concept of random elements influencing the design. To create this set of images, Peters created code to generate a web of lissajous curves that used random velocity inputs which each resulted in a unique variation of the web.

I thought this project demonstrated the potential of random numbers when creating generative art with code. While initially the idea of randomness seems to go against often careful considerations and planning that typically goes into design, it can prove to be a great way of adding an element of unpredictability to the art. By using these randomly generated velocities in each curve, Peters was able to create a diverse set of images each with their own distinct feel while still clearly looking like they had been generated by the same base script.

Set of webs each with different curve velocities

Paul Greenway – 06 – Abstract Clock

pgreenwa_06

/*Paul Greenway
Section 1A
pgreenwa@andrew.cmu.edu
Project-06-Abstract Clock
*/


function setup() {
  createCanvas(480, 480);
}

function draw() {
  
  background(255,90,90);
  
  var S = second();
  var M = minute();
  var H = hour();
  var a = (0,0);
  var b = (480,480);
  
  var colorS = map(S,0,60,0,255);
  
  stroke(255);
  strokeWeight(0.3);
  line(0,0,480,480);
  strokeWeight(2);
  circle(234,234,10,10);
  circle(70,70,10,10);
  circle(480,480,10,10);
  
  stroke(255);
  strokeWeight(0.5);
  noFill();
   
  //hour rings
  for (i = 0; i < 25; i++) {
    
    circle(480, 480, i*24, i*24);
  }
  
  //minute rings
  for (i = 0; i < 13; i++) {
    
    circle(234, 234, i*24, i*24);
  }
      
  //second rings
  circle(70, 70, 200, 200);
  
  
  //fill circles color style
  noStroke();
  fill(0,colorS,90,90);
  
  //hour circle
  circle(480, 480, H*24, H*24);
  
  //second circle
  circle(70, 70, S*3.33, S*3.33);
  
  //minute circle
  circle(234, 234, M*4.8, M*4.8);
  
  
}

For this project, I wanted to create a clock that used various rings to indicate the time. As time passes, the inner circles begin to fill the 3 different sets of outer rings each representing a different measurement of time. I arranged the sets in a diagonal line so that the viewer is able to see each unit of contribute to the next.

Paul Greenway – Project 05 – Wallpaper

pgreenwa_wallpaper

/*Paul Greenway
Section 1A
pgreenwa@andrew.cmu.edu
Project-05-Wallpaper
*/


function setup() {
  createCanvas(580, 580);
}

//background
function draw() {
   background('white');


  //small background circles
  strokeWeight(1);
  for (var x = 0; x < 70; x++) {
    for (var y = 0; y < 70; y++) {
      fill('white');
      ellipse(10*x, 10*y, 10, 10);
      
    }
  }
  //black lines + circles
  strokeWeight(1);
  for (var x = 0; x < 11; x++) {
    for (var y = 0; y < 20; y++) {
      fill('black');   
      ellipse(50*x+40, 50*y + 40, 10, 10);
      rect(1*x, 50*y+14, 1000,2);
      rect(1*x, 50*y+39, 1000,2);
    }
  }
  //red outer rings
  strokeWeight(1);
  for (var y = 0; y < 10; y++) {
      for (var x = 0; x < 11; x++) {

        if (y % 2 !=0) {
          fill('red');
          ellipse(50*x+40, 50*y+40, 50, 50);
        }
      }
  }
    //inner gradient circles
    for (var y = 0; y < 10; y++) {
      for (var x = 0; x < 11; x++) {

        if (y % 2 !=0) {
          fill('white');
          ellipse(50*x+40, 50*y+40, 40, 40);
          fill(200,20*x,20*y);
          ellipse(50*x+40, 50*y+40, 25, 25);
        
          
        }
      }
  }
      strokeWeight(0);
      for (var y = 0; y < 11; y++) {
      for (var x = 0; x < 10; x++) {

        if (y % 2 ===0) {
          fill(30);
          ellipse(50*x+65, 50*y+40, 20, 25);
          
        }
      }
  }
}

For this project I wanted to created a symmetrical pattern that would have gradient colored circles based on their position within the grid. To segment these colored circles I added black lines with smaller white circles in the background to add more visual interest.

Paul Greenway – Looking Outwards – 05

gif of “Seething” music video by Andy Lomas

The music video for Max Cooper’s “Seething“, by digital artist Andy Lomas, makes use of 3D computer graphics to create a visual that emulates biological cell growth. The cell, which is made up by a group of spheres, shifts throughout the song driven by software that is based on cell growth patterns. To do this, the software changes various parameters within the system such as the amount of force between spheres and the amount of “nutrients” available for growth. According to the artist, the animation aims to explore the aesthetics of biology rather than represent it in a scientifically accurate way. Regardless, the use of computer software as a generator of 3D graphics results in dynamic 3 dimensional forms that compliments the mood of the music while also capturing the attention of the audience. I definitely felt that the graphics fit the theme of the track well and overall helped to create a unique visual experience that enhanced the music.

Paul Greenway – Project04 – String Art

pgreenwa_lineArt

function setup() {
  createCanvas(400, 300);
}

function draw() {
  
  background(50);
  
  //white triangle lines downwards
  for (var i = 0; i < 41; i++) {
    
    x1 = 200;
    y1 = 300;
    x2 = 0;
    y2 = 0;
    
    x2 += i*10;
    y2 -= i*0;
    
    stroke(100);
    strokeWeight(1);
    line(x1,y1,x2,y2);

  }
  
  //white triangle lines upwards
  for (var i = 0; i < 41; i++) {
    
    x1 = 200;
    y1 = 0;
    x2 = 0;
    y2 = 300;
    
    x2 += i*10;
    y2 -= i*0;
    
    stroke(100);
    strokeWeight(1);
    line(x1,y1,x2,y2);

  }
    
    //top left curved lines
    for (var i = 0; i < 40; i++) {
    
    x1 = 400;
    y1 = 0;
    x2 = 0;
    y2 = -50;
    
    x1 -= i*10;
    x2 -= i*10;
    x2 += i*10;
    y2 += i*10;
    
    stroke(150);
    strokeWeight(1);
    line(x1,y1,x2,y2);
      
    }
  
    //bottom right curved lines
    for (var i = 0; i < 45; i++) {
    
    x1 = 400;
    y1 = 300;
    x2 = 400;
    y2 = -50;
    
    x1 -= i*10;
    x2 -= i*10;
    x2 += i*10;
    y2 += i*10;
    
    stroke(150);
    strokeWeight(1);
    line(x1,y1,x2,y2);
      
    }
}

For this project I wanted to create string art with a symmetrical organization. To do this I used two intersecting triangular forms for the background with two opposite curving line groups on either corner.

Paul Greenway – Looking Outwards – 04

CarbonScape by Chris Cheung

CarbonScapes is an installation by Chris Cheung that spreads awareness of CO2 pollution by visualizing sound data collected at various sources of high carbon footprints. Cheung initially collected sound samples from a variety of pollutants such as jet engines, industrial factories, and cargo ships and compiled the data into a single soundscape. To visualize this sound data, long tubes that imitate industrial chimneys are spread across the room each with a black sphere that moves up and down inside the tube in conjunction with the sound data. The combined soundscape in addition to the dynamic black spheres representing CO2 create a clear visual representation based on the initial audio sampling data.

I found the project to be a very interesting and unique way of visualizing audio and thought the pairing of CO2 levels with sound generated worked very well. The forest like appearance of the installation and the constantly moving spheres also tied very well into the theme and intention of the project while accurately depicting the data.

CarbonScape sound data

Paul Greenway – Project – 03

pgreenwa_dynamic_drawing

/* Paul Greenway
Section A
pgreenwa@andrew.cmu.edu
Project-03
*/


function setup() {
  createCanvas(640, 480);
  
}

function draw() {
  
  background(170, 190, mouseY);
  noStroke();
  
  
  let maxX = constrain(mouseX, 0, width-mouseX);
  
  // left circles 
  

  fill(170, 190, mouseY);
  //rotate(radians(angle));
  square(maxX, 0, mouseX/2, mouseY/5);
  
  fill(mouseY, 190, 200);
  //rotate(radians(angle));
  square(maxX, 50, mouseX/2, mouseY/5);
  
  fill(170, 190, mouseY);
  //rotate(radians(angle));
  square(maxX, 100, mouseX/2, mouseY/5);
  
  fill(mouseY, 190, 200);
  //rotate(radians(angle));
  square(maxX, 150, mouseX/2, mouseY/5);
  
  fill(170, 190, mouseY);
  //rotate(radians(angle));
  square(maxX, 200, mouseX/2, mouseY/5);
  
  fill(mouseY, 190, 200);
  //rotate(radians(angle));
  square(maxX, 250, mouseX/2, mouseY/5);
  
  fill(170, 190, mouseY);
  //rotate(radians(angle));
  square(maxX, 300, mouseX/2, mouseY/5);
  
  fill(mouseY, 190, 200);
  //rotate(radians(angle));
  square(maxX, 350, mouseX/2, mouseY/5);
  
  fill(170, 190, mouseY);
  //rotate(radians(angle));
  square(maxX, 400, mouseX/2, mouseY/5);
  
  fill(mouseY, 190, 200);
  //rotate(radians(angle));
  square(maxX, 450, mouseX/2, mouseY/5);
  
}

For this project I wanted to create a series of objects with different elements that could all be controlled by the mouse and would change simultaneously. I decided to use circles that would shift into rectangular lines as the mouse is moved.

Paul Greenway – Looking Outwards 03

The Adaptation chair designed by Joris Laarman Lab, experiments with the possibilities of generative design and digital fabrication techniques in the field of furniture design. The form of the chair seems to rise organically with branches that continuously split as the thicker legs become the more dense seat and back. When designing the chair, the team made use of generative algorithms to mimic cell growth in nature. Then through parametric design, the final form was generated based on the behavior of the initial algorithm. This cellular structure creates an interesting visual style for the furniture while maintaining structural integrity throughout the form.

In terms of fabrication, the chair is 3D printed from nylon that is plated with copper for structural and aesthetic purposes. I found the final product to be very successful and a great showcase of the power of combining generative design with digital fabrication tools.

Paul Greenway – Project – 02

sketch

// Simple beginning template for variable face.
var eyeSize = 20;
var eyeLocation = -70;
var noseSize = 40;
var mouth = 60;
var shirtColor = 10;
var hairColor = 10;
 
function setup() {
    createCanvas(480, 640);
}
 
function draw() {
   
    background(255);
  
     //hair
     fill(hairColor);
     arc(240, 300, 350, 350, PI, TWO_PI);
  
     //hair
     fill(hairColor);
     arc(230, 240, 340, 290, PI, 180 + HALF_PI, OPEN);
  
  
  translate(250, 300);
  fill(200); 
  
  //body
  noStroke();
  fill(shirtColor,100,30);
  rect(-100,150,200,300);
  arc(0, 150, 200, 100, PI, TWO_PI,PIE);


  //face
  beginShape();
  fill(200);
  curveVertex(-113,-120);
  curveVertex(-3,-150);
  curveVertex(83,-98);
  curveVertex(80,-6);
  curveVertex(95,101);
  curveVertex(3,130);
  curveVertex(-106,88);
  curveVertex(-110,-6);
  curveVertex(-113,-120);
  curveVertex(-3,-150);
  curveVertex(83,-98); 

endShape();
  
  //eyes
  fill(255);
  circle(50,eyeLocation,eyeSize);
  circle(eyeLocation,eyeLocation,eyeSize);
  
  
  //nose
  fill(180);
  ellipse(0,0,30,noseSize);
  
  //mouth
  fill(80);
  arc(-5, 60, 120, mouth, 0, PI, PIE);
  
  
}
 
function mousePressed() {
    // when the user clicks, these variables are reassigned
    // to random values within specified ranges. For example,
    // 'faceWidth' gets a random value between 75 and 150.

    eyeSize = random(10, 30);
    eyeLocation = random(-70, -40);
    noseSize = random(30, 70);
    mouth = random(30, 120);
    shirtColor = random(10,255);
    hairColor = random(10,100);
}

Variable Face

For this project I wanted to create a simple, cartoonish face that could look different as the dimensions of the facial features shift. The elements of the face that I used variables on are the mouth, nose, eyes, as well as shirt and hair colors.