![[OLD FALL 2019] 15-104 • Introduction to Computing for Creative Practice](../../../../wp-content/uploads/2020/08/stop-banner.png)
//sarah kang
//section c
//sarahk1@andrew.cmu.edu
//project-03-dynamic-drawing
var angle = 0; //angle for rectangle rotation
var ogX = 0;
var ogY = 0;
function setup() {
createCanvas(640, 480);
}
function draw() {
background(0);
strokeWeight(1.5);
stroke(255, 255, 255);
//top row small rectangles
fill(mouseY, 102, mouseX);
push();
translate(70, 70);
rotate(radians(angle * -1));
rect(ogX, ogY, mouseX / 8, mouseY / 8);
pop();
push();
translate(170, 70);
rotate(radians(angle * -1));
rect(ogX, ogY, mouseX / 8, mouseY / 8);
pop();
push();
translate(270, 70);
rotate(radians(angle * -1));
rect(ogX, ogY, mouseX / 8, mouseY / 8);
pop();
push();
translate(370, 70);
rotate(radians(angle * -1));
rect(ogX, ogY, mouseX / 8, mouseY / 8);
pop();
push();
translate(470, 70);
rotate(radians(angle * -1));
rect(ogX, ogY, mouseX / 8, mouseY / 8);
pop();
push();
translate(570, 70);
rotate(radians(angle * -1));
rect(ogX, ogY, mouseX / 8, mouseY / 8);
pop();
// middle medium rectangles, rotating in opposite direction
fill(mouseX, 166, mouseY);
push();
translate(600, 230);
rotate(radians(angle));
rect(ogX, ogY, mouseX / 4, mouseY / 4);
pop();
push();
translate(450, 230);
rotate(radians(angle));
rect(ogX, ogY, mouseX / 4, mouseY / 4);
pop();
push();
translate(300, 230);
rotate(radians(angle));
rect(ogX, ogY, mouseX / 4, mouseY / 4);
pop();
push();
translate(150, 230);
rotate(radians(angle));
rect(ogX, ogY, mouseX / 4, mouseY / 4);
pop();
push();
translate(0, 230);
rotate(radians(angle));
rect(ogX, ogY, mouseX / 4, mouseY / 4);
pop();
//bottom big rectangles
fill(mouseX, 255, mouseY);
push();
translate(100, 420);
rotate(radians(angle * -1));
rect(ogX, ogY, mouseX / 2, mouseY / 2);
pop();
push();
translate(320, 420);
rotate(radians(angle * -1));
rect(ogX, ogY, mouseX / 2, mouseY / 2);
pop();
push();
translate(540, 420);
rotate(radians(angle * -1));
rect(ogX, ogY, mouseX / 2, mouseY / 2);
pop();
angle = angle + 5; // rotation speed and direction
//changing rotation speed, controlled by mouseX
if(mouseX >= 320){
angle = angle + 10;
}
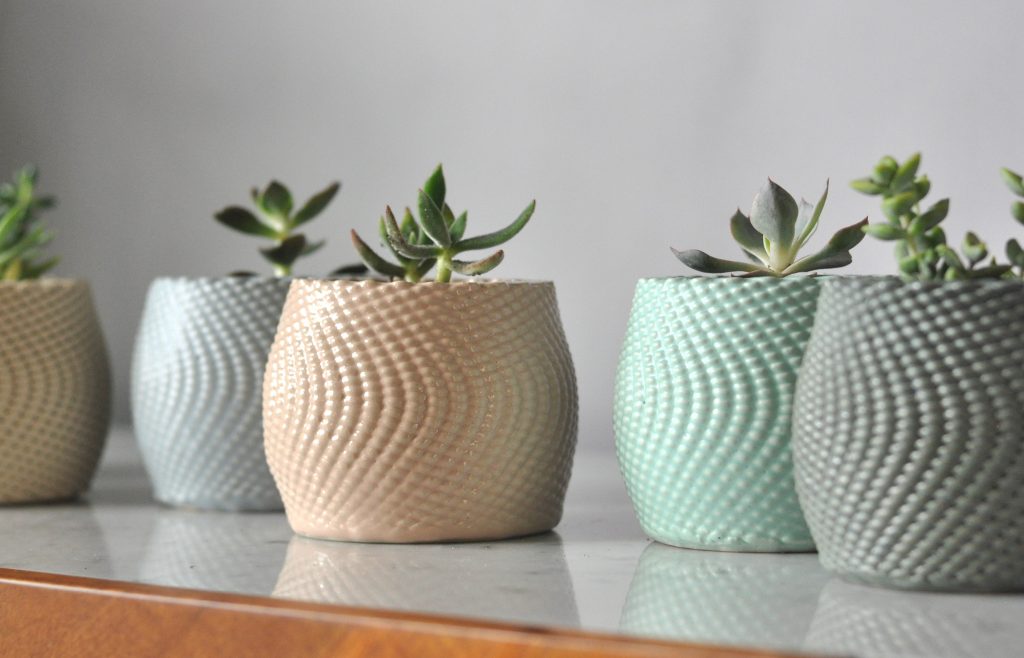
}For this assignment, I was inspired by the parametric graphic references provided in the guidelines and wanted to emulate it through my drawing.