/*Katrina Hu
15104-C
kfh@andrew.emu.edu
Project-07*/

var nPoints = 100;

function setup() {
    createCanvas(480, 480);
    background(0);
}

function draw() {
    push();
    translate(width/2, height/2);
    drawHypotrochoid();
    drawAstroid();
    pop();

}

function drawHypotrochoid() {
    var x;
    var y;
    //mouse used to change color
    var r = constrain(mouseX, 0, 255);
    var g = constrain(mouseY, 0, 255);
    var b = constrain(mouseY, 200, 255);
    //stroke appearance
    stroke(r, g, b);
    strokeWeight(1);
    noFill();
    //hypotrochoid equation
    var a = map(mouseX, 0, 600, 0, 300);
    var b = 10
    var h = map(mouseY, 0, 600, 2, 105);
    beginShape();
    for (var i = 0; i < nPoints; i++ ) {
        var angle1 = map(i, 0, nPoints, 0, TWO_PI);
        //equation of hypotrochoid
        x = (a - b) * cos(angle1) + h * cos((a - b) * (angle1 / b));
        y = (a - b) * sin(angle1) - h * sin((a - b) * (angle1 / b));
        vertex(x, y);
    }

  endShape();
}

function drawAstroid() {
    //mouse used to change color
    var r = constrain(mouseX, 200, 255);
    var g = constrain(255, mouseY/4, 50);
    var b = constrain(mouseY, 200, 255);
    //stroke appearance
    stroke(r, g, b);
    strokeWeight(2);
    noFill();
    //asteroid equation
    var a = int(map(mouseX, 0, width, 4, 10));
    var b = int(map(mouseX, 0, width, 0, 100));
    beginShape();
    for (var i = 0; i < nPoints; i++){
        angle1 = map(i, 0, nPoints, 0, TWO_PI);
        //equation of Astroid
        x = (b / a) * ((a - 1) * cos(angle1) + cos((a - 1) * angle1));
        y = (b / a) * ((a - 1) * sin(angle1) - sin((a - 1) * angle1));
        vertex(x,y);
    }
    endShape();

}
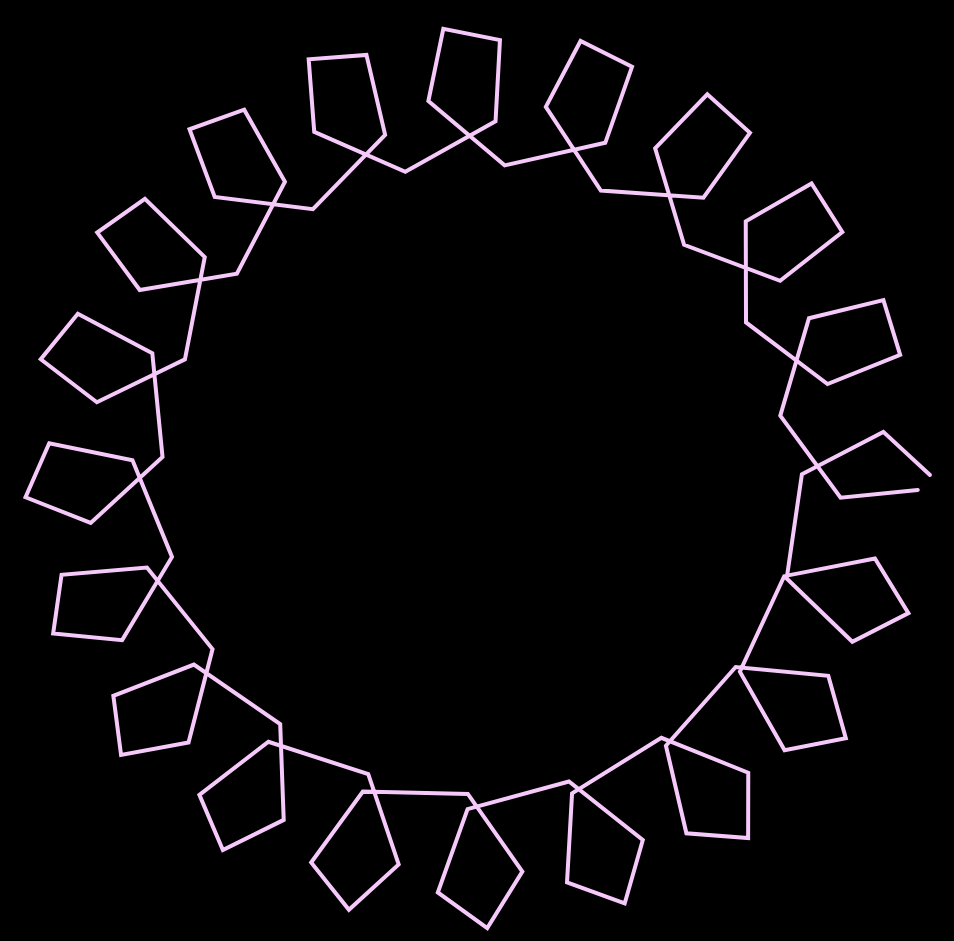
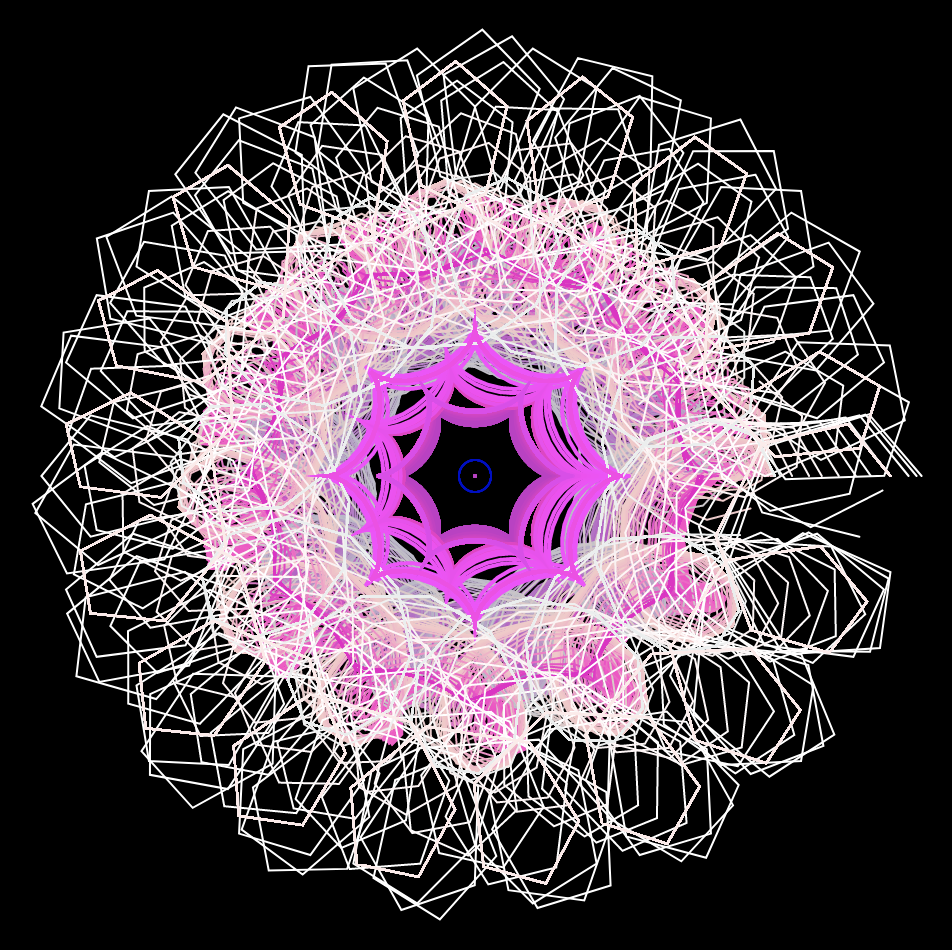
In my project I used a Hypotrochoid and an Asteroid. I decided to use my mouse to play around with the RGB values, which change depending on mouseX and mouseY. The project has a large Hypotrochoid on the outside with the Asteroid on the inside.
I decided to let it draw over itself, as it adds more curves when you move the mouse. I thought it added a cool layering effect where you could see all the colors on top of one another.
Overall, the project was fun to do as I learned a lot about experimenting with the different curves and parametric equations.


![[OLD FALL 2019] 15-104 • Introduction to Computing for Creative Practice](wp-content/uploads/2020/08/stop-banner.png)