/*
Claire Lee
15-104 Section B
seoyounl@andrew.cmu.edu
Project-07
*/

var nPoints = 100;
var angle = 0;
//initial global variables

var bgRed = 135;
// background color variable

function setup() {
    createCanvas(480, 480);
    background(bgRed, 195, 255);
}

function draw() {
    bgRed = 150 + (mouseX * (120 / width));
    background(bgRed, 195, 255);

    push();
    translate((width / 2), (height / 2));
    rotate(radians(mouseY));
    hypotrochoidCurve();
    pop();
    // place curve in center, govern rotation by mouseY

    push();
    translate((width / 2), (height / 2));
    rotate(radians(mouseX));
    epitrochoidCurve();
    pop();
    // place curve in center, govern rotation by mouseX

    push();
    translate((width / 2), (height / 2));
    rotate(radians(mouseX * 5));
    deltoidRadialCurve();
    pop();
    // place curve in center, govern rotation by mouseX
    // comparatively faster rotation
}

function hypotrochoidCurve() {
    var a1 = map(mouseX, 0, 480, 80, 200);
    //size changes with repsect to mouseX
    var b1 = 30;
    var h1 = (mouseX / 10);
    var angle1 = 0;
    // variables for shape 1 (hyopotrochoid)

    strokeWeight(1);
    stroke(255);
    noFill();
    beginShape();
    for (var i = 0; i < nPoints; i++) {
        var angle1 = map(i, 0, nPoints, 0, TWO_PI);
        x1 = (a1 - b1) * cos(angle1) + h1 * (cos(((a1 - b1)/ b1) * angle1));
        y1 = (a1 - b1) * sin(angle1) + h1 * (sin(((a1 - b1)/ b1) * angle1));
        vertex(x1, y1);
    }
    endShape(CLOSE);
    //hypotrochoid curve
}

function epitrochoidCurve() {
    var a2 = map(mouseX, 0, 480, 50, 100);
    //size changes with respect to mouseX
    var b2 = 50;
    var h2 = (mouseY / 20);
    var angle2 = 0;
    // variables for shape 2 (epitrochoid)

    strokeWeight(1);
    stroke(255);
    fill(255, 255, 255, 50);
    beginShape();
    for (var i = 0; i < nPoints; i++) {
        var angle2 = map(i, 0, nPoints, 0, TWO_PI);
        x2 = (a2 + b2) * cos(angle2) - h2 * cos((a2 + b2) * angle2);
        y2 = (a2 + b2) * sin(angle2) - h2 * sin((a2 + b2) * angle2);
        vertex(x2, y2);
    }
    endShape(CLOSE);
    // epitrochoid curve
}

function deltoidRadialCurve() {
    var a3 = map(mouseY, 0, 480, 0, 100);
    //size changes with respect to mouseY
    var angle3 = 0;
    // variables for shape 3 (deltoid radial)

    strokeWeight(1);
    stroke(255);
    fill(255, 255, 255, 50);
    beginShape();
    for (var i = 0; i < nPoints; i++) {
        var angle3 = map(i, 0, nPoints, 0, TWO_PI);
        x3 = (1/3) * a3 * (2 * cos(angle3) + cos(2 * angle3));
        y3 = (1/3) * a3 * (2 * sin(angle3) - sin(2 * angle3));
        vertex(x3, y3);
    }
    endShape(CLOSE);
    // deltoid radial curve
}
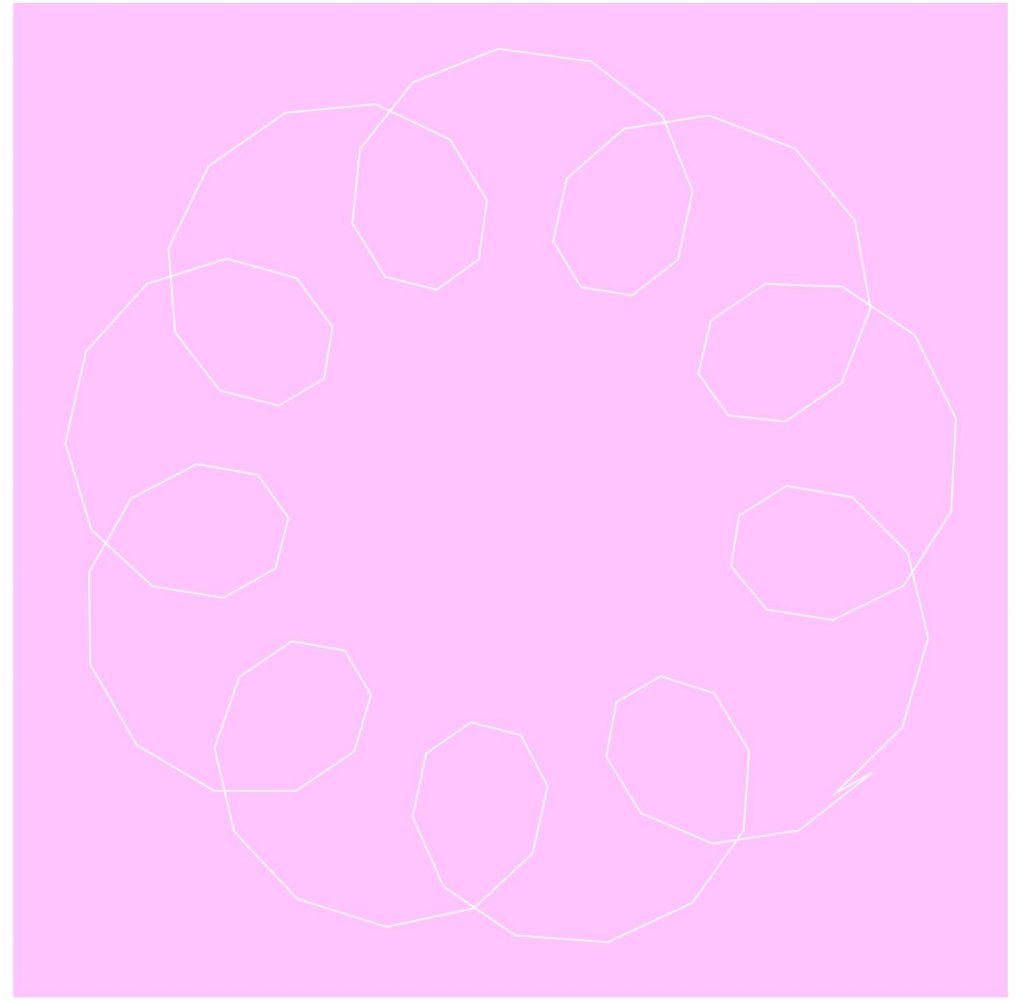
This project was really interesting because I got to see how I could adjust different variables within parametric equations to change with respect to mouse position. I wanted to create something relatively simple that resembles a “blooming” flower as the mouse moves position from (0,0) to (480,480). Admittedly, this took a bit of trial and error, and I ran into a lot of formatting issues in the beginning, but I’m pretty satisfied with how it turned out.


![[OLD FALL 2019] 15-104 • Introduction to Computing for Creative Practice](wp-content/uploads/2020/08/stop-banner.png)