//Xiaoyu Kang
//xkang@andrew.cmu.edu
//Section B
//Project-07

var angles = 0;
function setup() {
    createCanvas(480, 480);
}

function draw() {
    background(0);
    stroke(mouseX, 220, mouseY);
    translate(width / 2, height / 2);
    // all the curves rotate at the same speed
    rotate(radians(angles));
    angles += (mouseY/30);
    drawCruciform();
    drawAstroid();
    drawEpitrochoid();
}

function drawCruciform() {
    // http://mathworld.wolfram.com/Cruciform.html
    push();
    noFill();
    strokeWeight(1);


    //creates the cruciform
    beginShape();
    var a = map(mouseX, 0, width, 0, 300);
    var b = map(mouseY, 0, height, 0, 300);

    for (var i = 0; i < 800; i++) {
        var t = map(i, 0, 150, 0, TWO_PI);
        var x = a * 1 / (cos(t));
        var y = b * 1 / (sin(t));
        vertex(x, y);
    }
    endShape();
    pop();
}

function drawAstroid() {
    // http://mathworld.wolfram.com/Astroid.html
    push();
    noFill();
    strokeWeight(1);

    //draw astroid
    beginShape();
    var a = map(mouseX, 0, width, -300, 300);

    for (var i = 0; i < 500; i++) {
        var t = map(i, 0, 150, 0, TWO_PI);
        var x = 3 * a * cos(t) + a * cos(3 * t);
        var y = 3 * a * sin(t) - a * sin(3 * t);
        vertex(x, y);
    }
    endShape();
    pop();
}

function drawEpitrochoid() {
    // http://mathworld.wolfram.com/Epitrochoid.html
    push();
    noFill();
    strokeWeight(1);

    //draw epitrochoid
    beginShape();
    var a = map(mouseX, 0, width, -100, 100);
    var b = map(mouseX, 0, width, -100, 200);
    var h = map(mouseY, 0, height, -300, 200);


    for (var i = 0; i < 600; i++) {
        var t = map(i, 0, 150, 0, TWO_PI);
        var x = (a + b) * cos(t) - h * cos(((a+b)/b) * t);
        var y = (a + b) * sin(t) - h * sin(((a+b)/b) * t);
        vertex(x, y);
    }
    endShape();
    pop();
}
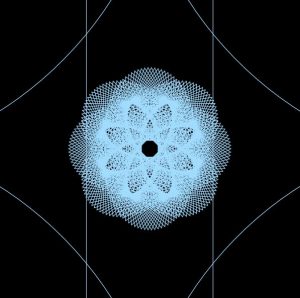
For this project, I really want to create curves that are diverse in shape as the mouse moves around. I picked three curves that are all very different in shape an as the mouse moves they turn into patterns with different level of complexity. Also to add some more visual elements, I changed the color setting so that as the mouse moves the color changes as well.


![[OLD FALL 2019] 15-104 • Introduction to Computing for Creative Practice](wp-content/uploads/2020/08/stop-banner.png)