Project 07 – Composition with Curves

sketch
// Stefanie Suk
// 15-104 Section D

var nPoints = 100; //number of points for curves
var angle = 10; //angle of rotation

function setup() {
    createCanvas(480,480);
    frameRate(15); //set frame rate to 15
}

function draw() {
    background(33, 63, 99); //background of canvas to dark blue

    //placing Hypocycloid in center
    push();
    translate(width/2, height/2);
    Hypocycloid();
    pop();

    //placing Deltoid in center and rotate by angle
    push();
    translate(width/2, height/2);
    rotate(radians(angle));
    angle += mouseX;
    Deltoid();
    pop();

    //placing Epitrochoid in center
    push();
    translate(width/2, height/2);
    Epitrochoid();
    pop();
}

function Hypocycloid(){
    // variables for Hypocycloid
    var a1 = map(mouseY, 0, 300, 150, 180); //size changes with respect to mouseY
    var b1 = 15;
    var c1 = mouseX / 25;

    //color, stroke of Hypocycloid
    stroke(167, 219, 239);
    strokeWeight(6);
    noFill();

    //create curve, map to full circle radians
    //use math function to find x and y values
    beginShape();
    for (var i = 0; i < nPoints; i++) {
        var angle1 = map(i, 0, nPoints, 0, TWO_PI);     
        x1 = (a1 - b1) * cos(angle1) + c1 * cos((a1 - b1) * angle1);
        y1 = (a1 - b1) * sin (angle1) - c1 * sin((a1 - b1) * angle1);
        vertex(x1, y1);
    }
    endShape(CLOSE); 
}

function Deltoid(){
    colorR = map(mouseX, 0, 50, 100, 255);
    colorG = map(mouseX, 0, 50, 100, 255); //set color in specific range
    colorB = map(mouseY, 0, 50, 100, 255); //changes color with respect to mouseX,Y
    
    // variable for Deltoid, change size
    a2 = map(mouseY, 0, height, 10, 40); //size changes with respect to mouseY
    
    //color, stroke, fill of Deltoid
    stroke(255);
    strokeWeight(6);
    fill(colorR, colorG, colorB);

    //create curve, map to full circle radians
    //use math function to find x and y values
    beginShape();
    for (var i = 0; i < nPoints; i++) {
        var angle2 = map(i, 0, nPoints, 0, TWO_PI);
        x2 = ((2 *(cos(angle2))) + (cos(2*angle2)))* a2 ;
        y2 = ((2 *(sin(angle2))) - (sin(2*angle2)))* a2 ;
        vertex(x2, y2);
    }
    endShape(CLOSE);
}

function Epitrochoid() {

    colorR = map(mouseX, 0, 50, 100, 255);
    colorG = map(mouseX, 0, 50, 100, 255); //set color in specific range
    colorB = map(mouseY, 0, 50, 100, 255); //changes color with respect to mouseX,Y

    // variables for epitrochoid
    var a3 = map(mouseY, 0, 400, 40, 110); //size changes with respect to mouseY
    var b3 = 50;
    var c3 = (mouseX / 15);

    //color, stroke of epitrochoid
    stroke(colorR, colorG, colorB);
    strokeWeight(1.5);
    noFill();

    //create curve, map to full circle radians
    //use math function to find x and y values
    beginShape();
    for (var i = 0; i < nPoints; i++) {
        var angle3 = map(i, 0, nPoints, 0, TWO_PI);
        x3 = (a3 + b3) * cos(angle3) + c3 * cos((a3 + b3) * angle3);
        y3 = (a3 + b3) * sin(angle3) + c3 * sin((a3 + b3) * angle3);
        vertex(x3, y3);
    }
    endShape(CLOSE);
}

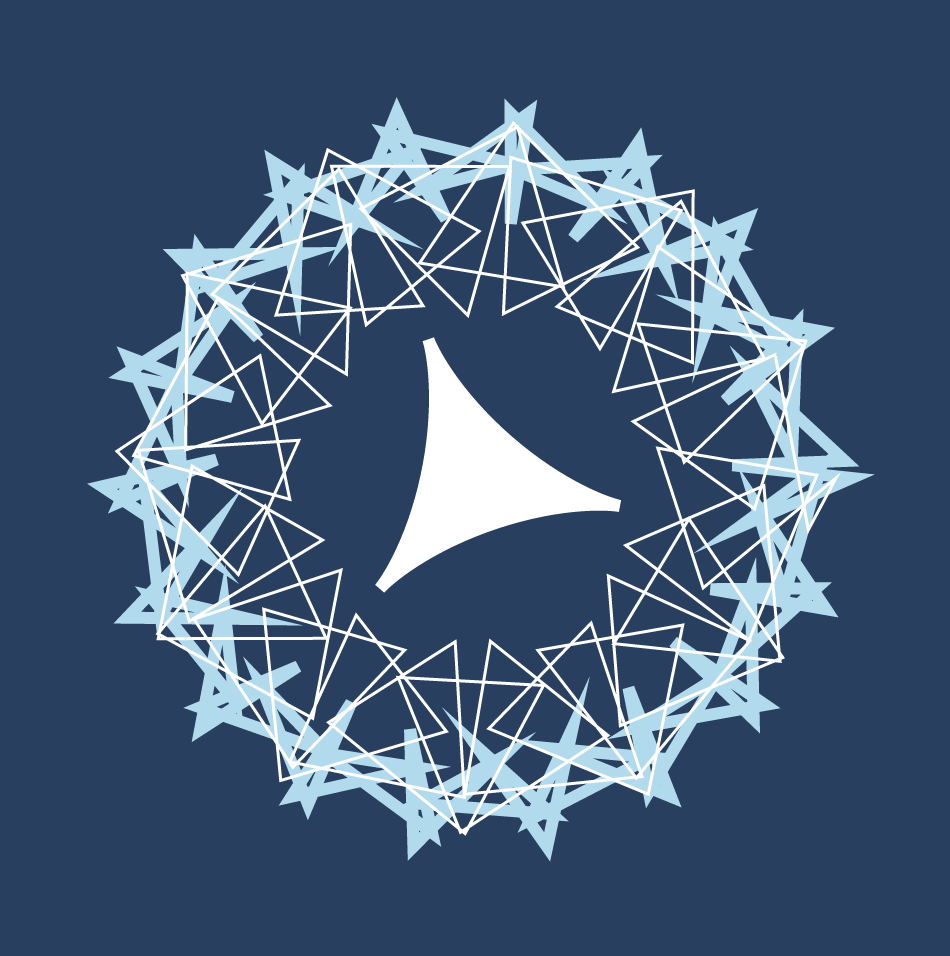
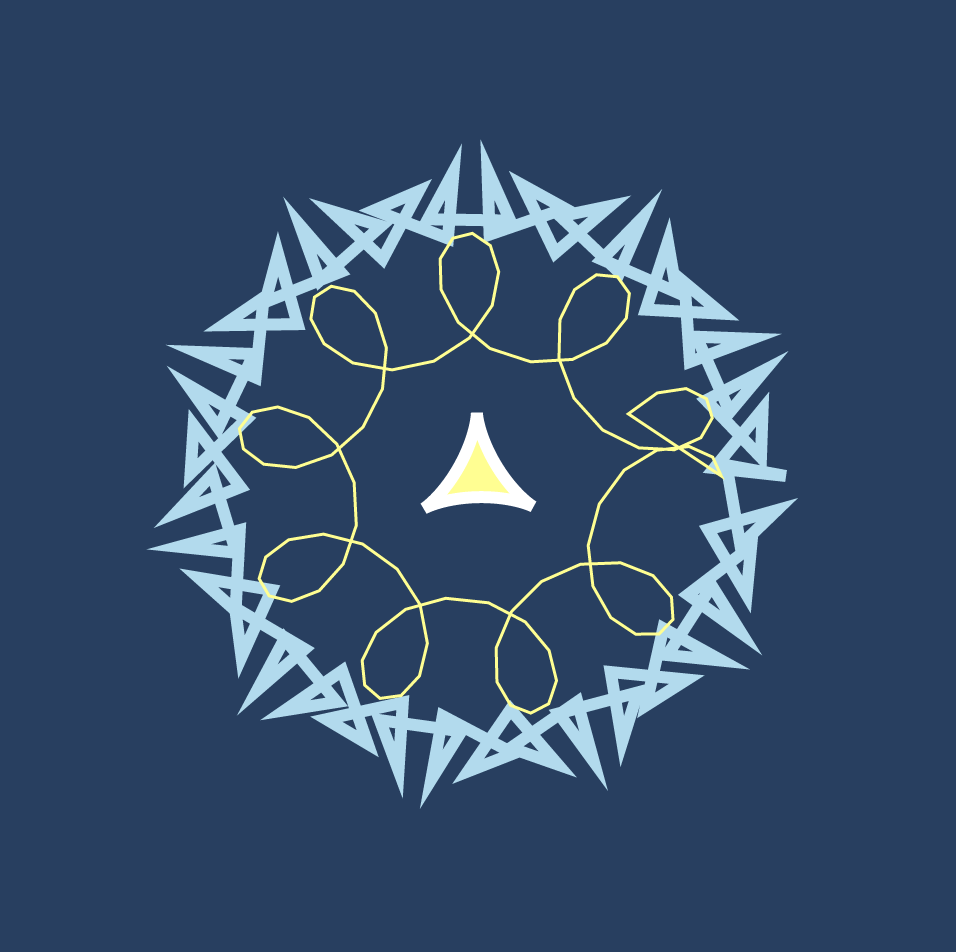
I utilized hypocycloid, deltoid, and epitrochoid using the reference from Mathworld to create this project. I chose these curves because I loved how they were structured. I thought that when these three curves are put together would create one unique interactive shape for my project. The exploration of this project was interesting, and I also played around with random colors and sizes with mouseX and mouseY. The unique part about these curves in my project is that the curves in my work create different smoothness depending on the position of the mouse (round, shape, spiky, squiggly). The different shapes created in the project look like forms of snowflakes, which is why I made the main color blue.


Looking Outwards 07 – Information Visualization

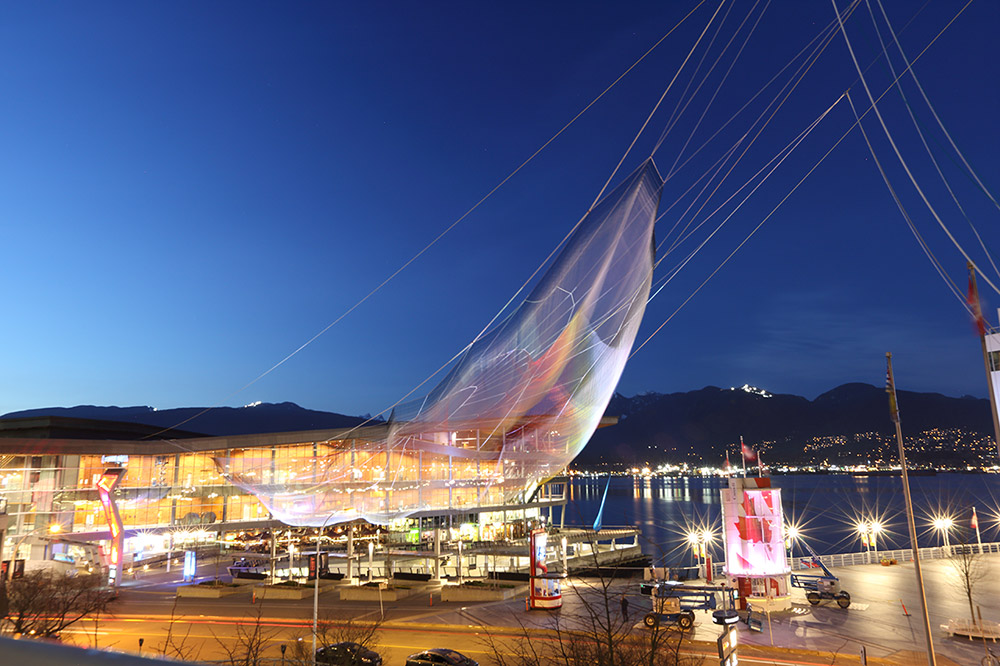
Image of Unnumbered Sparks

Unnumbered Sparks is a project by Aaron Koblin and Janet Echelman. This interactive monumental sculpture is a crowd-controlled visual artwork that is installed in air on a large canvas. The designs and colors of the sculpture are based on the visitors present in the area through their mobile devices. People are able to use their phones to paint different colors of light across the artwork. Every single movement of the mobile devices project vivid beams of light in the artwork. What I admire about this sculpture is that it is interactive with the audiences in the area. Thus, I find the large scale and complexity of the installation is really inspiring as a design major. The computational software that is used in this artwork explores different scale, shape, density, and interaction with visitors. The material used in this installation is also very interesting, because the structure of the sculpture is made with soft fibers that are attached to existing buildings in the area. The exploration of unique materials and interaction really shows how much the artists focused on the connection between installation and people. Computation technology is successfully used in this interactive sculpture and it also shows the creator’s sensibilities to incorporate art and people into the project.

Website:  http://www.aaronkoblin.com/project/unnumbered-sparks/

Video of Unnumbered Sparks

LO 7 – Information Visualization

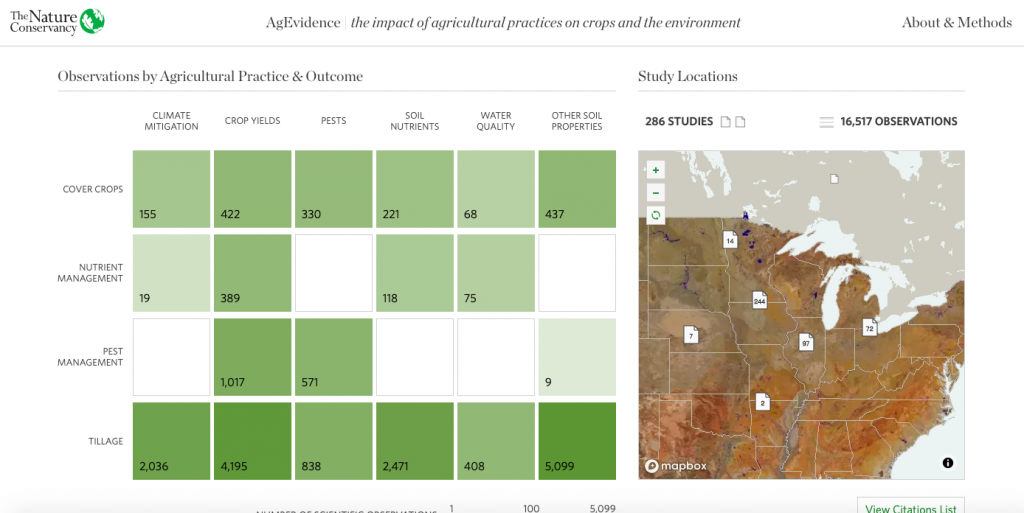
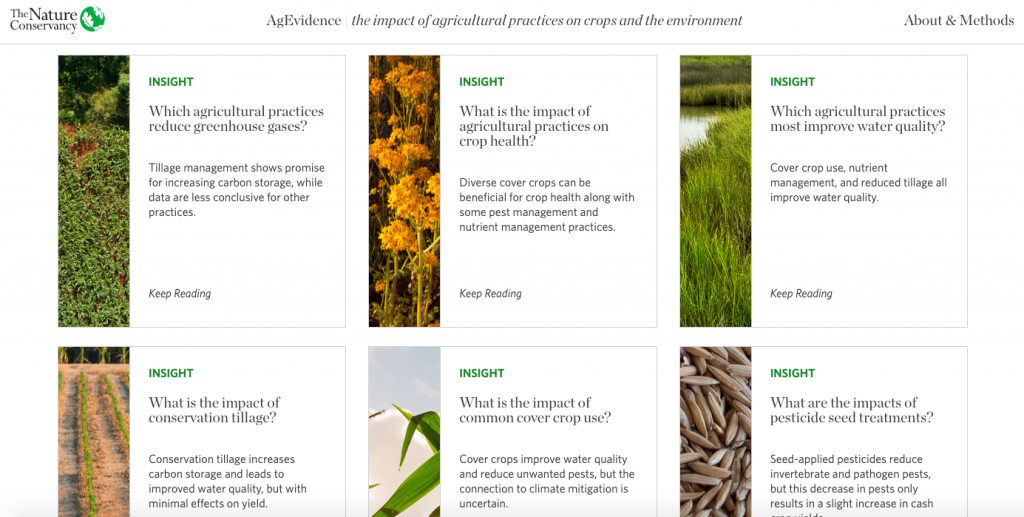
For this week’s LO, I decided to take a look at Periscopic‘s AgEvidence project (Dr. Lesley Atwood, Dr. Stephen Wood, Periscopic), which includes 16,000+ data points visualizing the impact of conservation agriculture in the US.

This project is quite inspirational not only because of the massive scale and data collected/visualized but also the impact of the way that the designers have presented data. The Periscopic data visualization firm collaborated with The Nature Conservancy on this project to help researchers from the Science for Nature and People Partnership team to synthesize and illustrate findings from over 40 years of agriculture research. AgEvidence displays the effects of conservation practices such as reduced tillage, early-season pest management, and cover crops on the environment and food production, as well as distinguishes research-rich and -sparse areas. I believe that the researchers first extracted and processed the data, then using percentage changes and nested levels to computationally visualize it.

I appreciate that the creators included key insights to highlight patterns in the data and make it more accessible to users. Moreover, they have allowed for easy data access and transparency through options to download filtered/holistic data sets so that users can discover even more nuances.

AgEvidence interactive tool: observations and map of study locations
detailed insights that make data more accessible

Project 7: Curves

sketch
/*
Bon Bhakdibhumi
bbhakdib
Section D
*/

var nPoints = 100;
function setup() {
    createCanvas(410, 400);
}

function draw() {
    background(171, 230, 255);
    for(var i=30; i<=400;i+=100){
        for(var j=30; j<=400;j+=60){
            push();
            translate(i,j);
            daisy();
            pop();
        }
    }
    for(var k=80; k<=400;k+=100){
        for(var l=0; l<=600;l+=60){
            push();
            translate(k,l);
            daisy();
            pop();
        }
    }
}

function daisy() {
//drawing a daisy
    var x;
    var y;
// making a ranunculoid or a 10-cusp epicycloid  
    var petal = 10;
    if (mouseY >= height/3 & mouseY < height*(2/3)){
        petal = 5;
    }
    var a = 20;
    var b = a / petal;
    var h = b;
// making a fried egg
    if (mouseY < height/3) {
        h = 0;
    }
    var ph = mouseX / 50.0;
    var ph = mouseX / 50.0;
    fill(255);
    stroke(100);
    beginShape();
    for (var i = 0; i < nPoints; i++) {
        var t = map(i, 0, nPoints, 0, TWO_PI);
        x = (a + b) * cos(t) - h * cos(ph + t * (a + b) /b);
        y = (a + b) * sin(t) - h * sin(ph + t * (a + b) /b);
        vertex(x, y);
    }
    endShape(CLOSE);
// middle part
    fill(255, 253, 158);
    circle(0, 0, a);
}

For this project, I decided to create an interactive pattern using ranunculoid and 10-cusps epicycloid curves. The pattern changes from a pattern of fried eggs, when mouseY is in the first third of the canvas, to a pattern of 5-petals daisies, when mouseY is in the second third of the canvas, and to a pattern of 10-petals daisies, when mouseY is in the last third of the canvas. The pattern also spins when mouseX changes.

LO 7: Information Visualization

All Street Limited by Ben Fry

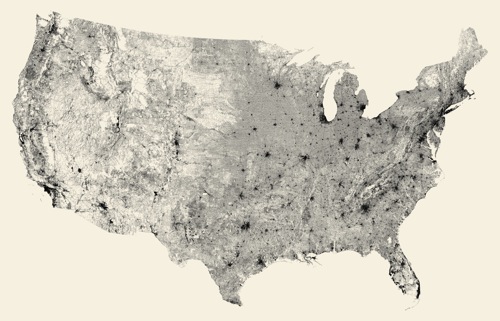
An Information Visualization project that I really admire is All Streets Limited by Ben Fry. In his work, Fry created an intricate map of all the streets in the 48 states of the United States. To achieve this incredible work, Fry translated data from the U.S Census Bureau into a map by first,  using Perl.Next to parse and filter data. Writing in javascript, Fry applied the Albers equal-area conic projection to transform latitude and longitude coordinates. Later, he converted his work into print. I really enjoy looking at his work as it is a great illustration of how the interconnectedness of little elements–small streets and roads–can make up a system–the map of the United States–showing the complexity that is not usually tangible or is overlooked. His work reveals the universal truth of how things operate and the power of systems–from an atom to the universe.

Link : https://3rdfloor.fathom.info/products/all-streets

Title: All Streets Limited

Creator: Ben Fry

Year: 2007

Project-07-Curves

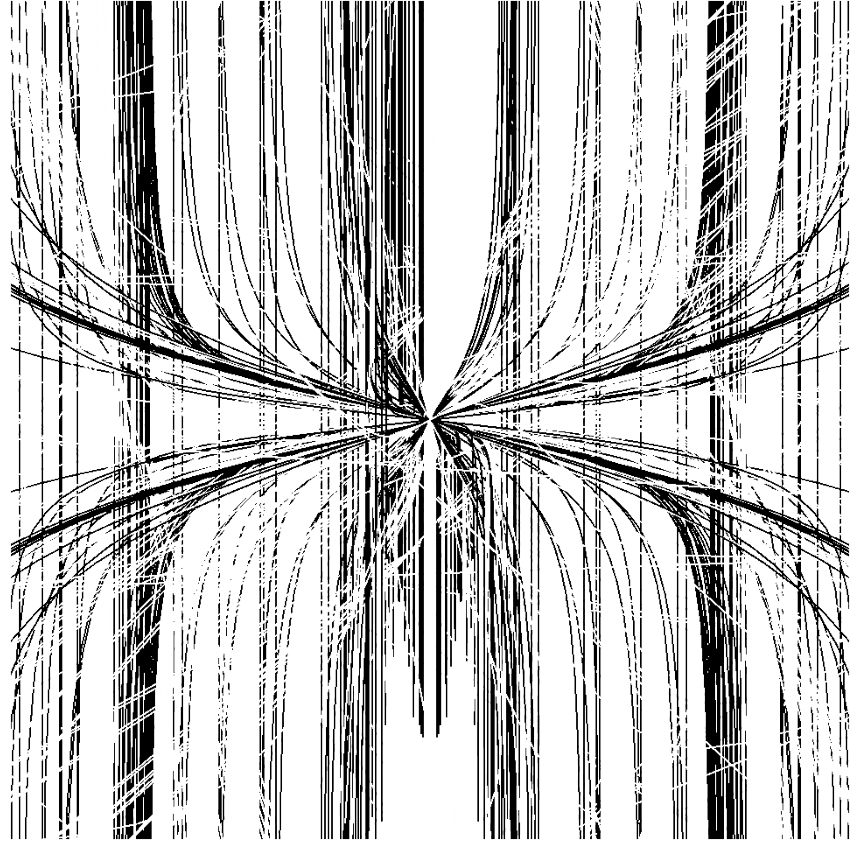
Move your mouse and be patient to generate curves, and try wiggling your mouse in the same spot to build up contrast areas!

sketch

function setup() {
    createCanvas(480, 480, WEBGL);
    angleMode(DEGREES);
    noFill();
    translate(240,240);
} 

function draw() {
//draws black lines
   drawBulletNoseCurve();
//draws white lines to create 'gaps', that spins
   for(let j=0; j<360; j++){
   push();
   stroke(255);
   fill(255,255,255,50);
   rect(-240,-240,480,480,10);
   noFill();
   rotate(mouseY);
   drawBulletNoseCurve();
   pop();
   }
}

function drawBulletNoseCurve(){
    var x;
    var y;
    var a=mouseY/10;
    var t;
    var b=mouseX/50;
//vertical orientation curves
    beginShape();
    for(var i=0;i<100; i++){
         var t = map(i, 0, 100, 0, 200);
        x=a*cos(t);
        y=b*(cos(t)/sin(t));
        vertex(x,y);
    }
    endShape();
//horizontal biased 
    beginShape();
    for(var i=0;i<100; i++){
        var t = map(i, 0, 100, 0, 400);
        x=10*-a*cos(t);
        y=10*b*(cos(t)/sin(t));
        vertex(x,y);
    }
    endShape();
}

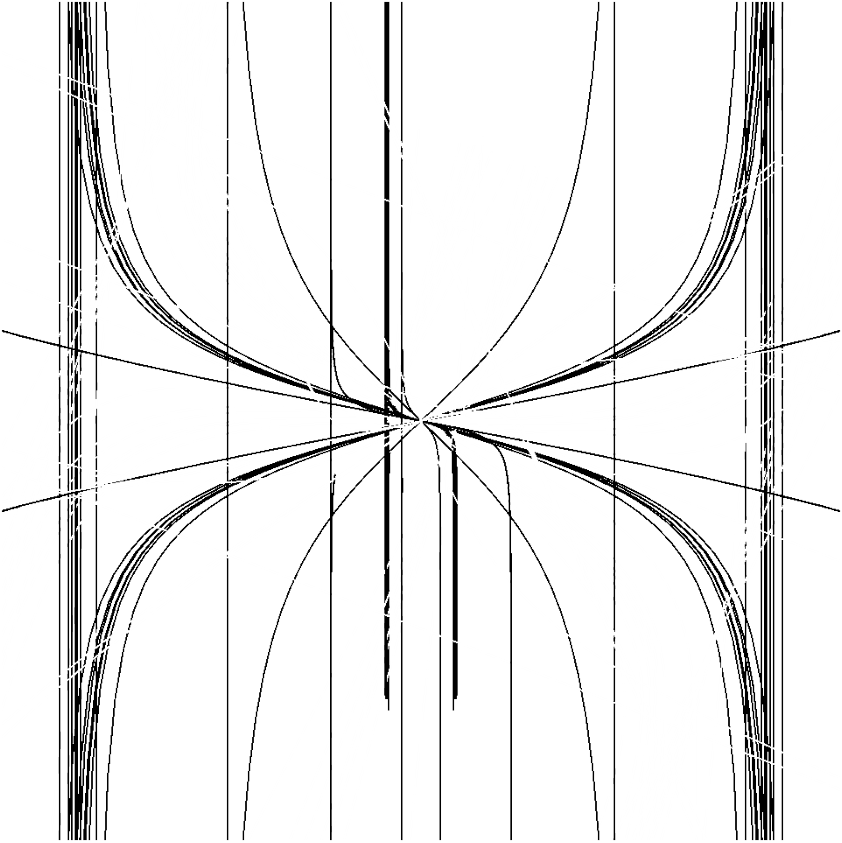
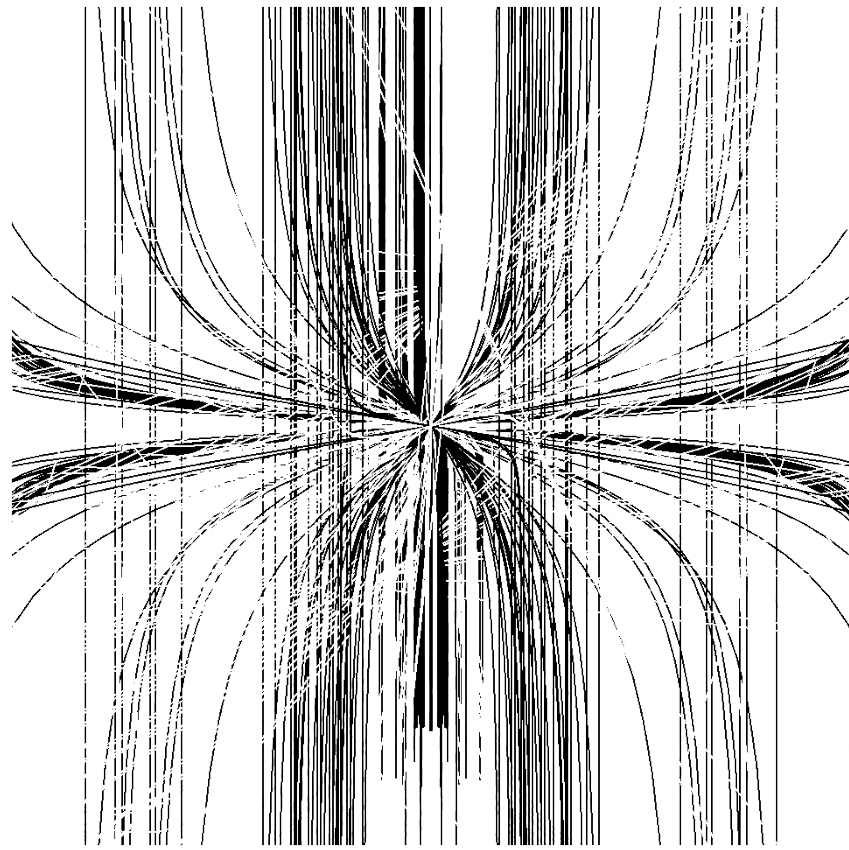
I used the Bullet Nose curve to create my project. It uses both black and white layers of lines on a white line, so the white layers create ‘gaps’ or glitches in the black pattern, but it uses the bullet nose curve rotated around the origin to create them. I decided to create a separate function for drawing the curve, as I would use it for different purposes with different strokes. The mouse position helps determine the width of the asymptote portions of the curves, as well as the severity of the curve (how flat the inner portion is). I also made the creative decision to have it build up or truly ‘draw’ instead of re drawing the background each time. This allows the user to see the history of the work and understand the curves and gaps better.

Beginning of the experience, with few lines
Later, with more lines drawn
Alternative final state, with mouse hovering creating bolder areas

LookingOutwards-07

This project creates visualizations for the way that content is shared through Facebook. It creates branching organic visuals on a pastel background to show the different rates and tree-like structure that describes media dissemination using Facebook. The exponential share-based structure allows the graphic to start at the center and branch out to fill the space, so I think the algorithm may assign share trees randomly around the centerpoint to then extend in a somewhat linear fashion, but the curves of the branches may describe unique share patterns. The creator’s artistic sensibilities are manifested through the visual display of the linkages (the leave/flower graphics) and the algorithm that dictates the organization of the branches.

https://rachelbinx.com/Facebook-Stories-Virality

Project 7 — Composition with Curves

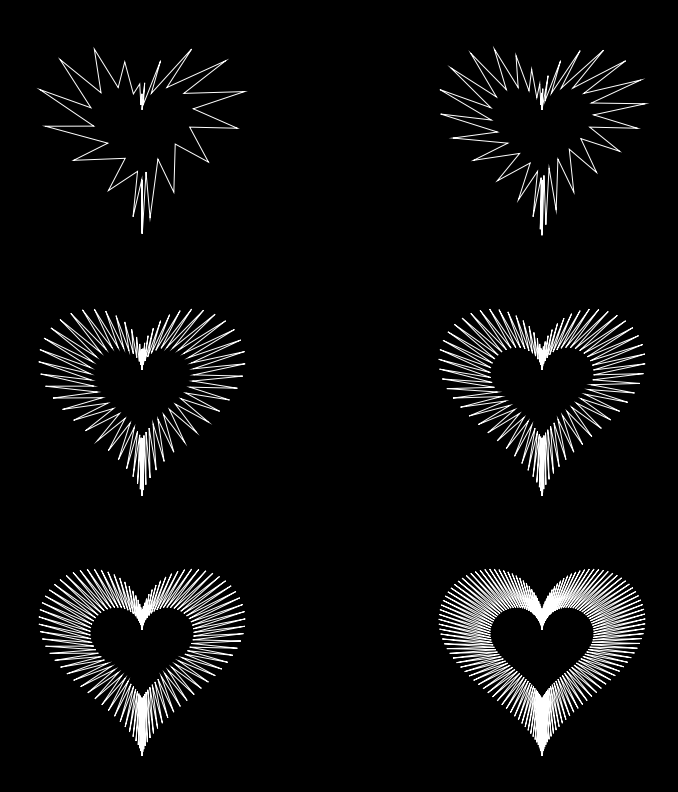
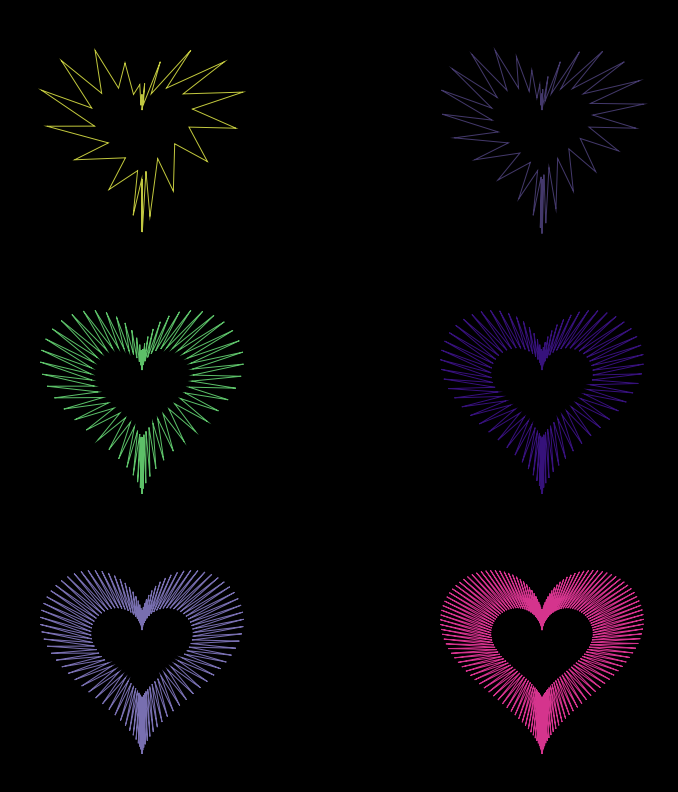
For this project, I wanted to draw a single object but in different ways. I took the functions from the website provided in the project brief and decided to draw a heart by plugging in functions for “x” and “y” and using the “beginShape()” function. I first began by using a “for loop” to draw a circle by creating a local variable that adds in increments for every loop. By altering this variable, I was able to draw the heart in different ways.

Click to change colors:

sketch
function setup() {
    createCanvas(400, 480);
    background(220);
    text("p5.js vers 0.9.0 test.", 10, 15);
}

function draw() {
    background(0);
    translate(width / 2, height / 2);

    //heart one
    push();
    translate(-100, -130);
    noFill();
    strokeWeight(0.5);
    stroke(255);
    beginShape();
    for(var a = 0; a < TWO_PI; a += 0.3) { //this function draws a circle before the equation is put in
        if(mouseIsPressed){
            stroke(random(255), random(255), random(255)); //color change
        }
        //drawing the first heart
        var r = constrain(mouseX / 180, 1, 70); //movement of mouse
        var x = r * 16 * pow(sin(a), 3);
        var y = -r * (13 * cos(a) - (5 * cos(2 * a)) - 2 * cos(3 * a) - cos(4 * a));
        vertex(x, y);
        //drawning the second heart
        var b = r/2 * 16 * pow(sin(a), 3);
        var c = -r/2 * (13 * cos(a) - (5 * cos(2 * a)) - 2 * cos(3 * a) - cos(4 * a));
        vertex(b, c);
    }      
    endShape(CLOSE);
    pop();

    //heart two
    push();
    translate(100, -130);
    noFill();
    strokeWeight(0.5);
    stroke(255);
    beginShape();
    for(var a = 0; a < TWO_PI; a += 0.2) {
        if(mouseIsPressed){
            stroke(random(255), random(255), random(255)); //color change
        }
        //drawing the first heart
        var r = constrain(mouseX / 180, 1, 70); //movement of mouse
        var x = r * 16 * pow(sin(a), 3);
        var y = -r * (13 * cos(a) - (5 * cos(2 * a)) - 2 * cos(3 * a) - cos(4 * a));
        vertex(x, y);
        //drawing the second heart
        var b = r/2 * 16 * pow(sin(a), 3);
        var c = -r/2 * (13 * cos(a) - (5 * cos(2 * a)) - 2 * cos(3 * a) - cos(4 * a));
        vertex(b, c);
    }      
    endShape(CLOSE);
    pop();

    //heart three
    push();
    translate(-100, 0);
    noFill();
    strokeWeight(0.5);
    stroke(255);
    beginShape();
    for(var a = 0; a < TWO_PI; a += 0.1) {
        if(mouseIsPressed){
            stroke(random(255), random(255), random(255)); //color change
        }
        //drawing the first heart
        var r = constrain(mouseX / 180, 1, 70);
        var x = r * 16 * pow(sin(a), 3);
        var y = -r * (13 * cos(a) - (5 * cos(2 * a)) - 2 * cos(3 * a) - cos(4 * a));
        vertex(x, y);
        //drawing the second heart
        var b = r/2 * 16 * pow(sin(a), 3);
        var c = -r/2 * (13 * cos(a) - (5 * cos(2 * a)) - 2 * cos(3 * a) - cos(4 * a));
        vertex(b, c);
    }      
    endShape(CLOSE);
    pop();

    //heart four
    push();
    translate(100, 0);
    noFill();
    strokeWeight(0.5);
    stroke(255);
    beginShape();
    for(var a = 0; a < TWO_PI; a += 0.08) {
        if(mouseIsPressed){
            stroke(random(255), random(255), random(255)); //color change
        }
        //drawing the first heart
        var r = constrain(mouseX / 180, 1, 70);
        var x = r * 16 * pow(sin(a), 3);
        var y = -r * (13 * cos(a) - (5 * cos(2 * a)) - 2 * cos(3 * a) - cos(4 * a));
        vertex(x, y);
        //drawing the second heart
        var b = r/2 * 16 * pow(sin(a), 3);
        var c = -r/2 * (13 * cos(a) - (5 * cos(2 * a)) - 2 * cos(3 * a) - cos(4 * a));
        vertex(b, c);
    }      
    endShape(CLOSE);
    pop();

    //heart five
    push();
    translate(-100, 130);
    noFill();
    strokeWeight(0.5);
    stroke(255);
    beginShape();
    for(var a = 0; a < TWO_PI; a += 0.06) {
        if(mouseIsPressed){
            stroke(random(255), random(255), random(255)); //color change
        }
        //drawing the first heart
        var r = constrain(mouseX / 180, 1, 70);
        var x = r * 16 * pow(sin(a), 3);
        var y = -r * (13 * cos(a) - (5 * cos(2 * a)) - 2 * cos(3 * a) - cos(4 * a));
        vertex(x, y);
        //drawing the second heart
        var b = r/2 * 16 * pow(sin(a), 3);
        var c = -r/2 * (13 * cos(a) - (5 * cos(2 * a)) - 2 * cos(3 * a) - cos(4 * a));
        vertex(b, c);
    }      
    endShape(CLOSE);
    pop();

    //heart six
    push();
    translate(100, 130);
    noFill();
    strokeWeight(0.5);
    stroke(255);
    beginShape();
    for(var a = 0; a < TWO_PI; a += 0.04) { 
        if(mouseIsPressed){
            stroke(random(255), random(255), random(255)); //color change
        }
        //drawing the first heart
        var r = constrain(mouseX / 180, 1, 70);
        var x = r * 16 * pow(sin(a), 3);
        var y = -r * (13 * cos(a) - (5 * cos(2 * a)) - 2 * cos(3 * a) - cos(4 * a));
        vertex(x, y);
        //drawing the second heart
        var b = r/2 * 16 * pow(sin(a), 3);
        var c = -r/2 * (13 * cos(a) - (5 * cos(2 * a)) - 2 * cos(3 * a) - cos(4 * a));
        vertex(b, c);
    }      
    endShape(CLOSE);
    pop();


}
Normal state
Color state

LO-06 -Randomness

http://www.random-art.org/about/
When I was doing research on randomness in art, random-art.org came up from many of my google searches. Random-art.org stores words and letters into seeds and turns them into art. Carnegie Mellon University alumnus, Andrej Bauer, designed the algorithm through javascript with ocam.js. Bauer was able to make random generative art accessible to the public. I thought that was a really admirable quality of the project. Anyone is able to go on the website and create their own art by simply typing in words. The website interprets the text and generates art. Random-art.org allows us to explore the possibilities shown to us by computer systems and randomness.

Project-06-Abstract Clock

sketch
var y = 0;


function setup() {
  createCanvas(480, 480);
  frameRate(20);
}

function draw() {
  var v = 25
  background(230, 207, 106);

  //glass beaker
  fill(225, 230, 255);
  noStroke();
  rect(130,480,220,-270);
  stroke(80);
  strokeWeight(3);
  line(130,480,130,480-270);
  line(480-130,480,480-130,480-270);
  ellipse(240,480-270,220,10);
  

  //waterdrop
  fill(103,197,255);
  noStroke()
  ellipse(240,y,45);
  y = y + v;
  if (y > 480) {
    y = 0
  }

  //Pipe dropping water from the top
  noStroke();
  fill(71, 76, 84);
  rect(210,0,60,90);
  fill(0);
  ellipse(240,90,60,4);
  noStroke();


  //water level indicating seconds
  noStroke()
  fill(103,197,255);
  rect(130,480,220,-second()*4.5);
  stroke(83,167,245)
  strokeWeight(0.5)
  ellipse(240,480-second()*4.5,220,10);
  loop()

  //beaker outline 
  noFill();
  stroke(80);
  strokeWeight(3)
  line(130,480,130,480-270);
  line(480-130,480,480-130,480-270);
  ellipse(240,480-270,220,10);


}


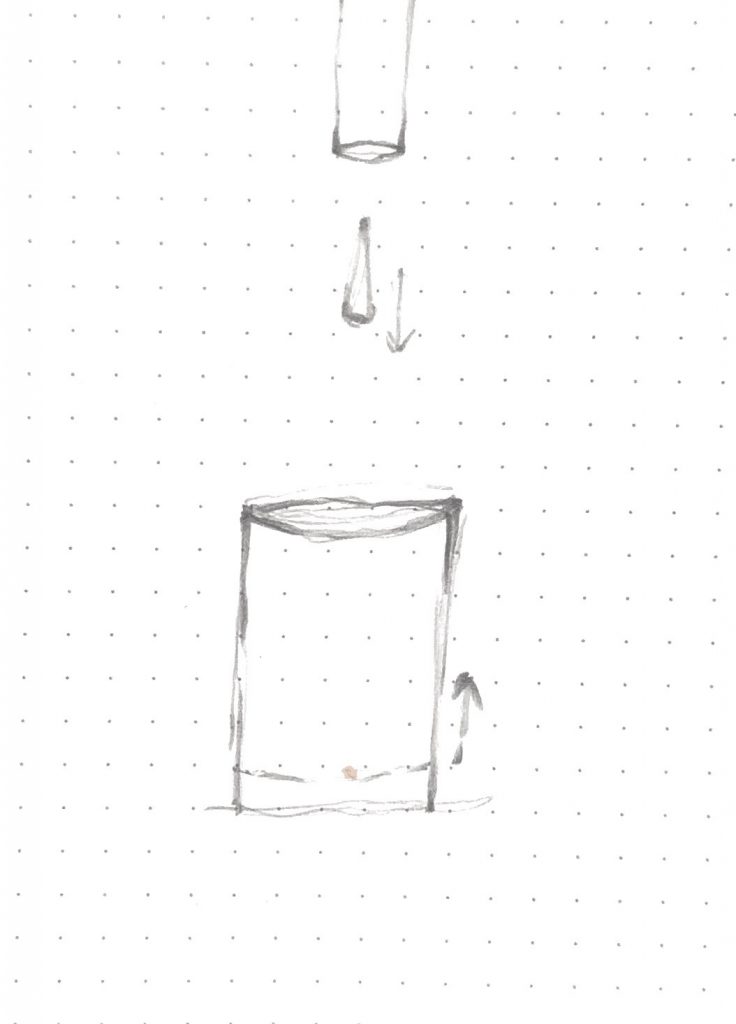
When thinking of a clock, or the idea of a clock, I was fascinated by the idea of how only something constant can be used as a device to define time. Systems that are perfectly constant are hard to find in this world, therefore we try to fine tune what we have to create a machine we can rely on. Water droplet’s relationship with gravity is constant most of the time. Therefore I thought it would be interesting to measure time with how fast droplets of water fill up a glass. Realistically, there are many other components in play that will affect how accurate this “clock” is but I found this alternate method of measuring time very fascinating.