function setup() {
    createCanvas(400, 400);
    background(220);
}

function draw() {
    background(0);
    //moves epicycloid to center
    translate(width / 2, height / 2);
    epicycloid();
}

function epicycloid() {
    // https://mathworld.wolfram.com/EpicycloidInvolute.html
    var x;
    var y;
    var a = map(mouseX, 0, width, 300, 80);
    var b = map(mouseY, 0, height, 100, 10);
    strokeWeight(2); //line weight
    stroke(10, mouseX, mouseY); // color of epicycloid
    noFill();

    //epicycloid
    beginShape();
    for (var i = 0; i <= 500; i ++) {
        var theta = map(i, 0, 500, 0, TWO_PI);
        x = (a + b) * cos(theta) - b * cos((a + b / b) * theta);
        y = (a + b) * cos(theta) - b * sin((a + b / b) * theta);
        vertex(x, y);
    }
    endShape();
}


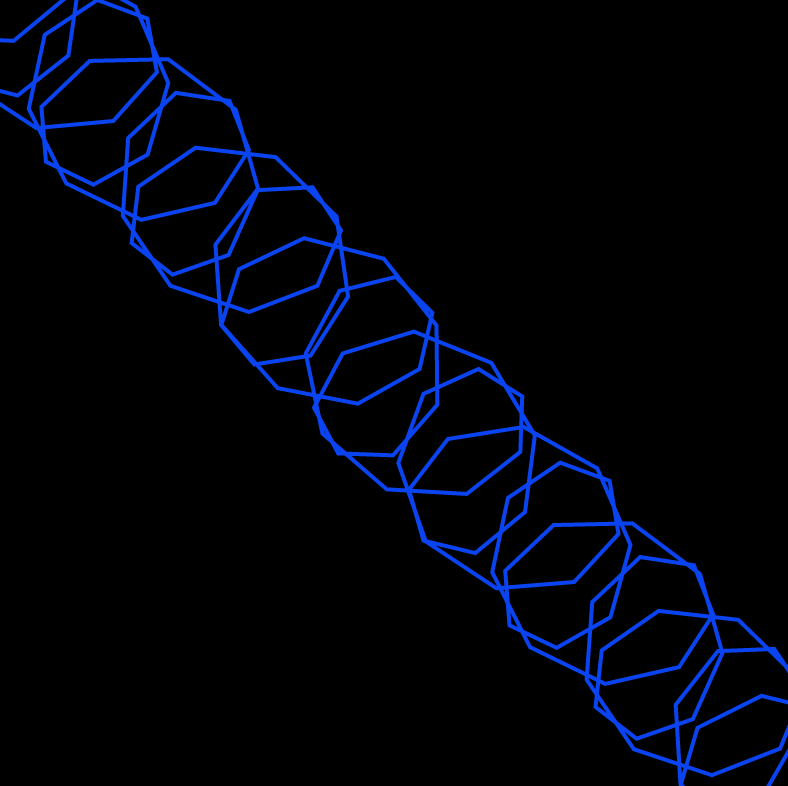
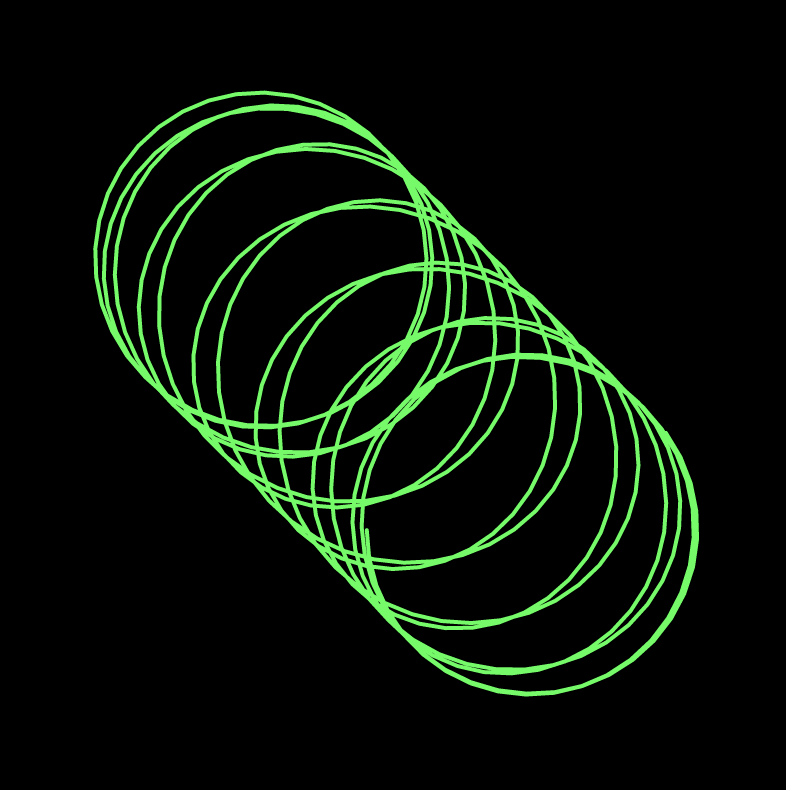
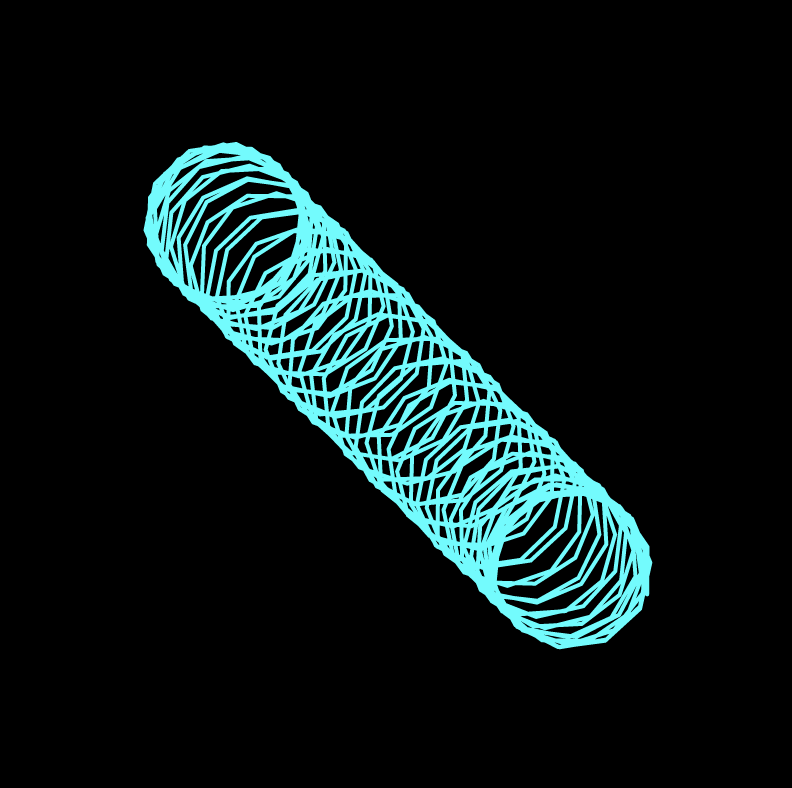
I think that the hardest part of this project was trying to find a curve on the website that was in parametric form. Figuring out how to make that formula more dynamic in this composition was also difficult. The curve that I ended up choosing was an epicycloid. In the way that I wrote the code, I like how it can be very simple with just a few circles but as the user moves the mouse, it create more interesting shapes which is really fun.
![[OLD SEMESTER] 15-104 • Introduction to Computing for Creative Practice](wp-content/uploads/2023/09/stop-banner.png)