Project-07-mdambruc

sketch

//Mairead Dambruch
//mdambruc@andrew.cmu.edu
//Section C
//Project-07-A
var nPoints = 100;
function setup() {
   createCanvas(800, 150);
}
function draw() {
   background(255);
   for (var dist = -50; dist < 800; dist = dist + 100){
   push();
   translate(dist, 110);
   drawCycloid();
   pop();
}
}
function drawCycloid () {
  var x;
  var y;
  var a = 20;
  var yfactor = mouseX / 25;//makes waves!
  var colR = map(mouseY, 0, height, 151, 0);//changes color of waves
  var colB = map(mouseY, 0, height, 209, 111);
  var colG = map(mouseY, 0, height, 255, 189);
  noStroke();
  fill(colR, colB, colG);
  beginShape();
  for (var i = 0; i < nPoints; i++){
    var t = map(i, 0, nPoints, 0, TWO_PI);
    x = a * (t - sin(t + yfactor));//equations for cycloids
    y = a * (1 + cos(t));
    vertex(x, y);
}
endShape(CLOSE);
}

I was at first very scared for this project since it was using math equations. After getting the initial shape I had a lot of fun playing with possible interactions the mouse could have with the equation. In this project I wanted to create an animation of waves that crash as you move your mouse across the horizontal axis. The waves change color as you move your mouse across the vertical axis. I really enjoyed learning about the many ways you could alter math equations to create animations and had fun by using trial and error to discover new ways to move the object.

Looking-Outwards-07-mdambruc-InformationVisualization

Pitch Interactive’s “Invisible City” 2010

wired_311_1

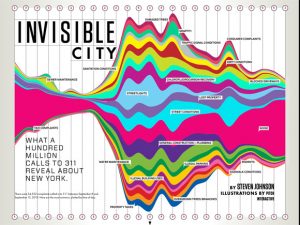
Visual Graph of Complaints of 34,522 calls

http://pitchinteractive.com/work/Wired311.html

Pitch Interactive has created a visual representation of complaints when they were filed over the course of one week on the 311 phone line for New York City, totaling up to 34,522 calls. This piece was shown in Wired Magazine and created in 2010. The NYC311 number was created to offer information about school closings and construction, but the visual representation cites complaints of “chlorofluorocarbon recovery” and “rodents”. I admire this visual representation of data because I feel it perfectly represents the aggressive nature of many irked callers. The obnoxious colors and obtrusive waves depict an image of a city of complainers. I also admire Pitch’s use of literal clocks to create a timeline as opposed to writing numbers, since it is an abstract look on time as well as aesthetically pleasing. In the NYC311 office there is a digital LED light screen which tallies the number of calls they’ve received throughout the day. I suppose that throughout the week that they were recording to create this graph, they simply created categories of complaints. Pitch Interactive then probably took the number of these complaints and created proportional waves that represented the number of complaints in a certain time of the day.

AbstractClock-Project-06-mdambruc

sketch

//Mairead Dambruch
//mdambruc@andrew.cmu.edu
//Section C
//Project-06
var buffer = 10;
var ybuffer = 20;
function setup() {
    createCanvas(610, 350);
}

function draw() {
    var s = second();
    var m = minute();
    var h = hour();
    var d = day();
    var m = month();
    background(84, 162, 178);
    secondboxes();
    minuteboxes();
    hourboxes();
    dayboxes();
    monthbox();
    }

function secondboxes(){
  var sx = 10;
  var diam = 10;
  var sy = 50;
  var spacing = 10;
  var count = 62;//seconds in a minute
  var s = second();
  text(s, buffer, sy + ybuffer);
  text("seconds", buffer + ybuffer, sy + ybuffer);
  fill(255);
  for (var i = 2; i < count; i++) {
  ellipse(sx, sy, diam, diam);
  sx = sx + spacing;
  if (i == s){
    fill(0);//current second
  } else{
    fill(255);
  }
}
}
function minuteboxes(){
  var mx = 10;
  var diam = 10;
  var my = 100;
  var spacing = 10;
  var count = 62;//minutes in an hour
  var m = minute();
  text(m, buffer, my + ybuffer);
  text("minutes", buffer + ybuffer, my + ybuffer);
  fill(255);
  for (var i = 2; i < count; i++) {
  ellipse(mx, my, diam, diam);
  mx = mx + spacing;
  if (i == m){
    fill(0);//current minute
  } else{
    fill(255);//
  }
}
}

function hourboxes(){
  var hx = 10;
  var diam = 10;
  var hy = 150;
  var spacing = 10;
  var count = 26;//24 hours in a day
  var h = hour();
  text(h, buffer, hy + ybuffer);
  text("hours", hx + ybuffer, hy + ybuffer);
  fill(255);
  for (var i = 2; i < count; i++) {
  ellipse(hx, hy, diam, diam);
  hx = hx + spacing;
  if (i == h){
    fill(0);//current hour
  } else{
    fill(255);//
  }
}
}

function dayboxes(){
  var dx = 10;
  var diam = 10;
  var dy = 200;
  var spacing = 10;
  var count = 33;//31 days in october
  var d = day();
  text(d, buffer, dy + ybuffer);
  text("days", dx + ybuffer, dy + ybuffer);
  fill(255);
  for (var i = 2; i < count; i++) {
  ellipse(dx, dy, diam, diam);
  dx = dx + spacing;
  if (i == d){
    fill(0);//current day
  } else{
    fill(255);//
  }
}
}

function monthbox(){
  var mx = 10;
  var diam = 10;
  var my = 250;
  var spacing = 10;
  var count = 14;//12 months in a year
  var m = month();
  text(m, buffer, my + ybuffer);
  text("months", mx + ybuffer, my + ybuffer);
  fill(255);
  for (var i = 2; i < count; i++) {
  ellipse(mx, my, diam, diam);
  mx = mx + spacing;
  if (i == m){
    fill(0);//current month
  } else{
    fill(255);//
  }
}
}

For this Abstract Clock project, I wanted to create a full year calendar. Taking inspiration from the previous calendar assignment I created a calendar that tracks the seconds, minutes, hours, days and months in a year. I enjoy this clock because I believe it is a clock designed for a visual person; showing dates with symbols rather than numbers. My process involved a lot of trial and error with various ideas and finding myself struggling with more complex ideas. I found this project interesting since it made me question the original concept of clocks in general. I enjoyed the idea of making a full year calendar since all of the information is in front of you in a visually pleasing way. Although a bit stressful watching the seconds go by, I improved with using loops and learned a lot from this project. 

Looking Outwards-06-mdambruc

Mike Love “Permanent Holiday” 2013

Mike Love’s acoustic session video

screen-shot-2016-10-07-at-10-55-22-pm

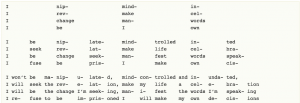
Visual aid of layered syllables

http://www.mikelovemusic.com/bio/

Mike Love is a musician based in Oahu, Hawaii who uses randomness in his music. Over 12 loops he builds a song through sporadic syllables that culminate into full lyrics. I admire the amount of precision it requires for Love to be able to succeed in communicating his lyrics over the numerous loops he creates. I also admire his unique approach to making music, and how it requires a process. Love randomly chooses the syllables he wants to say over a single loop and by the end of 12 loops he has created full lyrics. Love believes that the process and message is most important in his work, focusing on messages that affect change when it is necessary, specifically focusing on being accountable for your actions.


mdambruc_Project_05_Wallpaper

sketch

//Mairead Dambruch
//Section C
//mdambruc
//Project-05

function setup() {
  createCanvas(590, 500);
  background("Turquoise");
}

function draw() {
  var buffer = 70;
  var ybuffer = 60;
  for (var px = 0; px < width; px = px + buffer){
  for (var py = 0; py < height; py = py + ybuffer){
  toilet(px, py);
  man(px, py);// for loop to create groupings of man on toilet
}
}

function toilet(px, py){
  var px;
  var py;
  push();
  translate(px, py);
  fill(255);
  arc(50, 50, 15, 15,0, PI, CHORD);
  rect(58, 35, 8, 15);
  quad(55, 63, 60, 50, 66, 50, 66, 63);
  pop();

}

function man(px, py){
  var px;
  var py;
  push();
  translate(px, py);
  noFill();
  beginShape();
  curveVertex(30, 26);
  curveVertex(49, 40);
  curveVertex(52, 48);
  curveVertex(39, 48);
  curveVertex(41, 60);
  curveVertex(36, 62);
  endShape();//torso

  line(48, 37, 40, 45);
  line(35, 40, 40, 45);
  line(48, 37, 42, 32);
  line(40, 60, 36, 63);
  line(34, 38, 40, 41);//body

  fill(0);
  ellipse(40, 31, 9, 9);//head
  pop();
}
}

In this project I wanted to illustrate the “Demographic of the Internet”, which is essentially people going to the bathroom using their smartphones. I really enjoyed the illustrative part of this assignment and I learned more about for loops.

mdambruc_LookingOutwards_05

Andy Lomas Cellular Forms 2014

http://www.andylomas.com/cellularFormImages.html

Video of Cellular Forms

I’ve always been fascinated by the small processes in biology that are not able to be seen by the human eye. I was drawn to Andy Lomas’s Cellular Forms because he created an animation of forms that was modeled after cellular growth. I admire that Lomas chose to create a graphic that took inspiration from biology but did not model the animation after any particular organism, leaving the interpretation up to the viewer. Lomas created the graphic by starting with an initial cluster of cells and then adding complexity to the structure. Lomas used parameters to measure and control the accumulated nutrient levels in the cells to monitor when a cell would divide. Once a certain nutrient level was reached, the cell would divide and reconnect with neighboring cells. I suppose that due to all of the repetitions in the work, Lomas must have used loops or a variation of them. Lomas was also interested in the reactions of his viewers. He believed that there was something deeply psychological in humans where if we see these biological processes we feel connected to the biological forms. Being the CG supervisor for the movie Avatar, I believe Lomas is very invested and successful in creating an appreciation for biological processes in his viewers. 

mdambruc-Project-04

sketch

//Mairead Dambruch
//mdambruc@andrew.cmu.edu
//section C
//Project-04

function setup() {
    createCanvas(640, 480);
    background(180, 218, 214);
}
function draw() {
    var offset = 100; //moves translated lines
    var spacing = 5;
    var weirdnumber = 4.5;
    for (var i = 0; i < width; i += 3){

    stroke(0);
    line(i, 0, width - offset*3, i + spacing);//black curve top left

    stroke(255);
    line(0, height - offset*2, i, 0);//white line - not a curve just a fun shape

    stroke(255);
    line(350, width + i, i + offset*3, 0);// white curve on right side

    stroke(0);
    line(0, width - i, i + offset, 0);//black curve in upper left hand corner

    //repeated black curves

    push();
    translate(offset, 0);
    stroke(0);
    line(i, 0, width - offset*3, i + spacing);
    pop();

    push();
    translate(-offset, 0);
    stroke(0);
    line(i, 0, width - offset*3, i + spacing);
    pop();

    push();
    translate(-offset * 2, 0);
    stroke(0);
    line(i, 0, width - offset*3, i + spacing);
    pop();

    push();
    translate(offset*2, 0);
    stroke(0);
    line(i, 0, width - offset*3, i + spacing);
    pop();

    //

    stroke(255, 75, 46);
    line(0, i, i+ spacing, height);//Original orange Curve bottom left

    //repeated orange curves
    push();
    translate((offset * (offset/2)), 0);
    stroke(255, 75, 46);
    line(0, i, i+ spacing, height);
    pop();

    push();
    translate(offset*3, 0);
    stroke(255, 75, 46);
    line(0, i, i+ spacing, height);
    pop();

    push();
    translate((offset* weirdnumber), 0);
    stroke(255, 75, 46);
    line(0, i, i+ spacing, height);
    pop();

    push();
    translate(width, 0);
    stroke(255, 75, 46);
    line(0, i, i+ spacing, height);
    pop();
  }

}

In this assignment I mostly focused on experimenting with the mixing of colors in the curves. I enjoyed changing the spacing between lines to create interesting visual effects.

Mdambruc-LookingOutwards04

http://www.machina.cc/pages/midi-jackethttp://

Video of how jacket responds to motion with sound

Machina’s MIDI Jacket (2013)

Machina’s MIDI jacket first caught my attention because it is ultimately a marriage of three things – sound, motion and art. I consider the art to be created through the dancing, as well as the sound that is created through motion. The MIDI jacket is essentially a piece of apparel that creates sounds based off your movements with the aids of an altimeter (measures the distance between your hand and the ground), a magnetometer (compass-like sensor), a gyroscope and an accelerometer (change pitch frequencies based on speed). I admire this project because the wearer is able to seamlessly create a multimedia art form simply through wearing a jacket. I also admire this project because it allows anyone to be an artist – whether they can dance or not, the wearer is able to make art. In the jacket there is an electronic board and a Bluetooth module. The electronic board handles data sensing and passes the data to the Bluetooth module, which then is passed on to a companion app. In the app the data is converted to MIDI. The algorithms that created this work are available through the website as a software development kit. The artistic sensibilities of creators Stephany Jeanaina and Antonio Machina were to “design a clothing brand people could buy, but feel as if they’re buying an electronic gadget.”  and to answer the question, “What sound do your moves create?”.


mdambruc-Looking Outwards-03

weather-forecast-box-tempescope-ken-kawamoto-5

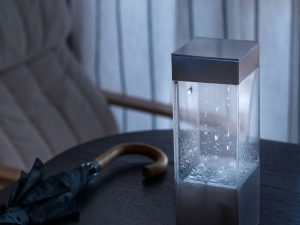
The Tempescope; A Bedside Visual Representation of Weather

Video of The Tempescope

http://www.tempescope.com/


Ken Kawamoto “The Tempescope”

The Tempescope, created by Japanese software engineer Ken Kawamoto in 2015 is a physical display of weather that is wirelessly connected to a computer in real-time to show a visual representation of the world outside – who needs windows? I admire this project because the simulation of weather in a small compact box is amazing to me. It is taking an aspect of life that I used to believe was out of the hands of humans and manipulating it to a size that fits on a bedside table. Kawamoto’s sensibilities have manifested in rain droplets, mist and even personal thunderstorms. Starting as a shampoo bottle prototype, crowdfunding has single-handedly brought the tempescope to consumers. The entire programming of the product is available on GitHub which allows the public to create their own Tempescope if they wish. Kawamoto’s goal for the project was to “always have the sunshine (and occasional tropical thunderstorms) of the Okinawa Isles in the living room”, which I believe he has achieved quite successfully. Kawamoto is very generous in allowing open access to his opensource GitHub of the Tempescope, and I believe it is a response to the overwhelming support he received through crowdfunding.  

mdambruc-Project-03-Dynamic Drawing

project-03

//Mairead Dambruch
//mdambruc@andrew.cmu.edu
//Section C
//Project-03
var xT;// x value for turquoise circles
var yT; // y value for turquoise circles

var diamx = 30; //x value diameter
var diamy = 30; // y value diameter

var diffx = 0;
var diffy = 0;// x and y values to get dragging effect

var drag = .05; //speed of dragging effect

var swarmX = 300;
var swarmY = 300;// original ball orientation

var swarmXA = 200;
var swarmYA = 200;//copy A ball orientation

var swarmXB = 100;
var swarmYB = 100;//copy B ball orientation

var swarmXC = 400;
var swarmYC = 400;//copy C ball orientation

function setup() {
    createCanvas(640, 480);
    xT = width/2;
    yT = height/2; // original orientation of turqoise circles
}

function draw() {

  var colR = map(mouseY, 0, height, 0, 255);
  var colG = map(mouseY, 0, height, 95, 95);
  var colB = map(mouseY, 0, height, 120, 120); //magic numbers are being used for color
    background(colR, colG, colB);

  diffx = mouseX - swarmX;
  diffy = mouseY - swarmY; // subtracting to get same position

  swarmX = swarmX + drag*diffx;
  swarmY = swarmY + drag*diffy; //specific speed of drag

  noStroke();
  fill(255);
  ellipse(swarmX, swarmY, diamx, diamy);//original circle

  diffx = mouseX - swarmXA;
  diffy = mouseY - swarmYA;
  swarmXA = swarmXA + (drag*2) *diffx;
  swarmYA = swarmYA + (drag*2) *diffy;
  noStroke();
  fill(255);
  ellipse(swarmXA, swarmYA, diamx, diamy);//altered circle A

  diffx = mouseX - swarmXB;
  diffy = mouseY - swarmYB;
  swarmXB = swarmXB + (drag/2)*diffx;
  swarmYB = swarmYB + (drag/2)*diffy;
  noStroke();
  fill(255);
  ellipse(swarmXB, swarmYB, diamx, diamy);//altered circle B

  diffx = mouseX - swarmXC;
  diffy = mouseY - swarmYC;
  swarmXC = swarmXC + (drag/4) *diffx;
  swarmYC= swarmYC + (drag/4) *diffy;
  noStroke();
  fill(255);
  ellipse(swarmXC, swarmYC, diamx, diamy);//altered circle C

  if (mouseIsPressed) //changes x diameter of ellipses
   diamx = 50;
   else {
     diamx = 30;
   }

  noStroke();
  fill("Turquoise");
  ellipse(xT, yT, diamx, diamy); //original turquoise circle
  noStroke();
  fill("Turquoise");
  ellipse(xT, yT/2, diamx, diamy); // altered position
  noStroke();
  fill("Turquoise");
  ellipse(xT/2, yT/2, diamx, diamy);//Altered position
  noStroke();
  fill("Turquoise");
  ellipse(xT/2, yT, diamx, diamy);//altered position

  if (mouseX > xT) {
    xT -= 1;
    offset = 5;//moves circles to the left if x variable of mouse is greater
  }

  if (mouseX < xT){
    xT += 1;
    offset = 5; // moves circles to the right if x variable of mouse is lesser
  }
}

I struggled a lot with many aspects of this assignment – mostly the functions and how they are able to be used without effecting other parts of the drawing. My drawing uses a few functions to vary different aspects of the piece and I am hoping to get better at being efficient at variables and hopefully more elaborate with designs. My drawing uses both the position of the mouse and the mousePressed function.