//Lydia Jin
//Section B
// jialuj@andrew.cmu.edu
// Project 7
var nPoints = 100;
function setup() {
    createCanvas(600, 600);
}

function draw() {
	background('black');

	//print title
	fill('white');
	text("Astroid", 20, 20);

	//color changes over mouse interactions
	var r = map(mouseX, 0, 600, 0, 255);
	var rr = map(mouseY, 0, 600, 0, 255);

	push();
	stroke(r, rr, r);
	strokeWeight(4);
	translate(width/2, height/2);
	var x;
	var y;
	//get b from mouse X coodinate
	var b = map(mouseX, 0, width, 5, 35);
	var ph = mouseY/45;
	fill(rr, rr, r);
	beginShape();

	//draw the Astroid
	for (var i =0; i < nPoints; i++){
		var t = map(i, 0, nPoints, 0, TWO_PI);
		x = 3 * b * cos(t) + b * cos(3 * t);
		y = 3 * b * sin(t) - b * sin(ph + 3 * t);
		vertex(x, y);
	}
	endShape(CLOSE);

	pop();
}


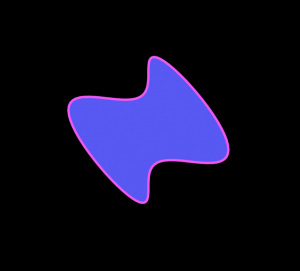
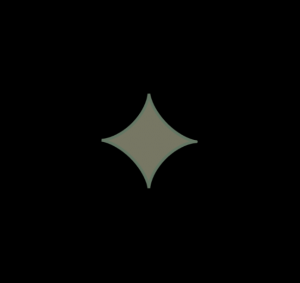
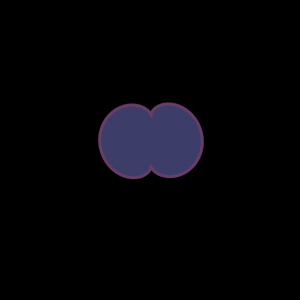
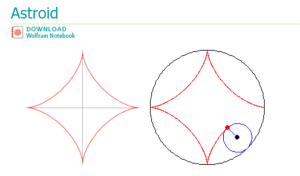
I came up with this idea by looking at the list of curves on the math website. I really like the looks of the astroid as it looks like a star. Then I did some changes to it so sometimes it looks round and other times pointy. I also wanted the colors to change and now the design sort of looks like changing microorganisms. The shapes are also enclosed by different colored strokes to make the images appear more visually appealing.The user can move the mouse to see the changing shapes.
![[OLD – FALL 2016] 15-104 • COMPUTING for CREATIVE PRACTICE](wp-content/uploads/2020/08/stop-banner.png)