Jacky Tian’s project 04

jacky’s sketch 1


function setup() {
    createCanvas(400, 300);
}

function draw() {
    background(0)
    for (var i = 0; i < 21; i++) {
        stroke(255, 0, 0);
        line(width/5+i*10, 0, 0, height/2+i*(-5)); //line set 1

        stroke(255)
        line(0, height/2+i*10, width/3+i*(-5), 0); //line set 2

        stroke(0, 255, 0);
        line(0, height/3+i*10, width/2+i*(10), height);  //line set 3

        stroke(0, 0, 255);
        line(width, height/7+i*10, width*3/4+i*(-10), height); //line set 4

        stroke(150, 80, 0);
        line(width, height/7+i*10, width/4+i*(10), 0); //line set 5


        // stroke(100, 0, 100);
        // line(width/5+i*10, 0, 0, height/2+i*(-5));
        
    }
}

In this project, I created five sets of lines rotating along the sides to create five curves. The background is black so that it makes the colors more obvious.

Sophie Chen – Project 04 – String Art

sketch

var x1 = 1;
var x2 = 1;
var y1 = 1;
var y2 = 1;

function setup() {
    createCanvas(400, 300);
    background(0);

}

function draw() {
	// bottom section
	for (var i1 = 5; i1 < 200; i1 += 10){ // start i1 at 5
		strokeWeight(1);
    	stroke(255, 0, 255); // purple
    	x1 = 0.2 - i1;
    	y1 = width - i1 - 50;
    	x2 = width;
    	y2 += 25 - i1 / 15; // end point of line should grow towards end
		line(x1, y1, x2, y2);
	}
	// top section
	for (var i2 = 0; i2 < 300; i2 += 1){ // start i2 at 0
		strokeWeight(1)
		stroke(255, 0, 100); // pink
		x1 = 0;
		y1 = width - i2 * 10;
		x2 = i2 + height;
		y2 = i2 / 50;
		line(x1, y1, x2, y2);
	}
	// right section
	for (var i3 = 20; i3 < 300; i3 += 10){ // start i3 at 20
		strokeWeight(0.5)
		stroke(255, 150, 100); // orange
		x1 = 0 - i3 * 10;
		y1 = height - i3 * 30;
		x2 = i3 * 0.5 + 300;
		y2 = i3 + height / 2;
		line(x1, y1, x2, y2);
	}
	// left section
	for (var i4 = 0; i4 < 300; i4 += 5){ // start i4 at 0
		strokeWeight(1);
    	stroke(100, 100, 255); // blue
    	x1 = 0; // start at 0
    	y1 = height - i4; 
    	x2 += width - i4; // lines concentration increase at the end
    	y2 += i4 * 2;
		line(x1, y1, x2, y2);
	}
}

For this project, my goal was to create something more environmental and resembles landscapes/light through lines. I started by creating the bottom one first, and modified the rest based on the bottom one.  I was trying to create a sense of depth through these two-dimensional strings, and although it took me a while to understand what I was doing, it was definitely a learning process.

Robert Oh-Project-04-String-Art

version2

//Robert Oh
//Section C
//rhoh@andrew.cmu.edu
//Project-04-String-Art

//assigning variables


function setup() {
    createCanvas(400, 300);
}


function draw() {
    background(0);
    strokeWeight(1)
    stroke(255, 120, 79)

    //creating the top and bottom parts
    for (var i = 1; i < 401; i+=10){
        line(200, 26, i, 300);
        line(200, 274, i, 0);
    }

    stroke(255, 142, 142)
    //creating the left and right parts
    for (var i = 1; i < 301; i+=10){
        line(33, 150, 400, i);
        line(367, 150, 0, i);
    }

    stroke(255);
    //creating the top left and bottom right parts
    for (var i = 1; i < 401; i+=12){
        line(0, height-(i*3/4), i, 0)
        line(i, 300, 400, height - i*3/4);

    }
    
    //creating the bottom left and top right parts
    //I changed the increment here to be lower to show more depth
    for (var i = 1; i < 401; i+=5){
        line(0, i*3/4, i, 300);
        line(i, 0, 400, i*3/4);
    }
}

For this project, I originally started off just experimenting around. When I finally was able to create the “star” figure in the middle, I knew I wanted to add some more flair, and so I included the curves covering the edges of the screen.

Alessandra Fleck – Project 04 String Art

sketch

//Name: Alessandra Fleck 
//Class Section : B
//Email: afleck@andrew.cmu.edu
//Project-04


function setup() {
    createCanvas(480, 300);
    strokeWeight(0.3);
}

function draw() {
    background(0);
    
    //blue back lines (no curve)
    for (var i = 0; i < 400; i += 6) {
    	stroke(155,236,255);
      	line(i, 0, 1.5*i, i); //top right corner start
      	//line(x1,y1,x2,y2);
      	line(2*i, 300, width, i); //bottom left corner start 
    }

    //secondary layer for color in light blue

    for (var i = 0; i < width; i += 3) {
      	stroke(179,223,222);
      	strokeWeight(0.3);
      	line(i*2, 0, width, i); //top right curve with lines
      	line(i*2, 0, height * 2, i); //next curve next to curved line 1
      	line(i*2, 0, height * 1, i); //next curve next to curved line 2
      	line(i*2, 0, height * 0.75, i + 20); //next curve next to curved line 3
      	line(i*2, 0, height * 0.6, i + 20); //next curve next to curved line 3
      	line(i*2, 0, height * 0.5, i + 100); //next curve next to curved line 3
    }

    //third layer for color

    for (var i = 0; i < width; i += 3) {
      	stroke(220,183,225);
      	strokeWeight(0.3);
      	line((i*2)+100, height, 300, i); //top right curve with lines
      	
      	line((i*2)-100, height, height * 1, i); //next curve next to curved line 2
      	
      	line((i*2)-100, 0, height * 0.6, i + 20); //next curve next to curved line 3
      	line(i*2, 0, height * 0.5, i + 100); //next curve next to curved line 3
    }


}

For this project, I wanted to try understanding how to take a line and manipulative it into a twisting curve. To invert the curve and create the twist like form, I used the height variable in the x2 coordinate section and multiplied it by a decimal to decrease the dynamic scale of the curve. I hope to be able to use this technique for something more symmetrical next time.

YiranXuan-Project04-String-Art

This string art is based on an physical string art example I found on the web that is similar to the yin-yang. At first I was curious what the mathematical formula would be to create such a pattern where the inner curve would curve much more sharply than the outer curve. This was explained when I watched the video, where the artist increments one side of the strings by two pegs around the circle, while the other side only by one peg. I also needed to solve the problem of overlapping; I wanted both colors to be cover each other only in specific areas, not just have one over the other. This was solved by drawing strings for both sides in the same loop iteration.

sketch

function setup() {
    createCanvas(400, 300);
    background('white');
    angleMode(DEGREES);
}

function draw() {
	var radius = 150;
	var dotradius = 50;

	var whitecenter = 210; //centers of the dots
	var blackcenter = 90;

	var whiteslow = 0; //each line consists of a "slow point" that travels around the circle at 1 degree per iteration
	var whitefast = 180; //and a "fast point" which travels around the circle at 2 degrees per iteration;
	var blackslow = 180;
	var blackfast = 0;

	//the dots will piggyback off of the progression of whitefast, as they are forming complete circles. 
	//They will beformed by lines that are offset by 15 degrees

	var slowincrement = 3;
	var fastincrement = 2*slowincrement;

	for(whiteslow = 0; whiteslow <= 180; whiteslow += slowincrement){

		stroke('red');
		line(cos(whitefast)*dotradius + width/2, sin(whitefast)*dotradius + whitecenter, cos((whitefast+120)%360)*dotradius + width/2, sin((whitefast+120)%360)*dotradius + whitecenter); //drawing the white dot
		stroke('blue');
		line(cos(whitefast)*dotradius + width/2, sin(whitefast)*dotradius + blackcenter, cos((whitefast+120)%360)*dotradius + width/2, sin((whitefast+120)%360)*dotradius + blackcenter); //drawing the white dot


		stroke('red');
		line(cos(whiteslow)*radius + width/2, sin(whiteslow)*radius + height/2, cos(whitefast)*radius + width/2, sin(whitefast)*radius + height/2); //drawing the first white line
		stroke('blue');
		line(cos(blackslow)*radius + width/2, sin(blackslow)*radius + height/2, cos(blackfast)*radius + width/2, sin(blackfast)*radius + height/2); //drawing the first black line
		//the updated slow points to the old fast points

		blackfast = (blackfast+fastincrement)%360; //updating fast points; if they go over 360, they wind back at 1
		whitefast = (whitefast+fastincrement)%360;

		stroke('yellow');
		line(cos(whiteslow)*radius + width/2, sin(whiteslow)*radius + height/2, cos(whitefast)*radius + width/2, sin(whitefast)*radius + height/2); //drawing the first white line
		stroke('cyan');
		line(cos(blackslow)*radius + width/2, sin(blackslow)*radius + height/2, cos(blackfast)*radius + width/2, sin(blackfast)*radius + height/2); //drawing the first black line
		//the updated slow points to the updated fast points

		blackslow += slowincrement; //updating slow point
	}

}


Han Yu Project 04 String Art

sketch

// Han Yu
// Section D
// hyu1@andrew.cmu.edu
// Project-04

function setup() {
    createCanvas(400, 300);
    background(24, 146, 245);
}

function draw() {
// the pink background
	for (var i = 0; i <400; i++) { //top
		stroke(245, 41, 143);
		line(100, 100, i, 0);
		i += 10;
	}

	for (var j = 0; j <300; j++) { //left
		stroke(245, 41, 143);
		line(100, 100, 0, j);
		j += 10;
	}

	for (var k = 0; k<300; k++) { //right
		stroke(245, 41, 143);
		line(300, 200, width, k);
		k += 10;
	}

	for (var m = 0; m<400; m++) { //bottom
		stroke(245, 41, 143);
		line(300, 200, m, height);
		m += 10;
	}

// the yellow hourglass
	for (var n = 0; n<400; n++) { //bottom
		stroke(255, 249, 57);
		line(width/2, height/2, n, height);
		n += 10;
	}

	for (var n = 0; n<400; n++) { //top
		stroke(255, 249, 57);
		line(width/2, height/2, n, 0);
		n += 10;
	}

// the concentric circles
	for (var c = 10; c<155; c++) {
		stroke(245, 41, 143);
		noFill();
		ellipse(width/2, height/2, c, c);
		c += 5;
	}

}

I was inspired by the Japanese zen garden and wanted to use a bunch of colors that contrast with each other. Making the background was the hardest part of this project because it’s tricky to make everything align. Overall, this project reinforces my skills of using for loops.

Sophie Chen – Looking Outwards – 04

Ryoji Ikeda – Data.path

video documentation of data.path installation in Madrid.

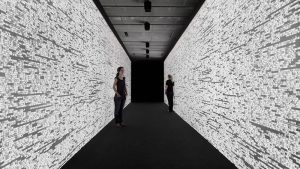
As a video & media design major, I’ve always been interested in the relationship between audio and visuals, as the relationship between the two is integral to each other’s existence and they inevitably affect how the other is perceived. Ryoji Ikeda is a Japanese artist whose creations’ embodies what audio and visual working together are like. Data.path is one of his pieces that combines video projections and the architectural environment through which the viewers move. His moving images are created using data such as computer codes, molecular structures, astronomical coordinates, etc that are synchronized with the audio, and projected on walls 20 meters long. I find his synchronization of audio and visual, digital generation of the visual content, and use of scale to immerse the audience into this synchronization to be very inspiring as it shows the power that audio-visual data has.

Ryoji Ikeda – data.path

Katherine Hua – Project 04 – String Art

sketch

function setup() {
    createCanvas(400, 300);

}

function draw() {
	background(0);

	//creating variables for starting point of lines (indicated by 1) and the ending points of the line (indicated by 2)
    var x1;
    var y1;
    var x2;
    var y2;

    //creating the two circles in the center
    noStroke();
    fill(232, 140, 114);
    ellipse(175, 125, 90, 90) //orange circle

	//creating the black lines going through the orange circle
	x1 = 70 
	y1 = 85;
	x2 = 200;
	y2 = 85

	strokeWeight(6);
	stroke(0);
	for (i = 1; i < 10; i++) {
		line(x1, y1, x2, y2);
		y1 += 10 //the height of starting point is moving down
		y2 += 10 //height of the ending point is moving down as well
		x2 -= 10 // line is getting shorter with each iteration
	}

	noStroke(); 
	fill(200, 42, 35);
	ellipse(200, 150, 75, 75); // red circle

	// creating the white lines crossing through the center
	strokeWeight(1);
    stroke(255, 255, 255);
    x1 = 0;
    y1 = 0;
    x2 = 400;
    y2 = 300;
    for (i = 0; i < 41; i ++) {
		line(x1, y1, x2, y2);
		x1 += 10;
		x2 -= 10;
	}

	//pink
    stroke(246, 159, 255);
    x1 = 400
	y1 = 0
	x2 = 0
	y2 = 0
	for (i = 0; i < 81; i ++) {
		line(x1, y1, x2, y2);
		x1 -= 5;
		y2 += 5;
	}
	//green
	stroke(27,178, 141);
	x1 = 400;
	y1 = 0;
	x2 = 400;
	y2 = 300;
	for (i = 0; i < 81; i ++) {
		line(x1, y1, x2, y2);
		y1 += 5;
		x2 -= 5;
	}
	//yellow
	stroke(232, 214, 114);
	x1 = 0;
	y1 = 0;
	x2 = 0;
	y2 = 300;
	for (i = 0; i < 81; i ++) {
		line(x1, y1, x2, y2);
		y1 += 5;
		x2 += 5;
	}
	//blue
	stroke(150, 173, 255);
	x1 = 400
	y1 = 300
	x2 = 400
	y2 = 0
	for (i = 0; i < 81; i ++) {
		line(x1, y1, x2, y2);
		y1 -= 5;
		x2 -= 5;
	}


}

I wanted to create an abstract version of the sunsets I often see back home in LA. Because of the pollution that surrounds the city, the sunsets that overlooks the city is very colorful.

Kai Zhang-Looking Outwards-04

A 4G Network Turned into Music

Project by – Andrius Šarapovas, Technarium.

Commissioned by – Tele2.

Video by – Some Films

This is an installation that uses algorithm to turn one second of browsing on the 4G network into one second of music. The number of connections to the network in different regions of Lithuania controls the volume of the notes being played and their rhythmic distribution, while the amount of data transferred during those sessions determines the notes’ pitches.

The walk-in kinetic sound installation consists of 77 segments distributed throughout the exhibition space. Each segment has a metal bar, a sound activator, a sound damper, a resonator, and mechatronics. The distribution of the segments in space forms 4 narrow and 11 wide directions of movement. The number of segments and their positions were in part determined by the spatial and acoustic characteristics of the exhibition space. The sound range of the installation consists of 4 notes in 4 octaves where a specific note is assigned to the North, the South, the East and West of Lithuania.

What amazed me about this project is how it embraced the coldness of technology and turned it into something warm. From the sound generated, I can hear how the everlasting signals are transfered through the globe, though it’s merely taking a piece of sample from it. The tuning of algorithm and tones is rather elegant and pleasing to listen to. The listeners could also sense the richness of the patterns of data that’s been carried into this room.

Another thing to give the creator credit is their ability to deal with space. It’s a farily large space with echos. The creators took advantage of the charcteristics of it can use it as a perfect stage for the music piece. And the sound wanders around for an extended piece of time to give people a sense of tranqility. When you’re walking in the matrix of sound machines, it’s almost like you’re touching the music, and the information lies beyond that. The installation carefully used materials that matches the flow of the tones. The instrument components are exposed and showcasing its fine details and simplicity, which adds to the overall experience for the audience.


“Statistics reduces the studied object into a few, several or a dozen features. This is a paradoxical trait of statistics – investigating the variability of an object it actually produces immutable characteristics, monitoring the differences, it observes repetitions. The average, however, is not reality, but rather a color that is the result of mixed different tints. The height or weight gets summed, but the noise, the smell or shadows are lost. Statistics draw the map of reality, making it two-dimensional. The effect of music is directly contrary.”

— Andrius Šarapovas


Andrius Šarapovas 07.jpeg

Andrius Šarapovas 04.jpeg

Andrius Šarapovas 05.jpeg

https://courses.ideate.cmu.edu/15-104/f2018/wp-admin/post-new.php

Alexandra Kaplan – Project 04 – String Art

sketch.js

    //variables of x and y placement of lines, to be changed under 
    //each for() statment

    var x1;
    var y1;
    var x2;
    var y2;


function setup() {
    createCanvas(400, 300);
}

function draw() {   
    background(100, 100, 130);

    // eye pupil
    strokeWeight(0);
    fill(40);
    ellipse(width / 2 - 5, 215, 60, 60); 

    // eye highlight
    fill(200);
    ellipse(width / 2 + 10, 205, 15, 15);

    // top lid
    for( var g2 = 1; g2 < width; g2 += 5){ // group 2 lines
        push();
        stroke(155, 150, 195);
        strokeWeight(1);
        translate(20, -80);
        rotate(radians(14));
        x1 = 0;
        y1 = width - g2;
        x2 = height + g2;
        y2 = g2;
        line(x1, y1, x2, y2);
        pop();
    }

    // bottom lid
    for( var g1 = 1; g1 < width; g1 += 5){ // group 1 lines
        push();
        stroke(185, 180, 225);
        strokeWeight(.5);
        translate(40, height/2 - 30);
        rotate(radians(2));
        x1 = 0;
        y1 = height - g1;
        x2 = width - g1;
        y2 = g1 ;
        line(x1, y1, x2, y2);
        pop();
    }

    // top 
    for( var g3 = 40; g3 < width; g3 += 5){ // group 3 lines 
        push();
        stroke(195, 190, 235);
        strokeWeight(1);
        translate(10, -100);
        rotate(radians(14));
        x1 = 0;
        y1 = width - g3;
        x2 = height + g3;
        y2 = g3;
        line(x1, y1, x2, y2);
        pop();
    }

    // head
    for( var g4 = .5; g4 < width; g4 += 5){ //group 4 lines
        push();
        stroke(90, 70, 130);
        strokeWeight(2);
        translate(-170, -60);
        rotate(radians(-25));
        x1 = 20;
        y1 = width - g4;
        x2 = height + g4;
        y2 = g4;
        line(x1, y1, x2, y2);
        pop();
    }
  
}


This project was a bit difficult to wrap my head around, especially how the for() loops affected the line positions.  I enjoyed manipulating the different parameters and seeing the various lines and arcs that could be created. My process was more one of discovery, as I played with the parameters to find inspiration. Once I had an idea,  I went on from there to try and get more specific in what I wanted to achieve.