Emily Zhou –– Final Project

Hi there, my final project is 900 x 450 px but WordPress cuts it off at 600 px width so here is the zip file to see the full thing: moon-exp.zip

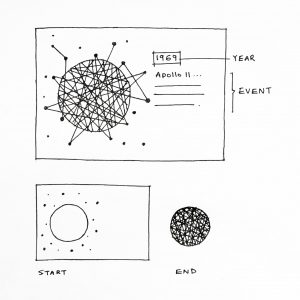
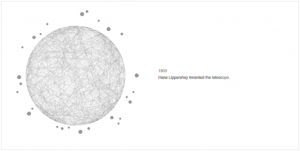
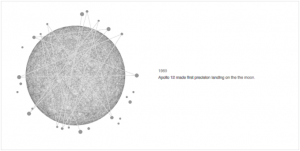
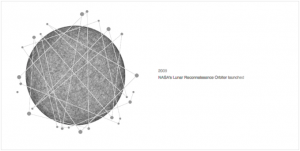
Instructions: Click the stars to traverse the timeline of humanity’s exploration of the moon.

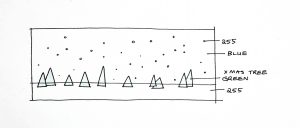
Details: Each click should reveal a key event in moon exploration in chronological order. The representation of the moon should slowly fill as time passes. After revealing all 26 events, the stars should be connected as one single constellation.

final project

var starX = [245, 260, 295, 325, 325, 365, 410, 400, 380, 390, 360, 355, 335, 
             265, 240, 205, 185, 170, 85, 95, 50, 60, 55, 65, 100, 120, 140];
var starY = [40, 32, 60, 85, 85, 100, 225, 275, 290, 305, 355, 370, 352, 385, 
             395, 382, 385, 380, 340, 325, 275, 250, 230, 140, 110, 100, 70];
var starD = [10, 6, 4, 10, 10, 6, 10, 4, 5, 8, 5, 4, 8, 6, 
             10, 4, 6, 5, 10, 5, 4, 6, 10, 5, 8, 4, 5];
var time = ["1609", "1610", "1610", "1645", "1647", "1651", "1753", "1824", "1920", "1959", 
            "1961", "1964", "1966", "1967", "1968", "1969", "1969", "1972", "1976", 
            "1990", "1994", "1998", "2007", "2007", "2008", "2009"];
var data = ["Hans Lippershey invented the telescope.",
            "Galileo Galilei made the first telescopic observation of the moon.",
            "Thomas Harriot and Galileo Galilei drew the first telescopic representation of the moon.",
            "Michael Florent van Langren made the first map of the moon.",
            "Johannes Hevelius published the first treatise devoted to the moon.",
            "Giovanni Battista Riccioli named craters after philosophers and astronomers.",
            "Roger Joseph Boscovich proved the moon has no atmosphere.",
            "Franz von Gruithuisen thought craters were formed by meteor strikes.",
            "Robert Goddard suggested sending rockets to the moon.",
            "Soviet spacecraft Luna 2 reached the moon, impacting near the crater Autolycus.",
            "President John F. Kennedy proposed a manned lunar program.",
            "NASA's Ranger 7 produced the first close-up TV pictures of the lunar surface.",
            "Soviet spacecraft Luna 9 made the first soft landing on the moon.",
            "NASA's Lunar Orbiter missions completed photographic mapping of the moon.",
            "NASA's Apollo 8 made the first manned flight to the moon, circling it 10 times before returning to Earth.",
            "Apollo 11 mission made the first landing on the moon and returned samples.",
            "Apollo 12 made first precision landing on the the moon.",
            "Apollo 17 made the last manned landing of the Apollo Program.",
            "Soviet Luna 24 returned the last sample to be returned from the moon (to date).",
            "NASA's Galileo spacecraft obtained multispectral images of the western limb and part of the far side of the moon.",
            "NASA's Clementine mission conducted multispectral mapping of the moon.",
            "NASA's Lunar Prospector mission launched.",
            "Japanese SELENE (Kaguya) spacecraft launched.",
            "Chinese Chang'e 1 lunar orbiter launched.",
            "Indian Chandrayaan 1 moon orbiter launched.",
            "NASA's Lunar Reconnaissance Orbiter launched"]
var newData = [];
var newTime = [];

var speed = 100; // typing speed
var maxCharacters = 65; // max characters per line
var spacing = 15; // spacing between lines
var clicks = 0; // click count
var next = 0; // to evaluate when next star is clicked

var starClickIndices = []; // index values of clicked stars
var clear1 = []; // stores handles for text either appearing or intercepting
var clear2 = []; // stores handles for text either appearing or intercepting
var toClearOne = true; // used to differentiate between clear1 and clear2

function setup() {
    createCanvas(900, 450);
    background(255, 255, 255);

    // to match time to new data array
    for (var i = 0; i < time.length; i++) {
    	newTime.push([]);
    	newTime[i].push(time[i]);
    }

    // code to split long text lines 
    for (var i = 0; i < data.length; i++) {
    	newData.push([]);
    	var stringStart = 0;
    	var stringEnd = 0;
    	
    	while (stringEnd < data[i].length) {

    		stringEnd += maxCharacters;

    		var trunc = stringEnd; // index of where to truncate
    		while (data[i].substring(trunc - 1, trunc) != " " & 
    				(stringEnd - trunc <= 10)) {
    			trunc--;
    		}

    		if (data[i].substring(trunc - 1, trunc) == " ") {
    			newData[i].push(data[i].substring(stringStart, trunc));
    			stringStart = trunc;
    			stringEnd = trunc;
    		}
    		else {
    			newData[i].push(data[i].substring(stringStart, stringEnd));
    			stringStart = stringEnd;
    		}
    	}
    }

    // frame
    noFill();
    stroke(220);
    rect(0, 0, width - 1, height - 1);
}

function draw() {
    // moon
    moonChord();

    // constellation lines
    for (var i = 1; i < starClickIndices.length; i++) {
        stroke(220);
        strokeWeight(0.5);
        line(starX[starClickIndices[i]], starY[starClickIndices[i]], 
        	starX[starClickIndices[i - 1]], starY[starClickIndices[i - 1]]);
    }

    if (next != clicks) {

        // erase text
        fill(255);
        noStroke();
        rect(450, 170, 425, 125);

        // code to type text
        if (toClearOne) {
        	for (var i = clear1.length - 1; i >= 0; i--) {
        		clearTimeout(clear1[i]);
        		clear1.pop(i);
        	}
        }
        else {
        	for (var i = clear2.length - 1; i >= 0; i--) {
        		clearTimeout(clear2[i]);
        		clear2.pop(i);
        	}
        }

        toClearOne = ! toClearOne;

	    fill(220);
	    noStroke();

	    if (toClearOne) {
	        typeWriter(newTime[next], 0, 0, 475, 215, clear1);
	        typeWriter(newData[next], 0, 0, 475, 235, clear1);
	    }
	    else {
	        typeWriter(newTime[next], 0, 0, 475, 215, clear2);
	        typeWriter(newData[next], 0, 0, 475, 235, clear2);

	    }
    }

    // stars
    stroke(150);
    fill(150);
    for (i = 0; i < 27; i++) {
        ellipse(starX[i], starY[i], starD[i], starD[i],)
    }

    next = clicks;
}

function mousePressed() {
    for (var i = 0; i < 27; i++) {
        var distance = dist(mouseX, mouseY, starX[i], starY[i]);
        if (distance <= starD[i] / 2 + 2) {

        	var unclicked = true;
        	for (var j = 0; j < starClickIndices.length; j++) {
        		if (starClickIndices[j] == i) unclicked = false;
        	}

        	if (unclicked) {
	            starClickIndices.push(i);
	            clicks++;
	            if (clicks >= data.length) clicks = 0;
	            curStarIndex = i;
	        }
        }
    }
}

// typewriter effect to print text
function typeWriter(info, r, c, x, y, clear) {
    if (r < (info.length)) {

    	c++;
    	if (c > info[r].length) {
    		c = 1;
    		r++;
    	}

        if (r < info.length) {
	        noStroke();
	        textSize(12);
	        text(info[r].substring(0, c), 
	            x, y + (r * spacing));

	        var handle = setTimeout(function() {
		          typeWriter(info, r, c, x, y, clear)
		        }, speed)
	        clear.push(handle);
	    }

    }
}

// continuously draw chords fill moon
function moonChord() {
    stroke(0, 0, 0, 15);

    var angle1 = random(0, 2 * PI);
    var px1 = 225 + 150 * cos(angle1);
    var py1 = 225 + 150 * sin(angle1);

    var angle2 = random(0, 2 * PI);
    var px2 = 225 + 150 * cos(angle2);
    var py2 = 225 + 150 * sin(angle2);

    line(px1, py1, px2, py2);
}

Progression:

Reflection: The hardest part was getting the typewriter text to print like I wanted and coordinating all of the different actions to the mouse click.

Sources:
The representation of the moon was inspired by this example on p5js.org:
https://p5js.org/examples/math-random-chords.html
I referenced this code as a starting point for developing the typewriter text:
https://gist.github.com/mjvo/2dce29799eb75b7ee1a571380f12ef1b

Emily Zhou –– Final Project Proposal

My plan for the final project is to create an interactive software that guides the user through the timeline of humanity’s exploration of the moon.

The canvas would start with a white circle that represents the moon and smaller circles surrounding it that represent stars. Each of the stars serves as a milestone in moon exploration. I plan to include 20-25 events from a source at space.com.

When the user clicks a star, the year and description text of the first event will appear to the right. Some amount of random chords will also appear on the moon. When the user clicks another star, the first star will be connected by a line, the second event will be displayed, and more chords will randomly appear on the moon. At the end of the timeline, the moon will appear grey and spherical as a result of overlapping chords and all the stars will be connected.

quick sketch of plan

Emily Zhou – Looking Outwards – 12

Two projects that I find interesting and are coincidentally somewhat related in subject matter are Step Up To It by Red Paper Heart and Cotton Candy Theremin by StewardessLollipop.

Step Up To it is an installation piece made of sugar cubes. Hundreds of sugar cubes were glued to spell the words “STEP UP TO IT”. When the viewer smiles, a projection causes the sugar cubes to light up in bright colours.


Step Up To It video explanation.

Cotton Candy Theremin is a cotton candy spinning performance. It uses the process of making cotton candy as an interface of sight, sound, smell, touch and taste. The audience can trigger sounds and visuals by spinning a cotton candy cone over wisps of candy floss.


Cotton Candy Theremin documentation and interviews.

Both projects use physical materials (both sweets) combined with technology and computing to create an interactive and immersive experience. I admire the fact that both projects require viewer/audience efforts to come to life. I want to incorporate a similar level of fun and engagement in my final project.

Emily Zhou –– Composition

tortle

var ttl;

function setup() {
    createCanvas(400, 400);
}

function coolShape(ttl) {
    var count = 100;
    for (var i = 0; i < width; i++) {
        ttl.forward(10);
        var mx = map(mouseX, 50, 400, 200, 400);
        ttl.left(mx * 0.01 * sin(radians(i)));
        count += 1;
    }
}

function draw() {
    background("Lavender");
    for (var i = 0; i < 20; i++) {
        ttl = makeTurtle(width / 2, height / 2);
        ttl.left((360 / 20) * i);
        ttl.penDown();
        var R = map(mouseX, 0, width, 200, 255);
        ttl.setColor(color(R, 255, 255));
        ttl.setWeight(3);
        coolShape(ttl);
    }
}

//////////////////////////////


function turtleLeft(d){this.angle-=d;}function turtleRight(d){this.angle+=d;}
function turtleForward(p){var rad=radians(this.angle);var newx=this.x+cos(rad)*p;
var newy=this.y+sin(rad)*p;this.goto(newx,newy);}function turtleBack(p){
this.forward(-p);}function turtlePenDown(){this.penIsDown=true;}
function turtlePenUp(){this.penIsDown = false;}function turtleGoTo(x,y){
if(this.penIsDown){stroke(this.color);strokeWeight(this.weight);
line(this.x,this.y,x,y);}this.x = x;this.y = y;}function turtleDistTo(x,y){
return sqrt(sq(this.x-x)+sq(this.y-y));}function turtleAngleTo(x,y){
var absAngle=degrees(atan2(y-this.y,x-this.x));
var angle=((absAngle-this.angle)+360)%360.0;return angle;}
function turtleTurnToward(x,y,d){var angle = this.angleTo(x,y);if(angle< 180){
this.angle+=d;}else{this.angle-=d;}}function turtleSetColor(c){this.color=c;}
function turtleSetWeight(w){this.weight=w;}function turtleFace(angle){
this.angle = angle;}function makeTurtle(tx,ty){var turtle={x:tx,y:ty,
angle:0.0,penIsDown:true,color:color(128),weight:1,left:turtleLeft,
right:turtleRight,forward:turtleForward, back:turtleBack,penDown:turtlePenDown,
penUp:turtlePenUp,goto:turtleGoTo, angleto:turtleAngleTo,
turnToward:turtleTurnToward,distanceTo:turtleDistTo, angleTo:turtleAngleTo,
setColor:turtleSetColor, setWeight:turtleSetWeight,face:turtleFace};
return turtle;}

I wanted to use turtle graphics to create an interesting line composition that interacts with the mouse based on shape and colour. I had fun experimenting with slight differences in numerical values that drastically changed the result.

Screenshots of the composition at varying mouse positions:

Emily Zhou – Looking Outwards – 11

Orbiter is an interactive sound environment designed by FIELD studio. It is an installation that invites visitors to lie down and observe a representation of stars from below. By pointing upward, visitors can insert new stars into orbit with unique visual and sound qualities.


Orbiter: Interactive Sound Environment / Documentation

The music is played on a scale of concentric circles. The bigger you let a star grow before you pull back your hand to insert it into orbit, the louder it plays. In terms of computation, the software is based on computer vision technology. The software used incorporates real-time analysis of a camera image of the player as well as generating 6-channel-audio and video signals. I admire the interactive quality of both sound and visuals in the work. I imagine it to be an immersive experience for the viewer.

Emily Zhou –– Landscape

winter

// assignment 10 sample code referenced for trees
// source: https://courses.ideate.cmu.edu/15-104/f2018/week-10-due-nov-4/#landscape

// p5.js.org example referenced for snowflakes
// source: https://p5js.org/examples/simulate-snowflakes.html

var trees = [];
var snowflakes = [];

function setup() {
    createCanvas(480, 200); 
    
    for (var i = 0; i < 10; i++){
        var rx = random(width);
        trees[i] = makeTree(rx);
    }
    frameRate(15);
}


function draw() {
    background(80, 100, 150); 
    
    displayGround();

    // trees
    updateCanvas();
    eraseOld();
    addNew(); 

    // snowflakes
    let t = frameCount / 60;

    for (var i = 0; i < random(5); i++) {
    snowflakes.push(new snowflake());
    }

    for (let flake of snowflakes) {
    flake.update(t);
    flake.display();
    }
}

// tree functions

function updateCanvas(){
    for (var i = 0; i < trees.length; i++){
        trees[i].move();
        trees[i].display();
    }
}

function eraseOld(){
    var treesToKeep = [];
    for (var i = 0; i < trees.length; i++){
        if (trees[i].x + trees[i].width > 0) {
            treesToKeep.push(trees[i]);
        }
    }
    trees = treesToKeep;
}

function addNew() {
    var newTreeLikelihood = 0.02; 
    if (random(0,1) < newTreeLikelihood) {
        trees.push(makeTree(width));
    }
}

function treeMove() {
    this.x += this.speed;
}

function treeDisplay() {
    var treeH = this.height; 
    fill(10, 60, 20); 
    noStroke();
    push();
    translate(this.x, height - 40);
    triangle(0, treeH - 17, this.width, treeH - 17, this.width / 2, -treeH - 17);
    pop();
}

function makeTree(birthLocationX) {
    var tr = {x: birthLocationX,
                width: random(10, 20),
                speed: -1.0,
                height: random(10, 20),
                move: treeMove,
                display: treeDisplay}
    return tr;
}

function displayGround(){
    fill(255);
    noStroke();
    rect(0, height - 50, width, 50);

    // frame
    stroke(200);
    noFill();
    rect(0, 0, width - 1, height - 1);
}

// snowflakes

function snowflake() {
  this.posX = 0;
  this.posY = random(-50, 0);
  this.initialangle = random(0, 2 * PI);
  this.size = random(1, 3);

  this.radius = sqrt(random(pow(width / 2, 2)));

  this.update = function(time) {
    let w = 0.6;
    let angle = w * time + this.initialangle;
    this.posX = width / 2 + this.radius * sin(angle);

    this.posY += pow(this.size, 0.5);

    if (this.posY > height) {
      let index = snowflakes.indexOf(this);
      snowflakes.splice(index, 1);
    }
  }

  this.display = function() {
    fill(255);
    noStroke();
    ellipse(this.posX, this.posY, this.size);
  }
}

It snowed in my hometown this past week so I was inspired to do a snowy winter landscape.

Idea sketch.

I started with a blue sky and white ground. Then, I referenced the buildings sample code to generate trees of different height and width triangles. Finally, I looked on the p5.js website to find an example showing how to make falling snowflakes (source: https://p5js.org/examples/simulate-snowflakes.html). I studied the code and adapted it to my landscape which required smaller snowflake particles.

I am really happy with the end result and it reminds me a lot of what Ottawa looks like in the winter. Also, I had some trouble understanding the lectures on particles last week so studying and learning from the snowflake example really helped.

Emily Zhou – Looking Outwards – 10

Sputniko! is a Japanese/British artist and MIT Media Lab Assistant Professor who is known for tech-inspired film and multi-media installation works. She studied Mathematics and Computer Science at Imperial College, London, and continued to pursue a Masters in Design at the Royal College of Art. Her project, Tranceflora – Amy’s Glowing Silk (2015) is an exhibition piece in the Gucci Gallery, Tokyo.

Motion photograph capturing fluorescent kimono dress.

The exhibit displayed a Nishijin-Kimono dress designed by Sputniko!, that incorporated transgenic glowing silk. The silk was created by injecting the genes of a glowing coral and jellyfish into silkworm eggs. The dress was showcased around a large-scale installation of 3000 transgenic silkworm cocoons.


Video documentation of exhibition view.

I admire her work in combining art and technology in a way that can be shared with many people. The exhibition attracted 10000 visitors in 3 weeks and can be appreciated across cultures.

Emily Zhou –– Portrait

click the pickle to begin.

var img;
var pickle;
var pickleX;
var pickleY;
var runDraw = false;

function preload() {
    img = loadImage("https://i.imgur.com/ZZ3qlai.jpg");
    pickle = loadImage("https://i.imgur.com/EHVwUGX.png");
}

function setup() {
    createCanvas(480, 320);
    imageMode(CENTER);
    strokeWeight(5);
    background(255);
    img.loadPixels();

    pickleX = width / 2;
    pickleY = height / 2;
    image(pickle, pickleX, pickleY);
}

function draw() {
    if (runDraw) {
        var x = floor(random(img.width));
        var y = floor(random(img.height));
        var col = img.get(x, y);
        fill(col, 128);
        text("pickle", x, y);
    }
}

function mousePressed() {
    if (dist(mouseX, mouseY, pickleX, pickleY) < 50) {
        background(255);
        runDraw = true;
    }
}

The original photo.
Pickle text rendering.

The original photo shows my friend Sebastian standing in front of the pickle shelf at Giant Eagle. I went off the pickle theme and implemented a pickle button to begin the rendering of the image in text “pickle”. Lot of pickles.

Emily Zhou – Looking Outwards – 09

This week, I looked at a MIT Media Lab project on voxel-printing for digital fabrication that was originally reviewed here by Julie Choi.

Reconstructed living human lung tissue on a microfluidic device.

A voxel represents a value on a regular grid in three-dimensional space. Given that understanding, I am fascinated by how this unit can be used to create sculptural works of art. I agree that the most interesting part lies in the data focused physical visualization. I think that the artistic decisions in coordinating colours, as well as selecting a topic of data largely contributes to the beauty of each final piece.

Close-up of data physicalization of the human brain; visualizes bundles of axons.

On the technical side, the program repurposes a multimaterial voxel-printing method that is most often associated with scientific imaging. I find this to be an extremely innovative way to derive new artistic modes. As mentioned in the original review, MIT Media Lab is focusing on advancing 3D printing technology so no titles are given to the works. But, I hope the see this style of media make its way into the art world.

Emily Zhou – Looking Outwards – 08

Adam Harvey is an artist and researcher based in Berlin. His works focuses on the societal impacts of networked data analysis technologies and computer vision and counter-surveillance in particular. Adam graduated from the Interactive Telecommunications Program at New York University (2010) and previously studied engineering and photojournalism at the Pennsylvania State University.


The Electromagnet Spectrum of Counter/Surveillance – Adam Harvey, Eyeo 2014

Being a strong advocate of privacy and freedom of expression, his body of work is mainly comprised of various soft and hard counter-surveillance technologies. My favourite project of his is the Privacy Gift Shop––a pop-up store at the New Museum that sells counter-surveillance items developed by Harvey. A product example is the OFF Pocket––a faraday cage phone case that blocks all wireless signals (e.g. tracking, eavesdropping) from reaching your phone. I admire this project because he brings technological social concerns to the forefront in a creative and engaging way.

OFF Pocket V1

In his talk, Adam begins by defining the terms “surveillance” and “privacy”. He shows examples of their importance and scope of impact. I think this was extremely powerful in framing the rest of his talk, especially when it came to his own work and contributions in pro-privacy and anti-surveillance.