Emily Zhou –– Curves

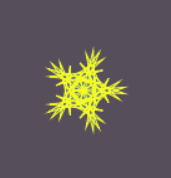
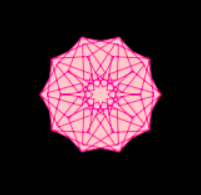
tron ninja star

// Epitrochoid:
// http://mathworld.wolfram.com/Epitrochoid.html

function setup() {
    createCanvas(300, 300);
}

function draw() {
    background(0);
    push();
    translate(width / 2, height / 2);
    drawEpitrochoid1();
    drawEpitrochoid2();
    pop();
}

function drawEpitrochoid1() {
    var x;
    var y;
    // constrain mouseX to canvas width
    var mX = constrain(mouseX, 0, width);
    var a = mX / 5; // size of centre circle
    var b = mX / 100; // size of revolving pattern
    var h = b + 20; // height of revolving pattern
    // epitrochoid
    stroke(246, 76, 114);
    fill(47, 47, 162);
    beginShape();
    for (var t = 0; t < 360; t++) {
        x = (a + b) * cos(radians(t)) - 
             h * cos(radians(((a + b) / b) * t));
        y = (a + b) * sin(radians(t)) - 
             h * sin(radians(((a + b) / b) * t));
        vertex(x, y);
        t += 7;
    }
    endShape(CLOSE);
}

function drawEpitrochoid2() {
    var x;
    var y;
    var mX = constrain(mouseX, 0, 300);
    var a = mX / 10;
    var b = mX / 100;
    var h = b + 20;

    stroke(246, 76, 114);
    fill(47, 47, 162);
    beginShape();
    for (var t = 0; t < 360; t++) {
        x = (a + b) * cos(radians(t)) - 
             h * cos(radians(((a + b) / b) * t));
        y = (a + b) * sin(radians(t)) - 
             h * sin(radians(((a + b) / b) * t));
        vertex(x, y);
        t += 1;
    }
    endShape(CLOSE);
}

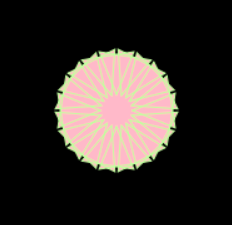
From initially studying the sample code, I noticed that multiple elements (a, b, h, ph) were being related to the mouse or each other. When I began surfing the MathWorld curves site, I searched for curves with equations that used at least three variables. I chose the epitrochoid because I liked its symmetry and the wide range of complexity to be explored in its form.

In constructing the code, I had a lot of fun playing with different value and observing the effect. I mixed relations and added slight changes to the variable values until I was happy with the outcome. I also added a second epitrochoid for an even more complex shape.

Early iterations:
playing with geometry

experimenting with colour
snowflake design

Emily Zhou – Looking Outwards – 07

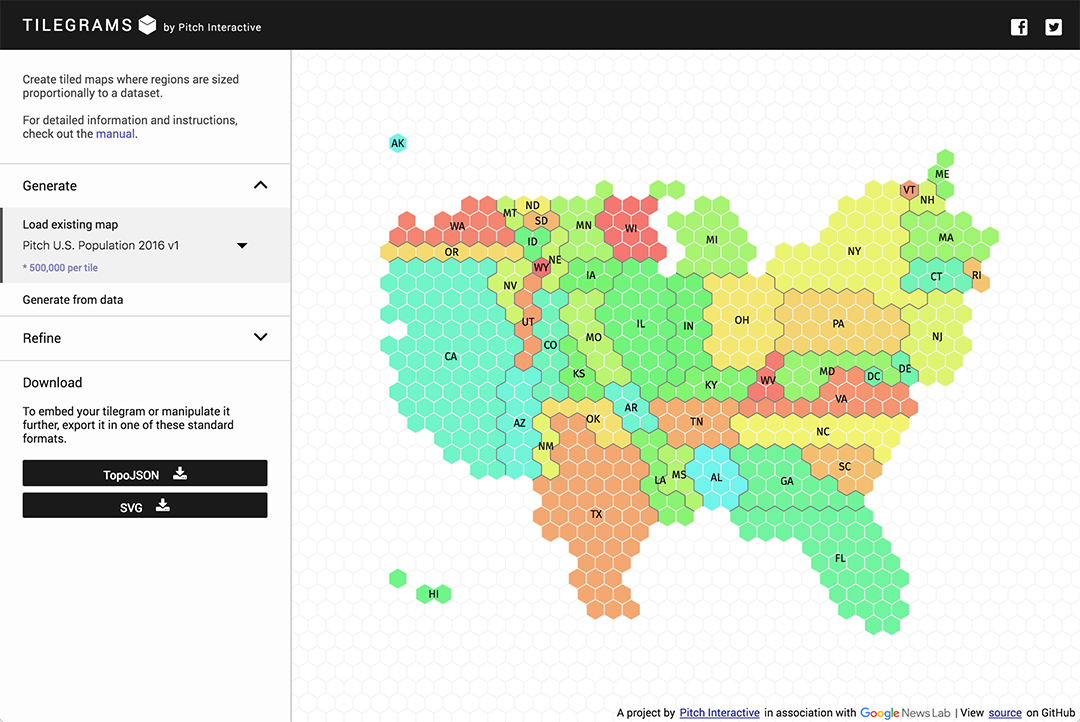
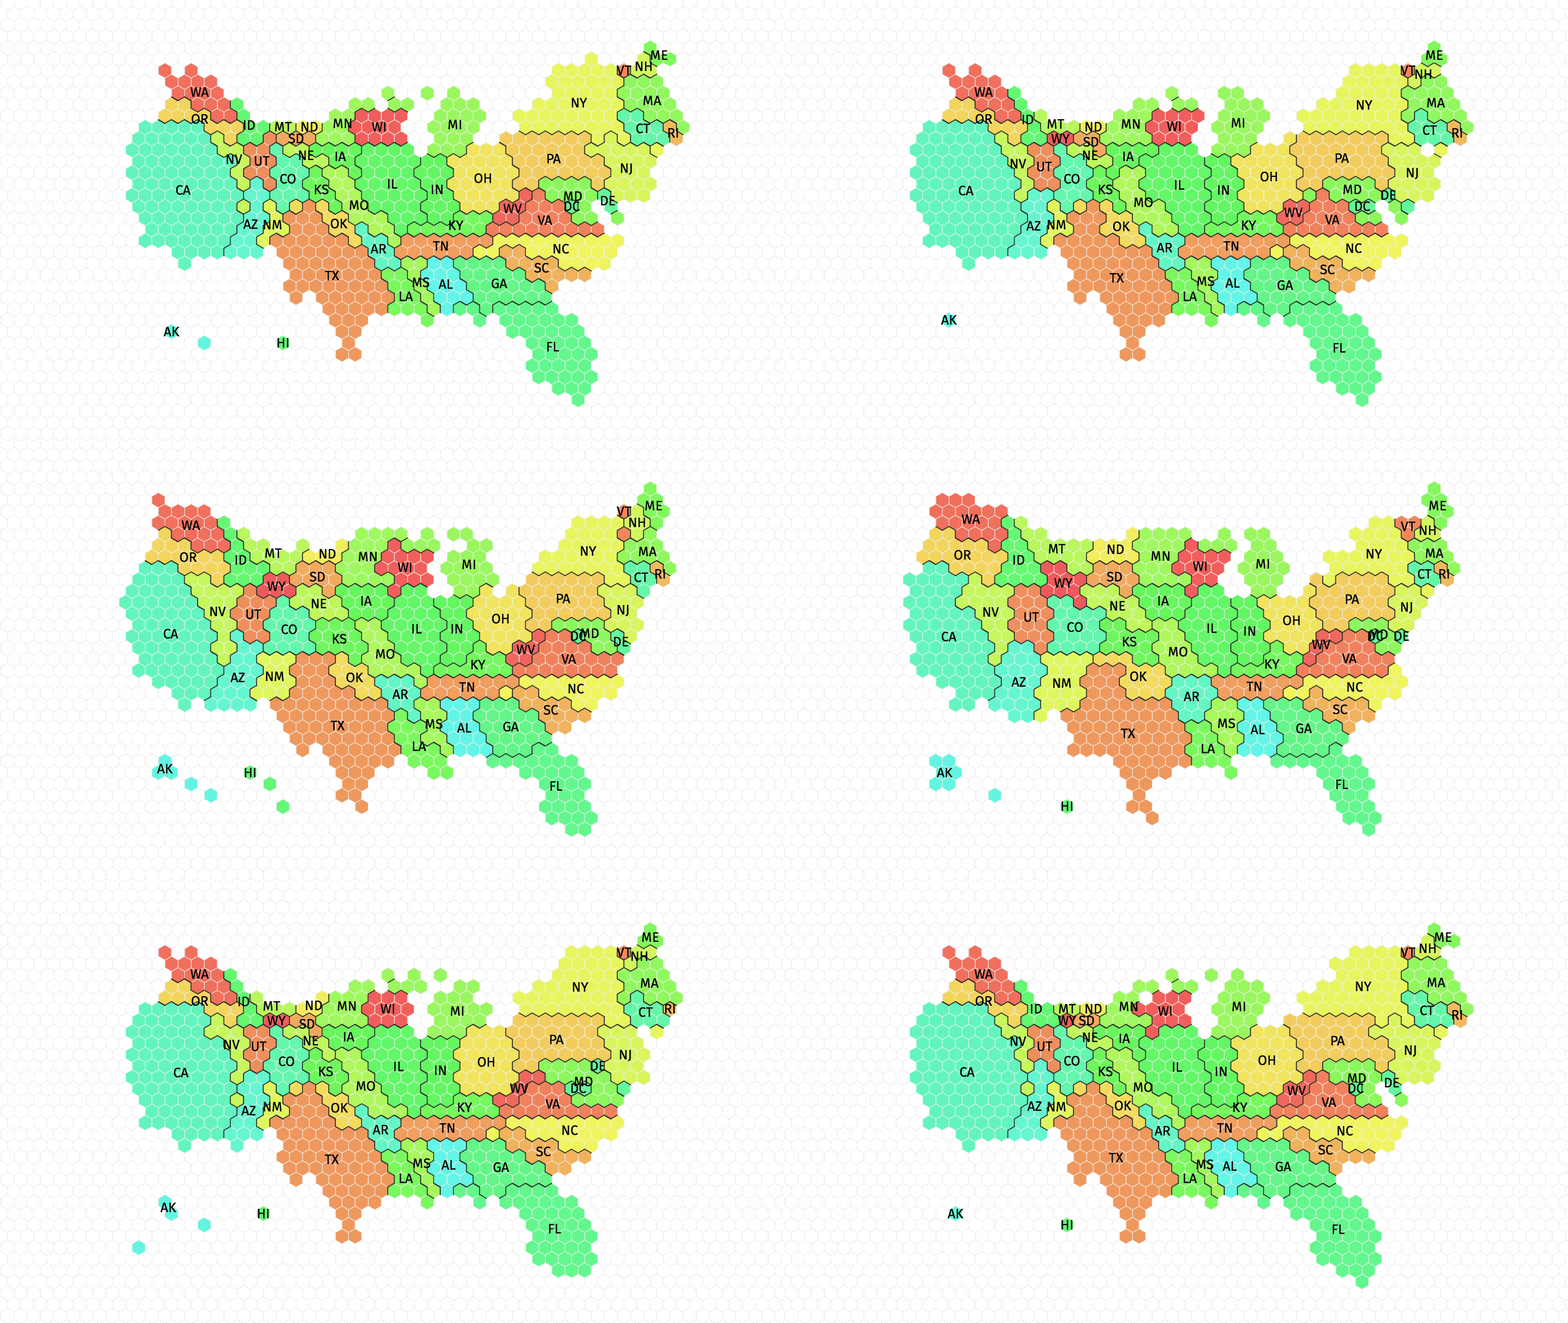
Tilegrams is an open source tool for creating statistically accurate maps. Data-representative tiles are arranged, shuffled, and colour-coordinated to visualize data.

US state map based on 2015 population data.

The Pitch Interactive team, led by Wes Grubbs, designed Tilegrams to employ a cartogram algorithm that balances geographic resemblance with statistical accuracy. The tool ingests a state-level dataset in order to output a cartogram which is them sampled to produce the tile elements––which inspired the name “Tilegrams” from tiled cartograms.

Tilegrams demo, 2016.

Primary design choices were implemented by the creators, allowing for the maps produced by the tool to remain visually consistent. However, drawing tools including drag to move and marquee selection give users the chance to customize and validate information.

I admire the fact that it can take into account a broad scope of data from all different users and produce attractive visualizations in every scenario. Tilegrams is currently being developed to accept beyond country-wide data with the cooperation of Google News Lab.

Emily Zhou –– Abstract Clock

dots clock

function setup() {
    createCanvas(480, 100);
    stroke(17, 21, 28);
}

function draw() {
    // background colour
    var H = hour();
    if (H >= 7 & H <= 19) {
        background(228, 246, 248); // day background
        stroke(228, 246, 248);
    }
    else {
        background(17, 21, 28); // night background
        stroke(17, 21, 28);
    }
    // hour circles
    var d1 = width / 24; // diameter (L)
    for (var i = 0; i < 24; i++) { // 24 hours
        var hx = i * d1 + d1 / 2; // x position
        if (H >= 7 & H <= 19) { // day circle colour
            // top edge
            if (H - 1 == i) {
                fill(98, 194, 204);
                ellipse(hx, height - d1 / 2, d1, d1);
            }
            // bottom edge
            else {
                fill(98, 194, 204);
                ellipse(hx, d1 / 2, d1, d1);
            }
        }
        else { // night circle colour
            if (H - 1 == i) {
                fill(48, 72, 120);
                ellipse(hx, height - d1 / 2, d1, d1);
            }
            // bottom edge
            else {
                fill(48, 72, 120);
                ellipse(hx, d1 / 2, d1, d1);
            }
        }
    }
    // minute circles
    var M = minute();
    var d2 = width / 60; // diameter (M)
    for (var j = 0; j < 60; j++) { // 60 minutes
        var mx = j * d2 + d2 / 2;
        if (H >= 7 & H <= 19) { // day circle colour
            if (M - 1 == j) {
                fill(241, 112, 34);
                ellipse(mx, height - d2 / 2, d2, d2);
            }
            else {
                fill(241, 112, 34);
                ellipse(mx, d1 + d2 / 2, d2, d2);
            }
        }
        else { // night circle colour
            if (M - 1 == j) {
                fill(120, 144, 168);
                ellipse(mx, height - d2 / 2, d2, d2);
            }
            else {
                fill(120, 144, 168);
                ellipse(mx, d1 + d2 / 2, d2, d2);
            }
        }
    }
    // second circles
    var S = second();
    var d3 = width / 60 - 2; // diameter (S)
    var space = 2; // spacing between ellipse centres
    for (var k = 0; k < 60; k++) { // 60 seconds
        var sx = k * d3 + space * k + d3 / 2 + 1;
        if (H >= 7 & H <= 19) { // day circle colour
            if (S - 1 == k) {
                fill(253, 184, 19);
                ellipse(sx, height - d3 / 2, d3, d3);
            }
            else {
                fill(253, 184, 19);
                ellipse(sx, d1 + d2 + d3 / 2, d3, d3);
            }
        }
        else { // night circle colour
            if (S - 1 == k) {
                fill(240, 168, 24);
                ellipse(sx, height - d3 / 2, d3, d3);
            }
            else {
                fill(240, 168, 24);
                ellipse(sx, d1 + d2 + d3 / 2, d3, d3);
            }
        }
    }
}

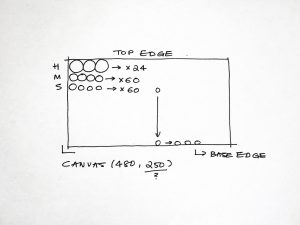
I tried to make a clock that uses the colour and position of graphic elements to indicate the time of day. Three rows of circles that represent the hour, minute, and second appear at the top to their correct quantity (24, 60, 60). For the current time, the corresponding circle appears at the bottom edge of the canvas.

I also wanted the colour scheme of the clock to change with the time of day. I coordinated colours for a day and night setting that change at 7 a.m. and 7 p.m with that range using the daytime colour scheme. I looked up the sunrise and sunset times in Pittsburgh to make sure.

Idea rough sketch

Emily Zhou – Looking Outwards – 06

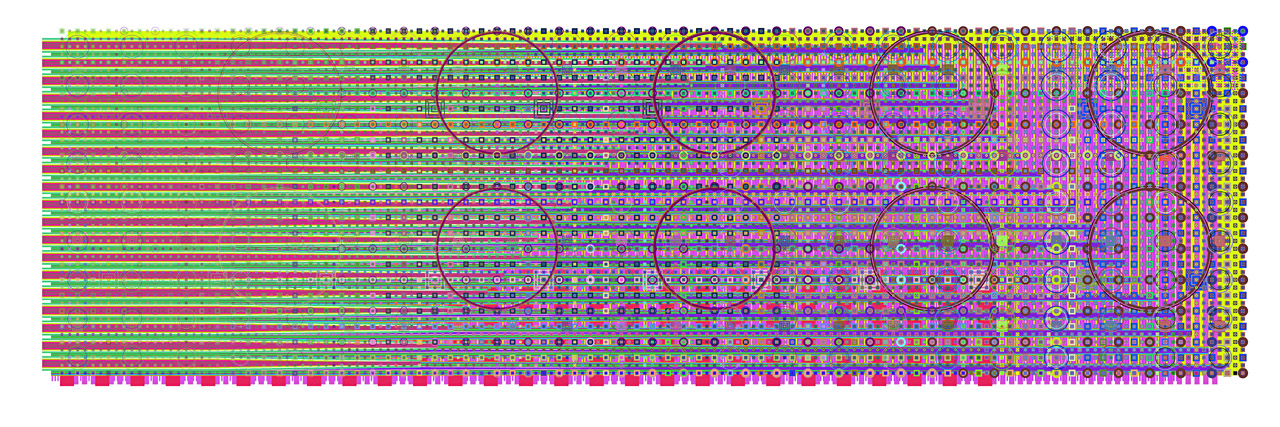
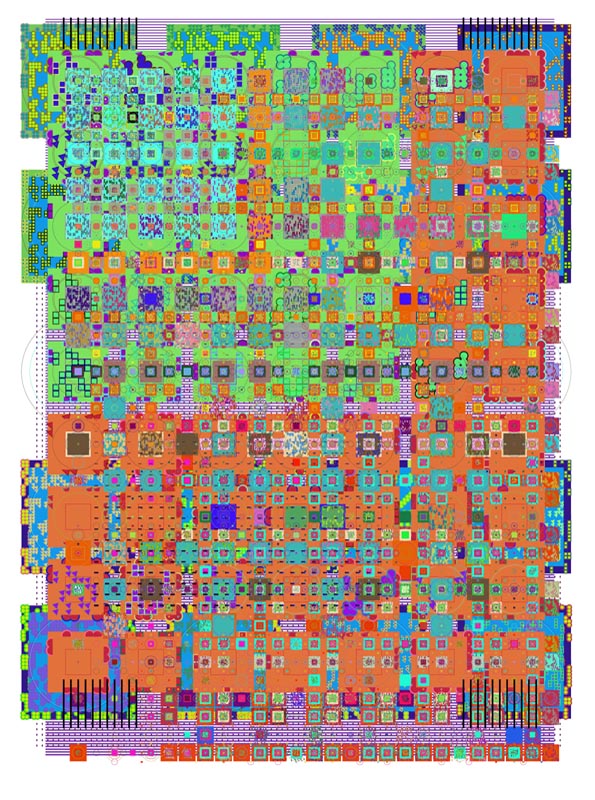
Mark Wilson is a digital artist, painter, and printmaker who began exploring random computational art in 1980. He started on a microcomputer, learning programming in order to create artwork. He essentially writes software that uses calculated repetition to construct intricate layers.

Mark Wilson, “e4708”, 2008 archival ink jet print.

I admire the complexity of his work, and the effectiveness of the algorithm to generate elaborate pieces without becoming overly messy and disorderly. I am fascinated by the way he reproduces a similar style throughout his work, and the implications of this in the program.

Though left unspecified, Wilson leaves certain elements to be randomly chosen by the machine while carefully curating others. I would assume he makes decisions about scale and arrangement, which elements of patterning and colour dependent on random.

Mark Wilson, untitled, 1973 painting.
Mark Wilson, 2018 mural study 5.

Wilson has paintings dating back to 1973 that inspired his digital style that continues to develop in the present year through computation.

Emily Zhou –– Wallpaper

sun & pyramid

var sideL = 80; // side length of each square tile

function setup() {
    createCanvas(400, 480);
}

function draw() {
    // blue background
    background(142, 154, 175);
    // green triangles
    for (var y = 0; y <= height; y += sideL) {
        for (var x = sideL; x <= width; x += sideL) {
             fill(174, 181, 171);
             noStroke();
             triangle(x, y, x - sideL, y + sideL, x, y + sideL);
        }
    }
    // tan triangles
    for (var y = sideL / 2; y <= height; y += sideL) {
        for (var x = sideL / 2; x <= width; x += sideL) {
             fill(229, 211, 197);
             noStroke();
             triangle(x, y, x - sideL / 2, y + sideL / 2, x, y + sideL / 2);
        }
    }
    // orange triangles
    for (var y = sideL / 2; y <= height; y += sideL) {
        for (var x = sideL / 2; x <= width; x += sideL) {
             fill(229, 162, 126);
             noStroke();
             triangle(x, y, x, y + sideL / 2, x + sideL / 2, y + sideL / 2);
        }
    }
    // 3/4 circle
    for (var y = sideL / 2; y <= height; y += sideL) {
        for (var x = sideL / 2; x <= width; x += sideL) {
             fill(237, 238, 192);
             noStroke();
             arc(x, y, sideL / 2, sideL / 2, 3/4 * PI, 1/4 * PI);
        }
    }
    noLoop();
}

My wallpaper is meant to be an abstract representation of the sun rising behind a pyramid. I vaguely remember seeing a wallpaper at a museum that represented the Pyramid of Giza using two like-toned triangles. Starting with that idea, I played around with layers of overlapping shapes and colours.

In the process, I found it much easier to control the shapes’ position after setting a tile length variable. I am happy with the way it turned out using just triangles and one circle per tile. Even though I like the abstraction and simplicity, I’d like to explore more organic forms in future projects.

Emily Zhou – Looking Outwards – 05

Researchers at the University of California San Diego have found a way to improve “all that glitters” in computer graphics.

Algorithm demonstrated on the shell of a snail

The collective outcome is a more eye-catching suit for Iron Man, or a shinier shield for Captain America; but I admire the complex algorithm based on countless individual rays of light. The algorithm more accurately calculates and reproduces the way light interacts with surface details.

Previous computer graphics software have assumed that all surfaces are smooth at the pixel level, which is untrue in real life. This algorithm breaks down each pixel even further into what are called microfacets. The vector that is perpendicular to each microfacet is then computed in relation to the surface material. By combining this information at an approximate normal distribution, the surface is rendered in much higher definition.

I am excited to see this computer graphics software be applied to metal finishes for cars and electronics on HD screens.

Project Lead: Prof. Ravi Ramamoorthi
Article Source: ScienceDaily

Emily Zhou –– String Art

sketch

function setup() {
    createCanvas(400, 300);
}

var ratio = 0.75; // width to height ratio
var radius = 400; // length of radiating center lines

function draw() {
    background(47,19,116);
    // circles:
    // outer circle
    fill(244, 96, 54);
    noStroke();
    ellipse(width / 2, height / 2, 300, 300);
    // middle circle
    fill(245, 110, 72);
    noStroke();
    ellipse(width / 2, height / 2, 150, 150);
    // inner circle
    fill(246, 124, 90);
    noStroke();
    ellipse(width / 2, height / 2, 50, 50);

    // lines:
    // center radial
    for (var a = 0; a < 360; a += 10) {
      stroke(255, 249, 104);
      line(width / 2, height / 2,
        // trig uses var radius as hypotenuse
        width / 2 + radius * cos(radians(a)),
        height / 2 + radius * sin(radians(a)));
    }
    // bottom left corner
    for (var b = 0; b < width; b += 7) {
      stroke(66, 51, 227);  
      line(0, b, b / ratio, height);
    }
    // top left corner
    for (var c = 0; c < width; c += 7) {
      stroke(30, 81, 221);  
      line(0, c, width - c / ratio, 0);
    }
    // top right corner
    for (var d = 0; d < width; d += 7) {
      stroke(66, 51, 227);  
      line(width, d, d / ratio, 0);
    }
    // bottom right corner
    for (var e = 0; e < width; e += 7) {
      stroke(30, 81, 221);  
      line(width, e, width - e / ratio, height);
    }
}

It took me a while to catch on, but I hit one good curve and used it to figure out the others. I played around with difference colour schemes and decided to go with a sun, stars, and space theme from there.

Emily Zhou – Looking Outwards – 04

On the subject of sound and computation, I recently downloaded an iOS app called Seaquence that composes music using petri dish of life forms.

Screenshot from Seaquence: rudimentary lifeforms

The app by Okaynokay uses a custom physics engine to develop the lifeforms. The creatures’ tempo and waveform are represented by their antennae and tail respectively. I admire the game developers’ visualizing of sound in such a unique way; relating them to living organisms.

The interface allows you to adjust scale, octave, and rhythm and apply transposition and delay for each life form. Before playing the game, I assumed that the UI would be extremely complicated and it would be difficult to produce pleasant sounds. The fact that I was wrong makes me respect the effort put into finding a large range of sounds that work together and applying different parameters to each.


Sample music produced using Seaquence by Okaynokay, 2017.

Creators Gabriel Dunne and Ryan Alexander combined their acoustic and visual artistic sensibilities to develop an algorithm that intricately weaves together the parameters for sound.

Emily Zhou –– Dynamic Drawing

Moving the mouse to the right side of the frame will draw a colour-changing spiral. Move the mouse to the left side of the frame will erase the spiral.

sketch

// spiral variables:
var angle = 0;
// position parameter
var circleX = 25;
// to keep track of circles
var counter = 0;
// color parameter
var R = -100;
var G = 200;
var B = 20;
// calculation: 360 degrees / 5 degree angle change
var CIRCLES_PER_ROUND = 360 / 5;

function setup() {
    createCanvas(640, 480);
    background(0);
}

function draw() {

    // spiraling colored circles

    // to limit circle size of spiral
    if (counter < 25 * CIRCLES_PER_ROUND) {
        push();
        translate(320, 240);
        rotate(radians(angle));
        // stroke overlap creates smaller circles toward center
        // (size parameter)
        stroke(0);
        // RGB used in color parameter
        fill(R + ((counter - CIRCLES_PER_ROUND) / 8), 
             G - ((counter - CIRCLES_PER_ROUND) / 8),
             B + ((counter - CIRCLES_PER_ROUND) / 8));
        // circleX used in position parameter
        ellipse(circleX, 0, 5, 5);
        pop();
        if (mouseX > width / 2) {
            circleX = circleX + 0.1;
            angle = angle + 5;
            // circle is drawn on every count
            counter = counter + 1;
        }
    }
    
    // spiraling black circles 
    // (opposite direction to "erase")

    // to prevent spiral in opposite direction
    if (counter > 0) {
        push();
        translate(320, 240);
        rotate(radians(angle));
        stroke(0);
        fill(0);
        // circleX used in position parameter
        ellipse(circleX, 0, 7, 7);
        pop();
        if (mouseX < width / 2) {
            // circles drawn counterclockwise
            circleX = circleX - 0.1;
            angle = angle - 5;
            // to keep track of last colored circle
            counter = counter - 1;
        }
    }


    // smiley face

    var m = max(min(mouseX, 640), 0);
    // used in angle parameter
    var angleSmile = m * 640 / 360;

    // yellow circle
    fill(255, 230, 0);
    ellipse(width / 2, height / 2, 50, 50);
    // mouth
    strokeWeight(1.5);
    push();
    translate(320, 240);
    rotate(radians(angleSmile));
    arc(0, 0, 35, 35, 0, PI);
    pop();
    angleSmile = angleSmile + 5;
    // L eye
    fill(0);
    push();
    translate(320, 240);
    rotate(radians(angleSmile));
    ellipse(-8, -7, 3.5, 7);
    pop();
    angleSmile = angleSmile + 5;
    // R eye
    fill(0);
    push();
    translate(320, 240);
    rotate(radians(angleSmile));
    ellipse(8, -7, 3.5, 7);
    pop();
    angleSmile = angleSmile + 5;
    
}

I had some trouble with this project. I started with this idea in mind but realized pretty late into the game that the spiral drawing required background() to be under setup() but adding size parameters required it to be under draw(). I eventually found another way using stroke() but it still limited the graphics. Setting color parameters was also difficult since it was hard to predict; I ended up just experimenting with random values.

Emily Zhou – Looking Outwards – 03

FLUIDIC – Sculpture in Motion is an art installation produced design studio WHITEvoid for the Hyundai Advanced Design Center.

Single phase of FLUIDIC – Sculpture in Motion

The project is intended to embody Hyundai’s adaptive and evolving design language; as tiny spheres act as randomly distributed molecules that aggregate and illuminate based on viewer interaction. I am inspired by the breadth of visual experience that is created by such a large collective small objects.

The work uses a water pond, 12,000 illuminated spheres, and 8 high-speed laser projectors to create a physical point cloud. A computer algorithm randomizes the arrangement of the cloud particles based on the positions and projection angles of the projectors. The program also analyzes the positions of the viewers by calculating their posture and gestures using 3D camera tracking systems. This data is used to determine the cloud’s dynamic motion.


[above]
Video documentation of the FLUIDIC – Sculpture in Motion installation; shows viewer interaction and reaction.

The artwork is an innovative example of parametric 3D fabrication that I particularly admire for its ability to account for viewer interaction in its algorithm.