Julie Choi – Project 07 – Curves

jjchoi_curves

// Julie Choi
// jjchoi
// Project 07
// Section E

var nPoints = 360;

function setup() {
    createCanvas(480, 480);
}

function draw() {
	background(230, 171, 130);
	push();
    translate(240, 240);
	drawEightCurve();
    drawCruciform();
	pop(); 
}

function drawEightCurve() { 
	// http://mathworld.wolfram.com/EightCurve.html
    var x;
    var y;
    var a = 300;
    var b = a / 2.0;
    var p = constrain(mouseY, 0, 480);
    var q = mouseX / 400;
    stroke(148, 79, 81);

    //create for loop to create eight curves in different sizes
    for(var r = 0; r < 1; r+=0.1){
    	// use push pop to rotate the forms with mouse location
        push();
        rotate(map(p, 0, 480, 0, 2 * PI));
        beginShape();
        noFill();
        // make the lines jitter by adding random function
        for (var i = 0; i < nPoints; i++) {
            var t = map(i, 0, nPoints, 0, PI * 2);
            x = a * sin(t) * (q + r) + random(-1, 1);
            y = a * sin(t) * cos(t) * (q + r) + random(-1, 1);
            vertex(x, y);
        }
        endShape(CLOSE);
        pop();
    }
}

function drawCruciform() { 
	// http://mathworld.wolfram.com/Cruciform.html
    var x2;
    var y2;
    var a2 = 300;
    var b2 = a2 / 2.0;
    var p2 = constrain(mouseY, 0, 480);
    var q2 = mouseX / 400;
    stroke(255);

    //create for loop to create cruciforms in different sizes
    for(var j = 0; j < 1; j+=0.1){
    	// use push pop to rotate the forms with mouse location
        push();
        rotate(/*map(p2, 0, 480, 0, 2 * */PI);
        beginShape();
        noFill();
        // make the lines jitter by adding random function
        for (var i = 0; i < nPoints; i++) {
            var t2 = map(i, 0, nPoints, 0, PI * 2);
            x2 = a2 * (1/(cos(t2)) * (q2 + j) + random(-0.5, 0.5));
            y2 = a2 * (1/(sin(t2)) * cos(t2) * (q2 + j) + random(-0.5, 0.5));
            vertex(x2, y2);
        }
        endShape(CLOSE);
        pop();
    }
}

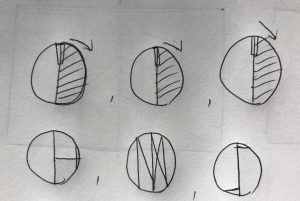
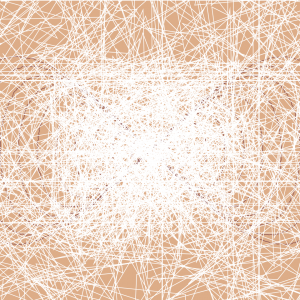
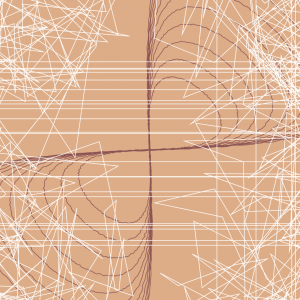
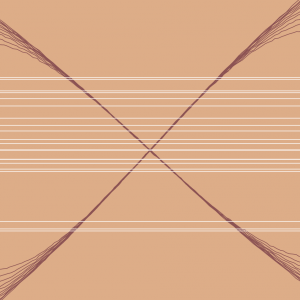
Approaching this project was challenging than I thought because it incorporated different sources of information from a website. However, I learned how to use it to my advantage to create this chaotic curve pattern. My initial idea was to put two different types of curves: eight curves and cruciform. I got the eight curves to jitter and move based on the mouse, but for the cruciforms, I ended up jittering throughout the whole canvas creating a spiderweb-like visual. This was not my initial idea, but just playing around with the different variables and adding it to the formulas provided in the website helped me explore all the different variations of the lines. Down here are the steps of how my curves transform:
Julie Choi – Looking Outwards – 07

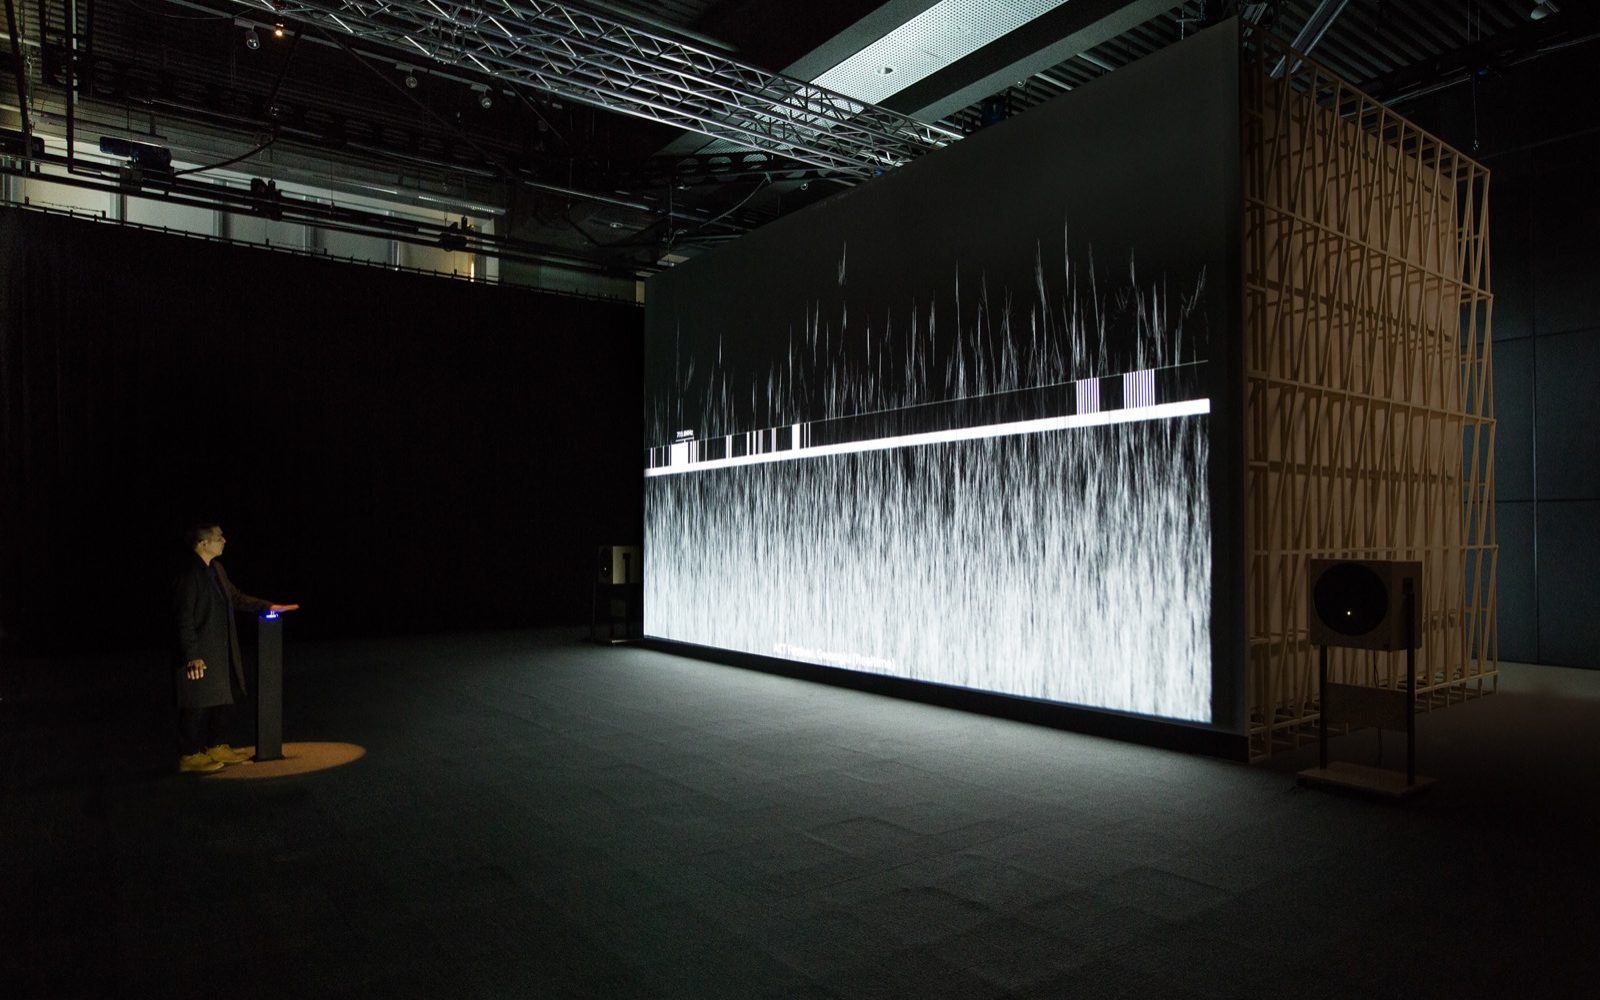
Sensing Streams – invisible, inaudible (2014) –– Ryuichi Sakamoto and Daito Manabe, Photo by Sarah Kim

This artwork, Sensing Streams – invisible, inaudible, was created by the collaboration between Ryuichi Sakamoto and Daito Manabe in 2014. This piece is made to express electromagnetic waves that are not visible to the human eyes. The waves express the “manifested in mobile and other communication technologies that have become integral to modern society.” The movement of the electromagnetic waves is conducted by antennas that provide data through a collection of electric waves originated by the technology used today. This projection of imagery and symbolism is displayed for people to visualize the cellular energy that is used in real time. I deeply admire this artwork because the visuals are produced through a set of information to convey certain emotions regarding our society’s attachment to technology.

Julie Choi – Abstract Clock – Project 6

Julie Choi – Abstract Clock

function setup() {  
    createCanvas(480, 480);
}

function draw() {
	//create background color
    background(13, 0, 76);
    
    fill(255, 245, 104);
    rect(0,0, width, height/4);

    fill(255, 245, 104);
    rect(0, 4 * height / 5, width, height/5);
    
    //set up speed of time
    var H = map(hour() + norm(minute(), 0, 60), 0, 24, 0, TWO_PI * 2) - HALF_PI;
    var M = map(minute() + norm(second(), 0, 60), 0, 60, 0, TWO_PI) - HALF_PI; 
    var S = map(second(), 0, 60, 0, TWO_PI) - HALF_PI;
    
    //declare variables for the centers of ellipses
    var cxH = width / 5;
    var cyH = height / 2;
    var cxM = width / 2;
    var cyM = height / 2;
    var cxS = 4 * width / 5;
    var cyS = height / 2;

    //create three ellipses that represent hour, minute, and second
    fill(255, 255, 255, 90);
    stroke(255);
    strokeWeight(5);
    ellipse(cxH, cyH, 100, 100);
    ellipse(cxM, cyM, 100, 100);
    ellipse(cxS, cyS, 100, 100);

    //print text for colon
    fill(255);
    textSize(40);
    strokeWeight(5);
    text(':', 160, height / 2 + 10);
    text(':', 305, height / 2 + 10);

    //print ellipses for hour, minute, and second based on the speed of time and angle using radians
    fill(255);
    strokeWeight(5);
    stroke(255, 245, 104);
    line(cxH - cos(H) * 50, cyH - sin(H) * 50, cxH + cos(H) * 50, cyH + sin(H) * 50);
    /*
    //trial and error
    fill(200);
    line(cxH, cyH, cxH+cos(H/2)*25, cyH+sin(H/2)*25);
    var startX = cxH+cos(H/2)*25
    var startY = cyH+sin(H/2)*25
    line(startX-cos(H)*40, startY-sin(H)*40, startX+cos(H)*40, startY+sin(H)*40)
    */
    stroke(255, 245, 104);
    fill(255, 245, 104);
    ellipse(cxH + cos(H) * 50, cyH + sin(H) * 50, 10, 10);

    strokeWeight(5);
    fill(255);
    line(cxM - cos(M) * 50, cyM - sin(M) * 50, cxM + cos(M) * 50, cyM + sin(M) * 50);
    stroke(255, 245, 104);
    fill(255, 245, 104);
    ellipse(cxM + cos(M) * 50, cyM + sin(M) * 50, 10, 10);

    strokeWeight(5);
    fill(255);
    line(cxS - cos(S) * 50, cyS - sin(S) * 50, cxS + cos(S) * 50, cyS + sin(S) * 50);
    stroke(255, 245, 104);
    fill(255, 245, 104);
    ellipse(cxS + cos(S) * 50, cyS + sin(S) * 50, 10, 10);

    //print time in text form
    fill(255);
    noStroke();
    textFont('didot');
    textSize(15);
    translate(-40,30);
    text("Hour: " + nfc(H, 0), cxH + 10, 300);
    text("Minute: " + nfc(minute(), 0), cxM + 5, 300);
    text("Second: " + nfc(second(), 0), cxS, 300);

}

As usual, I learned a lot from coding this project. For me, figuring out the specific angles to set it to the speed of the time was the most challenging part. My first attempt was to make the sticks indicating the time the letters, H, M, and S. However, figuring out the angle of each letter based on the center point of the ellipses were challenging since the letters were not symmetrical. I ended up creating this golden clock to visually represent the hour, minute, and second just like how many digital clocks are these days.

Julie Choi – Looking Outwards – 06

Inspired by Jackson Pollock: Live Painting at VAAS by students

This artwork was inspired by the art of randomness that Jackson Pollock has expressed in his artworks. In VAAS, students in vocational training put on a physical art show. The piece embodies the mood of the “60s era Cambodian rock music” through a live painting performance. It captures randomness during the performance because they try to express their theme, “riot of colors”. On a big canvas, a group of students paints on the white surface with body movements and objects such as brooms, leaves, and shoes. I admire this piece of art because sometimes randomness can be hard in a society with high technological development. I feel like this artwork was possible for students to present it because teenagers are known to be youthful and free. During the performance, they did not have any rules to how they painted; they ended a creating and expressing their youth in dreams with many shades of color and motion. This work is hung up on the VAAS courtyard so that visitors get to see when they enter the school. I respect this type of randomness in art because it is closer to playing rather than very calculated strokes.

Julie Choi – Looking Outwards 05

(Video from Pixar explaining their process behind the film)

This is the process of how the movie, The Incredibles 1 was simulated before its production. The process of the visual creation of the main characters are made with sketches by designers and is sent off to the animator. The animator then takes the design to simulate one of the scenes on the digital screen. The simulation is a graphically computed shape with certain motions of the characters’ body parts. To make the movie dynamic as it is, a lot of testing and iterations were made through this technology. Their concept of making a normal guy into some powerful character was planned within this platform. I was inspired by their process work that heavily utilized 3D computer graphics since this movie was produced in 2004. I was quite surprised that they had innovative simulations more than a decade ago. Also, The Incredibles is one of my favorite films so it was interesting to take a look at their work behind the project.

Julie Choi – Project 05 – Wallpaper

bubble wallpaper

function setup() {
    createCanvas(600, 400);
}

function draw() {
    background(255);
    drawPatter(); //call function drawPatter
    noLoop(); 
}
function drawPatter() {
    // draw blue background line
    for(var i = 20; i < width; i += 60){
        strokeWeight(7);
        stroke(60, 211, 206, 50);
        line(i, 0, i, height);
    }
    // draw red background line
    for(var p = 10; p < width; p += 90){
        strokeWeight(3);
        stroke(255, 66, 0, 70);
        line(p, 0, p, height);
     }
    // draw the bubbles with ellipses with low opacity
    for (var y = 50; y < height + 50; y += 100) {
      for (var x = 50; x < width + 50; x += 100) {
          noStroke();
          var r = (y/200) * 255;
          var w = (x/200) * 255;

          fill(r / 32, w, 180, 50);
          ellipse(x, y, 30, 30);

          fill(134, w / 2, r, 50);
          ellipse(x + 18, y + 15, 30, 30);

          fill(r, w, 100, 50);
          ellipse(x + 18, y - 10, 30, 30);

          fill(r, w, 100, 50);
          ellipse(x + 10, y + 23, 20, 20);

          fill(r / 40, 0, 100, 50);
          ellipse(x + 10, y + 10, 10, 10);

          fill(r / 2, w, 100, 50);
          ellipse(x + 10, y + 10, 10, 10);

          fill(r, 0, 100, 50);
          ellipse(x + 30, y + 30, 50, 50);
      }
    }
}

I enjoyed this assignment because it really allowed me to be creative. My wallpaper is a pattern of colorful bubbles, and I was inspired by the old wallpaper I had as a child. Although it does not look similar to my actual wallpaper, I had fun making new designs from my memory.

Julie Choi – Project 04 – String Art

julie_choi_string_art

/*Julie Choi
15-104 Section E
jjchoi@andrew.cmu.edu
Project-04
*/

function setup() {
	// setup canvas
    createCanvas(400, 300);
}

function draw() {
    background(255);
    // declare varables along the edges 
    var x1 = width/4;
    var x2 = width/2;
    var y1 = height/2;
    var y2 = height/3;
    
    // start a for loop for lines
    for (var i = 0; i < 35; i++) {
        strokeWeight(1.5);
        stroke(255, 0, 0);
        line(width - x1, 0, 0, height - y1);
        stroke(0, 0, 255);
        line(width, height - y1, width - x2, height);
        stroke(0, 255, 54);
        line(x1, 0, width, height - y2);
        stroke(255, 0, 234);
        line(0, height - x1, y2, height);
        stroke(90, 0, 255);
        line(x1, 0, 0, y2);
        stroke(174, 255, 0);
        line(0, height - y2, width - y2, width - x1);
        stroke(255, 0, 0);
        line(height - x1, 0, width, y1);
        x1 += 6;
        y1 -= 6;
        y2 -= 6;
        x2 += 6;
    }
    
    // draw eye shape
    stroke(255);
    strokeWeight(1);
    translate(-10, 10);
    beginShape();
    vertex(130, 150);
    bezierVertex(130, 150, 200, 70, 270, 150);
    vertex(130, 150);
    bezierVertex(130, 150, 200, 230, 270, 150);
    endShape(); 
    stroke(0);
    strokeWeight(1.5);
    line(130, 150, 270, 150);

    // draw pupil
    fill(0);
    stroke(255);
    ellipse(width / 2, height / 2, 50, 50);
    ellipse(width / 2, height / 2, 30, 30);
}

I enjoyed creating consecutive lines in different positions through this project. I ended up creating an Illuminati sign as I explored different compositions. I am satisfied with my final result and learned a lot from this exercise.

Julie Choi – Looking Outwards – 04

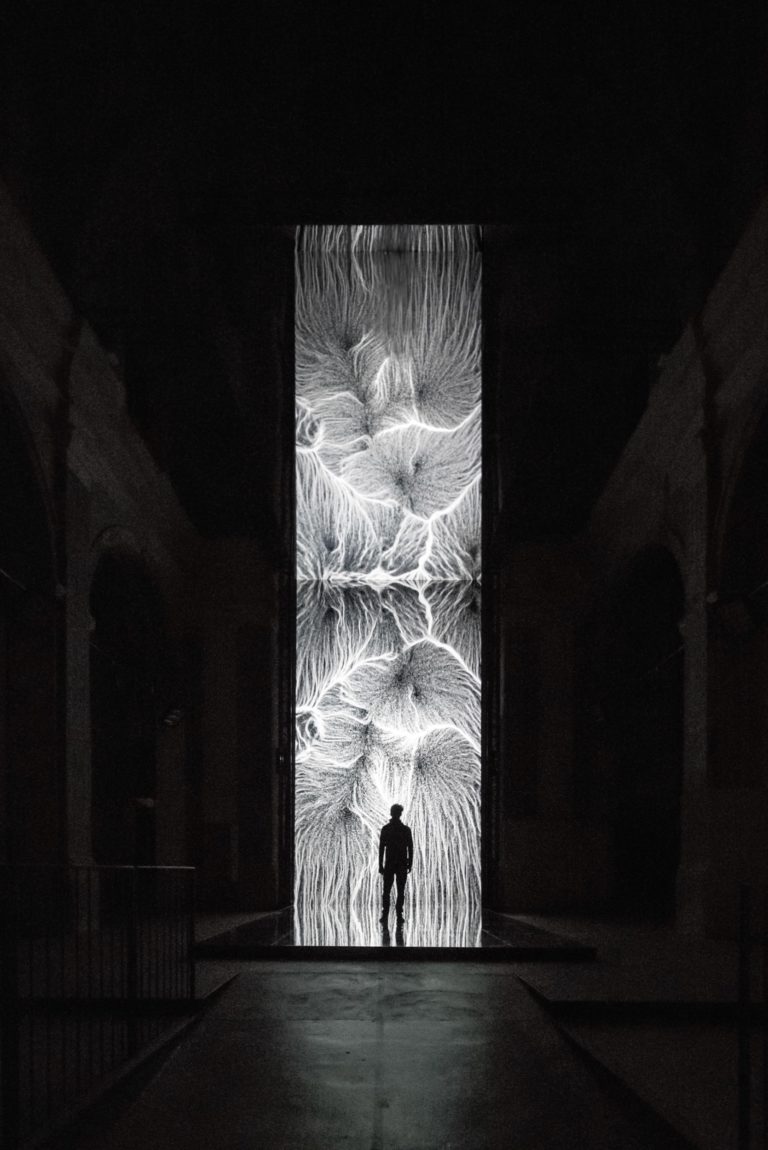
Above shows the MULTIVERSE, the eternal birth and death of infinite parallel universes.

This project, Multiverse is an embodiment of the concept of “a system composed of an infinite number of universes that coexist simultaneously outside of our space-time.” Derived from the multiverse theory presented by Lee Smolin, this art piece fuses both audio and visual to generate a live experience of a narrative context. Multiverse was built through a program called openFrameworks that assimilates a continuous slide of digitally created photographs that displays a realistic series of evolutions of the multiverse. The photographs are generated with a soundtrack from the interaction of the visual elements. In the photographs, small unidentifiable particles continuously merge and separate forming bigger particles.

The vertical projection is 7.5 meters tall and has a mirror on the ceiling for a dramatic experience.

This art is displayed in a pitch black room that centers the focus only on the project. When the audiences stand in front of the vertical projection that is 7.5 meters tall, they are able to witness the art of creation.

Julie Choi – Project 03 – Dynamic Drawing

installation drawing

/*Julie Choi
15-104 Section C
jjchoi@andrew.cmu.edu
Project-03
*/

// declare necessary variables
var ballSizeB = 10
var ballX = 320;
var ballY = 240;
var x = 50
var angle = 0;
var angle2 = 0;
var starColor = 255;


function setup() {
	// setup canvas
    createCanvas(640, 480);
    // draw background in setup so that stars leave marks
    background(0);
}

function draw() {
	//background(0);
    var ballSizeA = 80;
    ballSizeA = constrain(ballSizeA, 1, 400);
    
    //cover the background of the inside of the planets black
    fill(0);
    noStroke();
    ellipse(width / 2, height / 2, 300, 300);
    
    //drawing yellow installation
    push();
    translate(width / 2, height / 2);
    rotate(radians(angle2));
    noStroke();
    fill(starColor);
    ellipse(x, x, 5, 5);
    pop();
    angle2 = angle2 + 5; 
    x = mouseY - 120;

    strokeWeight(3);
    stroke(255);
    fill(253, 255, 55);
    ellipse(ballX, ballY, ballSizeA, ballSizeA);

 	// draw colored planets
    push();
    noStroke();
    translate(width/2, height/2);
    rotate(radians(angle));
    fill(55, 255, 210);
    ellipse(0, -150, ballSizeB, ballSizeB);
    fill(55, 130, 255);
    ellipse(-150, 0, ballSizeB, ballSizeB);
    fill(255, 182, 55);
    ellipse(150, 0, ballSizeB, ballSizeB);
    fill(255, 55, 79);
    ellipse(0, 150, ballSizeB, ballSizeB);
    pop();
    angle = angle + 1.5;
    
    //text in the moon
    fill(0);
    noStroke();
	textSize(25);
	textFont('didot');
	text('moon', width / 2.22, height / 1.95);
}

My third project is an installation drawing that users can interact with. When you move the mouse, the rotating stars change radius and starting point to draw stars in space. Although I experienced some obstacles while using the rotation function, I enjoyed doing this project because I also learned a lot.

Julie Choi – Looking Outwards – 03

These are some samples that the MIT media lab produces using their voxel-based 3D printing.

The MIT media lab consist of many research assistants who are both engineers and artists. They recently released a new project that produces data into a physical form through a voxel-based multi-material 3D printing. This project was very interesting because it converts data sets to process the information through a modernized 3D printer that allows the user to produce the intricate details of the art. Most 3D printing analysis the basic form and physicality of an object so that people can take a step forward to analyze the shape and size, but this voxel printing produces elaborated forms with different texts and materials of choice and alleviates altering data that possibly might lead to data loss.

This is one of the brain models that MIT media lab produced with their voxel-based 3D printer. “White matter tractography data physicalization of the human brain, visualizing bundles of axons, which connect different regions of the brain.”

Although this form does not have any function from their physical existence, it manifests the sharp details that the artist puts in the artwork. In the photo above, you can see how the voxel-based 3D printer prints the exact form of the blood vessels within the brain structure with specific gradient shades. From evaluating the visual features that would be produced from the data to converting these materials to a readable format for the printer, artists use this type of 3D printing that brings the artwork that is usually visualized in screen to a physical form that gives life to the final form of their aesthetic sensibilities.

This project is an advancement in their 3D printing technology. Thus, each of their works doesn’t have a specific title. Also, as read from the article, this project was initiated and completed in a group of MIT media lab workers.