Miranda Luong – Project 12 – Proposal

Collaborator: Jason Zhu

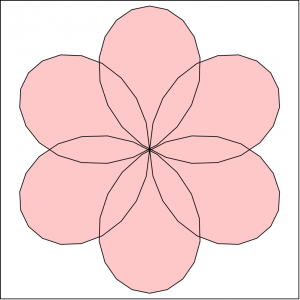
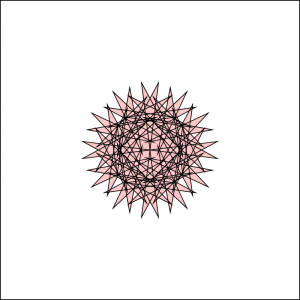
For our final project, Jason and I want to create an audiovisual performance instrument. Inspired by the dynamic capabilities of static design, a concept honed by historic Swiss Design, our project will utilize the alternation of simple geometric shapes to visualize the kinetic nature of music. Source audio will be represented by a singular circle surrounded by a sea of triangles and quadrilaterals. The scale of the center circle and the form of outside shapes will change according to beat and frequency changes in the music. This visual display will suggest an interplay between the source audio and its environment. The concept is similar to ripples created by a droplet of water. This project will explore the communicative capabilities of flat imagery to convey movement and test our own abilities to break down music in a communicative format. Below is an example of how the visuals of this project will look.

Miranda Luong – Looking Outwards – 12

“One More” Official Music Video(2018) by Yaeji start at 2:11

This video by Yaeji features many distortion effects that build upon the trippiness of her own music. A certain effect I really liked and is related to my upcoming project is the ripples generated at every clap in the music (such as 2:11). These ripples are timed perfectly well, with a slight bounce back because the claps occur in sets of 2. In addition, visually, these generated waves are quite organic but their pacing is what makes them obviously generated by something man-made, that is her music.

Beethoven (1955) by Josef Müller-Brockmann

Josef Müller-Brockmann was an iconic Swiss graphic designer. One of his most notable works was his Beethoven poster, featured above. In his poster, the concentric arcs relate directly to the mathematical systems and structures present in Beethoven’s music. Dramatic changes in scale, placement, and color are a manifestation of the same drama in Beethoven’s music. This static image possesses a dynamic energy that I hope to emulate in my own project.


Miranda-Luong-Looking-Outwards-11

Adventures of the Solitary Bee, Composed, written, performed and directed by Miya Masaoka. Special thanks to Scot Duration: 8:32 from Miya Masaoka on Vimeo.

The artist that I will be looked into was Miya Masaoka, a composer, sound artist, and musician based in New York City. Her work operates at the intersection of spatialized sound, recording inside physical objects or inside a plant or the human body, within architecturally resonant spaces or outdoor resonant canyons. A specific project that I found resonating was Adventures of the Solitary Bee (1999), where she uses natural sounds in addition to some musical notes made via instruments to create an almost electronic white-noise. The visual imagery and audio used in the video create a strong tie between the natural and man-made, two areas of study the artist has delved into before, but at separate times. Not much is written about the algorithms used to create this sound, but from what I can gather a basic audio editing program that allows overlays probably worked with as it is her raw material that is vital to the project.

Miranda-Luong-Project 11

sketch

/* Miranda Luong
Section E
mluong@andrew.cmu.edu
Project-11-Composition
*/

var myTurtle

function setup() {
    createCanvas(480, 480);
    background(0);
    myTurtle = makeTurtle(width/2,height/2); //places starting turtle at center
    myTurtle.setColor('black');
    myTurtle.setWeight(6);
}

// When the user clicks the mouse
function mousePressed() {
    //turtle moves to mouse
    myTurtle.goto(mouseX,mouseY);
    //if mouse is south of canvas' horizontal center, pen is red
    if (mouseY > height/2){
      myTurtle.setColor('red');
    }
    //if mouse is north of canvas' horizontal center, pen is blue
    if (mouseY < height/2){
      myTurtle.setColor('blue');
    }
    //size of circle is random from range between 5 and 20
    var size = random(5,20);
    //draw circle
    for (var i = 0; i < 360; i+=size){
        myTurtle.penDown();
        myTurtle.right(size);
        myTurtle.forward(10);
        myTurtle.penUp();
    }
}


function turtleLeft(d) {

    this.angle -= d;
}
 
 
function turtleRight(d) {
    this.angle += d;
}
 
 
function turtleForward(p) {
    var rad = radians(this.angle);
    var newx = this.x + cos(rad) * p;
    var newy = this.y + sin(rad) * p;
    this.goto(newx, newy);
}
 
 
function turtleBack(p) {
    this.forward(-p);
}
 
 
function turtlePenDown() {
    this.penIsDown = true;
}
 
 
function turtlePenUp() {
    this.penIsDown = false;
}
 
 
function turtleGoTo(x, y) {
    if (this.penIsDown) {
      stroke(this.color);
      strokeWeight(this.weight);
      line(this.x, this.y, x, y);
    }
    this.x = x;
    this.y = y;
}
 
 
function turtleDistTo(x, y) {
    return sqrt(sq(this.x - x) + sq(this.y - y));
}
 
 
function turtleAngleTo(x, y) {
    var absAngle = degrees(atan2(y - this.y, x - this.x));
    var angle = ((absAngle - this.angle) + 360) % 360.0;
    return angle;
}
 
 
function turtleTurnToward(x, y, d) {
    var angle = this.angleTo(x, y);
    if (angle < 180) {
        this.angle += d;
    } else {
        this.angle -= d;
    }
}
 
 
function turtleSetColor(c) {
    this.color = c;
}
 
 
function turtleSetWeight(w) {
    this.weight = w;
}
 
 
function turtleFace(angle) {
    this.angle = angle;
}
 
 
function makeTurtle(tx, ty) {
    var turtle = {x: tx, y: ty,
                  angle: 0.0, 
                  penIsDown: true,
                  color: color(128),
                  weight: 1,
                  left: turtleLeft, right: turtleRight,
                  forward: turtleForward, back: turtleBack,
                  penDown: turtlePenDown, penUp: turtlePenUp,
                  goto: turtleGoTo, angleto: turtleAngleTo,
                  turnToward: turtleTurnToward,
                  distanceTo: turtleDistTo, angleTo: turtleAngleTo,
                  setColor: turtleSetColor, setWeight: turtleSetWeight,
                  face: turtleFace};
    return turtle;
}

I went for a pretty simple drawing. When a visitor clicks on the canvas, a circle is drawn. The colors of these circles change according to where they clicked.

Miranda-Luong-Project-10

sketch

/* Miranda Luong
Section E
mluong@andrew.cmu.edu
Project-10: Generative Landscape
*/
var trees  = [];
var hillSpeed = 0.00005;
var hillDetail = 0.005;

function setup() {
    createCanvas(640, 240); 
    
    // create an initial collection of 30 trees
    for (var i = 0; i < 30; i++){
        //sets random birthplaceX for trees 
        var rx = random(width);
        trees[i] = makeTree(rx);
    }
    frameRate(100);
}


function draw() {
    background(66, 131, 244); 
    //sun
    noStroke();
    fill(225, 145, 90);
    ellipse(width-55, 40, 45, 45);
    drawHill();
    updateAndDisplay();
    removeOutOfView();
    addTrees();

}

function drawHill(){
    noStroke();
    fill('green');
    beginShape();
    vertex(0, height);
    for (var x = 0; x < width; x++){
        var h = (x * hillDetail)+ (millis() * hillSpeed);
        var y = map(noise(h), 0, 1, 0, height);
        vertex(x, y);
    }
    vertex(width,height);
    endShape();
}

function updateAndDisplay(){
    // Update the trees's positions, and display them.
    for (var i = 0; i < trees.length; i++){
        trees[i].move();
        trees[i].display();
    }
}

function removeOutOfView(){
    // If a tree has dropped off the left edge,
    // remove it from the array.  Copy all the buildings
    // we want to keep into a new array.
    var treesToKeep = [];
    for (var i = 0; i < trees.length; i++){
        if (trees[i].x + trees[i].breadth > 0) {
            treesToKeep.push(trees[i]);
        }
    }
    trees = treesToKeep; // remember the surviving buildings
}

function addTrees() {
    // With a very tiny probability, add a new tree to the end.
    var newTreeLikelihood = 0.007; 
    if (random(0,1) < newTreeLikelihood) {
        trees.push(makeTree(width));
    }
}

// method to update position of tree every frame
function treeMove() {
    this.x += this.speed;
}
    
// draw the tree
function treeDisplay() {
    var totalBushHeight = this.nBush * this.bushHeight
    noStroke(); 
    push();
    translate(this.x, height-100);
    for (var i = this.nBush; i > 1; i = i - 1) {
        fill(14, 100-(i*5), 39); 
        triangle(0, i * this.bushHeight, this.breadth, i * this.bushHeight, this.breadth/2, (i-1)*(this.bushHeight-5));
        }
    fill('brown');
    rect(this.breadth / 4 + 2.5,totalBushHeight,5,8)
    pop();
}

function makeTree(birthLocationX) {
    var tree = {x: birthLocationX,
                breadth: 20,
                speed: -1.0,
                nBush: round(random(2,5)),
                move: treeMove,
                display: treeDisplay,
                bushHeight: 10}
    return tree;
}

This was a really challenging exercise. Sadly, there was a lot I wanted to do but just couldn’t seem to figure out. Ideally, the shape of the hills would’ve matched the position of the trees but because the X placement of the trees from the beginning was random, I couldn’t create a linkage by chronological order of birth (a for loop would’ve been great for that).
I think I definitely have a better understanding of objects and creating generative landscape images, a far cry from past projects generative art.

Original Sketch

Miranda-Luong-Looking-Outwards-10

Rise and Fall from Design I/O on Vimeo.

Zanyparade is a studio headed by Emily Gobeille, with specialties in visual design, motion graphics, and interaction. A project that I found very interesting was Rise and Fall, an interactive front and back magazine cover created for the March 2010 issue of Boards Magazine. By rotating the magazine, readers navigate through the world of Rise and Fall, revealing story nodes as the tale of opposing forces unfolds. The orientation in which they rotate the magazine is directly linked to the way they move around the world. I think this project is interesting because it’s an interesting application of sensor technology to the newly digitized world of books. Print and web are two quite segregated mediums- but this project bridges the two and highlights the strength of both — that is the physical presence of a book, and the interactive capabilities of the web.

MirandaLuong-Project-09-Portrait

sketch

/* Miranda Luong
Section E
mluong@andrew.cmu.edu
Project-09
*/

var underlyingImage;

function preload() {
    var myImageURL = "https://i.imgur.com/Lq0vGxO.jpg";
    underlyingImage = loadImage(myImageURL);
}

function setup() {
    createCanvas(480, 480);
    background(0);
    underlyingImage.loadPixels();
    frameRate(10000);
}

function draw() {
    var px = random(width);
    var py = random(height);
    var ix = constrain(floor(px), 0, width-1);
    var iy = constrain(floor(py), 0, height-1);
    var theColorAtLocationXY = underlyingImage.get(ix, iy);

    noStroke();
    fill(theColorAtLocationXY);
    rect(px, py, 10, 10);

}

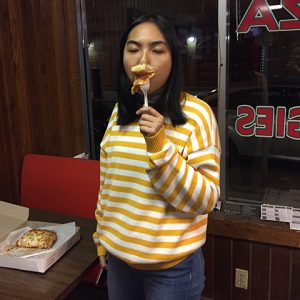
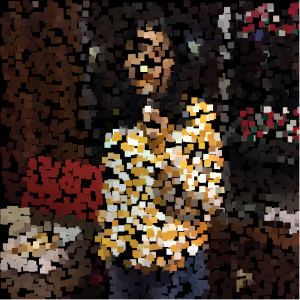
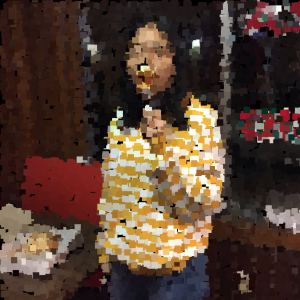
This is Mimi. She is eating pizza. I thought it’d be a fun creating this build up to see a girl munching on pizza.

Original Photo

Mid-way through Rendering

Nearly finished Rendering

MirandaLuong-LookingOutwards-09

I will be reviewing Veronica Wang’s project review of Intr(e)Scapes, a landscape installation piece that can sense and react to visitors’ movement with reactive LED-based animations. Built in 2015 by SHO Architecture, Intr(e)Scapes is an installation that takes advantage of natural elements. I personally enjoy the project greatly. As someone who grew up in a crowded city without a lot of nature, this project was the perfect combination of both the natural and human-generated. I personally think it would fit great in where I grew up. As for Veronica’s analysis of the project, I think she did a stellar job. I could not agree with her more in her interpretation of the analysis as playful, tangible, and sensorial in effect. In fact, there is little to none that I disagree with as I think she’s done a neutral analysis that keeps to the facts. The one comment that I have of the project, overall, is that I think it would have been nice to incorporate further natural elements. The project uses artificial stalks that attempt to mimic natural grass and I would have thought it be more interesting if more natural elements were incorporated-perhaps real grass.

A video of the project installed in Georgetown (2015).


 Installation view in Georgetown.

An image of the project on site at Georgetown’s Business Improvement GLOW conference.

MirandaLuong-LookingOutwards-08

My artist is Meejin Yoon who is a professor of architecture at MIT. She was born in Seoul, South Korea and attended Cornell for her bachelors and later received further education at Harvard. Yoon’s main area of focus is within the domain of responsive and interactive architecture. Her projects are innovative in her use of technology, especially new and novel technologies that have not been widely adopted.


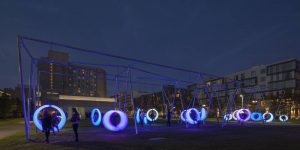
The project I most admire is Swing time (above), located between the Boston Convention and Exhibition Center and D Street. The installation uses custom polypropylene and LED lights that are controlled based on movement. I thought this was quite unique given that most of the projects I have seen thus far in this class have used various algorithms. This piece is reactive and as such uses an internal accelerometer to measure acceleration forces. This combination of data and LED lightning creates beautiful displays that really light up a community.


Miranda-Luong-Project-07-Curves

sketch

/* Miranda Luong
Section E
mluong@andrew.cmu.edu
Project-07
*/


var nPoints = 100;


function setup() {
    createCanvas(400, 400);
    frameRate(10);
}


function draw() {
    background(255);
    
    // draw the frame
    fill(0); 
    noStroke();

    stroke(0);
    noFill(); 
    rect(0, 0, width-1, height-1); 
    
    translate(width / 2, height / 2);
    drawEpicycloidCurve();
}

//--------------------------------------------------
function drawEpicycloidCurve() {
    // Epicycloid:
    // http://mathworld.wolfram.com/Epicycloid.html
    
    var x;
    var y;
    
    var a = 80.0;
    var b = a / 2.0;

    //Uses mouseX and mouse Y to define the number of petals and overall scale of curve
    var n = round(dist(mouseX,mouseY,width/2,height/2)/5);
    
    fill(255, 200, 200);
    beginShape();
    for (var i = 0; i < nPoints; i++) {
        var t = map(i, 0, nPoints, 0, TWO_PI);
        
        x = (n + 2) * (cos(t) - cos((n + 1) * t));
        y = (n + 2) * (sin(t) - sin((n + 1) * t));

        vertex(x, y);
    }
    endShape(CLOSE);    
}

This was a really hard project to complete. It was hard translating the functions into code, seeing as I don’t really know much math anymore. It took lots of trial and error trying to navigate which variables controlled what in my function. I’m quite happy with the results though, I think it is a very pretty display.