Miranda-Luong-Looking-Outwards-07


Above: Rhythm of Food-Selected Animations sourced from Truth & Beauty’s website.

Google News Lab and Truth & Beauty‘s Rhythm of Food (uses Google search interest to reveal food trends over the years. At first, they compiled this data in a normal line graph specific for every kind of trend in food. However, realizing the potential to dig deeper and better analyze this data, they collected weekly Google Trends data for hundreds of dishes and ingredients, over twelve years and plotted the results on a one year clock. What I find intriguing is this decision to plot the data on a one year clock, considering they had collected 12 years worth of data. It seems their rationale was to harrow in and have viewers see the correlation between seasons and food trends, in addition of time, versus only seeing the difference over time. I admire their decision to do this because it took the extra step of thinking of a new way to visualize food trends that people are most familiar with. The changing of seasons is something that is very prominently linked to food trends, a hidden trend we didn’t realize in terms of data. In addition, the decision to shape and orient the graph in such a way similar to a clock is interesting as it reminds us of the cyclical nature of this data, while still effectively demonstrating the scale of the number of these searches. According to Truth & Beauty, the project was built using  ES2015, webpackreactMaterial UI, and d3 v4. The color scale used for the years is viridis.

Miranda Luong-LookingOutwards-6

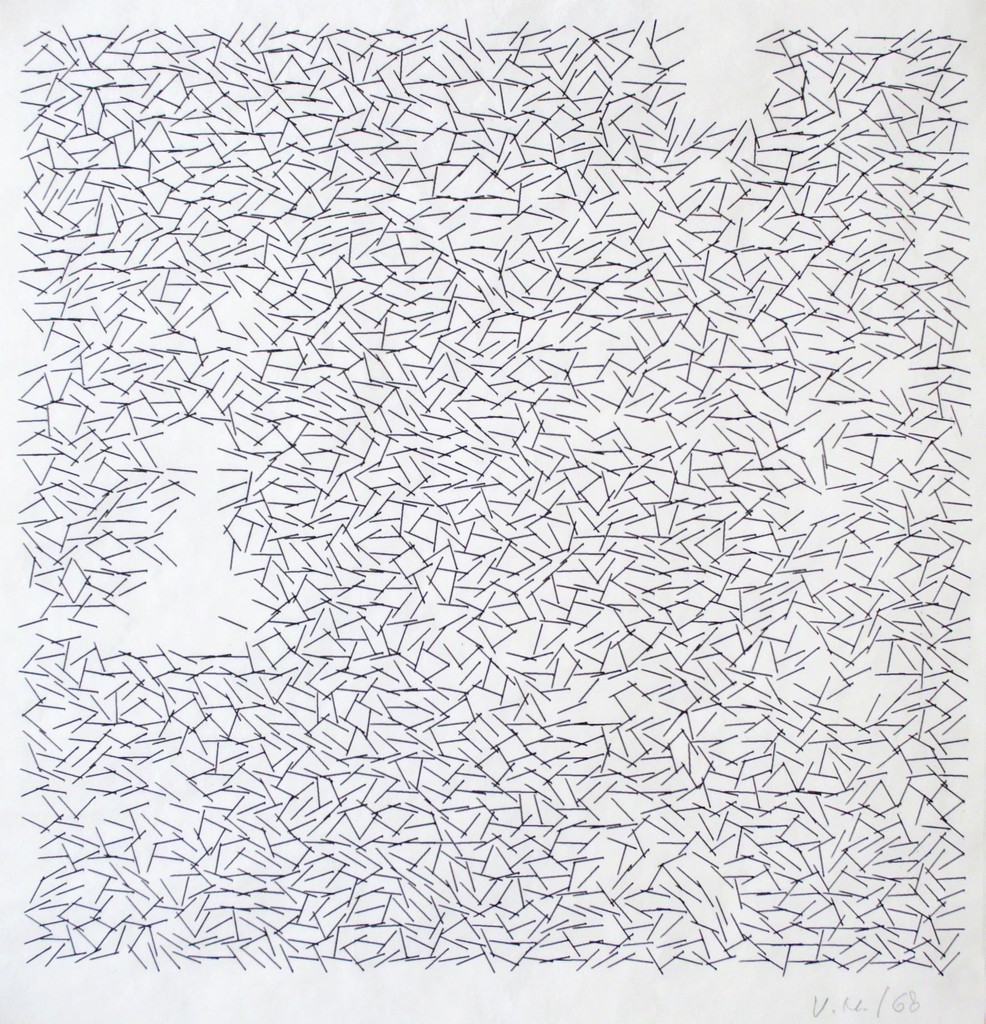
Interruptions by Vera Molnar (1968)

https://collections.vam.ac.uk/item/O1193775/interruptions-drawing-molnar-vera/

Interruptions (1968) by Vera Molnar is a series of drawings of computer graphics generated by Molnar, herself. Molnar introduced randomness into her practice when she began to use computers because she realized humans could not produce pure randomness without it looking repetitive. From what I’ve gathered through research, Interruptions was made using an iterative process. With each new work, she modified her algorithm to build upon the last, exploring a range of possibilities. This implies that her earliest images in the series can be defined as the most random. As she continued to alter her code, adding new structures, her algorithm generated images more specific to what she desired. Molnar’s meticulousness is apparent upon viewing her work: Viewers can see that Molnar used a grid to structure the placement of a line. There is obviously a set of rules that predetermine how the lines shift. I admire the generative process that Molnar placed her code under. Her use of programming to explore ranges of possibilities is an interesting use of computers. She understood the limitations of humans, and thereby employed computers to do the work for her. She was a pioneer and Interruptions is a manifestation of her ability to think outside of the box.

Miranda Luong-Project-06-Abstract-Clock

sketch

/* Miranda Luong
Section E
mluong@andrew.cmu.edu
Project-06
*/

var prevSec;
var millisRolloverTime;

function setup() {
    createCanvas(300, 300);
}

function draw() {
    background(154,191,219);
    
    // Fetch the current time
    var H = hour();
    var M = minute();
    var S = second();
    
    // Reckon the current millisecond, 
    // particularly if the second has rolled over.
    // Note that this is more correct than using millis()%1000;
   
    if (prevSec != S) {
        millisRolloverTime = millis();
    }
    prevSec = S;
    var mils = floor(millis() - millisRolloverTime);

    // print current time next to corresponding colors
    noStroke();
    fill(0);
    text("Hour: "   + H, 30, 22);
    text("Minute: " + M, 30, 42);
    text("Second: " + S, 30, 62);
    text("Millis: " + mils, 30, 82);

    fill(0);
    ellipse(15,18,12,12);
    fill(255/3);
    ellipse(15,38,12,12);
    fill(255*(2/3));
    ellipse(15,58,12,12);
    fill(255);
    ellipse(15,78,12,12);
    
    //Hours
    var hStart = 0 - HALF_PI //first arc always starts at 0
    var hRadius = 100+(200/24) //first arc radius
    //loop creates individual wedges, the number of wedges corresponding to current hour
    for (var a = 0; a < H; a ++){
        stroke(255);
        fill(0);
        //creates arc from point of 'start' to 'start' plus the 'i'th wedge
        arc(50 + width / 2, 10 + height / 2, hRadius, hRadius, hStart, hStart + (TWO_PI/24), PIE);
        //reassigns start with the addition of 'i'th wedge
        hStart += (TWO_PI/24)
        hRadius += (200/24)
    }

    //Minutes 
    var mStart = 0 - HALF_PI
    var mRadius = 75+(200/60) //first arc radius
    //loop creates individual wedges, the number of wedges corresponding to current minute
    for (var a = 0; a < M; a ++){
        fill(255/3);
        stroke(255);
        //creates arc from point of 'start' to 'start' plus the 'i'th wedge
        arc(50 + width / 2, 10 + height / 2, mRadius, mRadius, mStart, mStart + (TWO_PI/60), PIE);
        //reassigns start with the addition of 'i'th wedge
        mStart += (TWO_PI/60)
        //reassigns radius of next wedge to 
        mRadius += (200/60)
    }

    var sStart = 0 - HALF_PI
    var sRadius = 25+(200/60) //first arc radius
    //loop creates individual wedges, the number of wedges corresponding to number of values in array
    for (var a = 0; a < S; a ++){
    //loop generates shades of grey, value increasing in accordance to number of values in array
        fill(255*(2/3));
        stroke(255);
        //creates arc from point of 'start' to 'start' plus the 'i'th wedge
        arc(50 + width / 2, 10 + height / 2, sRadius, sRadius, sStart, sStart + (TWO_PI/60), PIE);
        //reassigns start with the addition of 'i'th wedge
        sStart += (TWO_PI/60)
        sRadius += (200/60)
    }

    var msStart = 0 - HALF_PI
    var msRadius = 0 //first arc radius
    //loop creates individual wedges, the number of wedges corresponding to number of values in array
    for (var a = 0; a < mils; a ++){
    //loop generates shades of grey, value increasing in accordance to number of values in array
        fill(255);
        //creates arc from point of 'start' to 'start' plus the 'i'th wedge
        arc(50 + width / 2, 10 + height / 2, msRadius, msRadius, msStart, msStart + (TWO_PI/1000), PIE);
        //reassigns start with the addition of 'i'th wedge
        msStart += (TWO_PI/1000)
        msRadius += (200/1000)
    }
}

This was a really fun project. I found it interesting thinking of a new way to display time. My project isn’t very abstract, in fact, I think it’s much more literal than a normal clock, seeing as it counts for every increase in every hour, minute and second of time. My code references the tally assignment we had to do the week prior, so it was a great way of implementing old knowledge.

Miranda Luong-LookingOutwards-05

A new experience designed by Local Projects in partnership with Diller Scofidio + Renfro, The Pen at the Cooper Hewitt offers visitors a chance to experiment with creating their own designs. Visitors employ a Pen on interactive tables to explore the museum’s archive of objects, manipulate them and design their own. To do so, visitors draw on a gridded screen and watch as their objects are rendered live as 3D Computer Graphics on another screen adjacent to the first. While I don’t know of the specific algorithm utilized to program the Pen, Cooper Hewitt explains that the Pen’s interface with the interactive tables employs conductive materials common to touchscreen styli. I find this project truly inspiring as it provides a very new and much more immersive way for visitors to engage with works on view in the museum. Reading the project brief and having used the Pen myself, I can tell that its creators wanted to make something very unique, that spoke to the specificities of a design museum. The Pen goes beyond what is offered by an app as it invites visitors to learn about design by designing themselves.

Miranda Luong-Project-05-Wallpaper

sketch

/* Miranda Luong
mluong@andrew.cmu.edu
Section E
Project-05
*/

function setup() {
    createCanvas(600, 400);
    background(80,100,200);
    var tw = width/10;
    var th = 60;
    var oy = 50;
    var ox = 33;
//create 6 rows
    for (var y = 0; y < 6; y++) {
        //for every even row
        if (y % 2 == 0){
            stroke(40,180,40);
            strokeWeight(2);
            //creates 5 sets of twin cherries
            for (var x = 0; x < 5; x++) {
                var py = oy + y * th;
                var px = ox + x * (tw*2);
                //back cherry
                fill(165,40,40)
                ellipse(px-8, py, 25);
                //front cherry
                fill(180,40,40);
                ellipse(px+5, py,30)
                //connecting stem
                noFill();
                arc(px+15, py-10, 50, 50, PI, PI+QUARTER_PI);
                arc(px+22, py-30, 50, 60, 2.25, 3);
                triangle(px-5,py-29,px-1,py-29,px-3,py-27)
                }
        //for every odd row
        } else {
            //creates oranges
            for (var x = 0; x < 5; x++) {
            var py = oy + y * th;
            var px = (ox*2.5) + x * tw*2;
            stroke(40,170,40);
            fill(180,100,40);
            ellipse(px, py, 40);
            //inside orange pattern
            ellipse(px,py,2)
            ellipse(px,py-10,1,12);
            ellipse(px,py+10,1,12);
            ellipse(px-10,py,12,1);
            ellipse(px+10,py,12,1);
                }
            }
        }
    noLoop();
}

function draw() {
    // draw is not called due to noLoop() in setup()
}

I referenced Assignment 2 to create the grid for my wallpaper. I think that assignment was a great exercise for understanding spacing. This was the first time I used the arc module. I never usually create shapes in my projects, but I had a lot of fun making this wallpaper. I decided to draw cherries and oranges because they are my favorite fruit. I tried to play around with colors, which is why I utilized such a bright green to contrast the red and orange.

Miranda-Luong-Project-04-String-Art

sketch

/* Miranda Luong
Section E
mluong@andrew.cmu.edu
Project-04-String-Art
*/

function setup() {
    createCanvas(300, 400);
    background(30);

    //upper left curve
    for (var a = 150; a > 0; a -= 5){
        stroke(230);
        line (150,50+a,a,0)
    }
    //lower right curve
    for (var b = 150; b < height; b += 5){
        stroke(230);
        line (150,b-50,b,height);
    }

    push();
    translate(150,200)
    angleMode(DEGREES);
    rotate(360);

    //white bottom right curve
    for (var a = 150; a > 0; a -= 5){
        stroke(255);
        line (150,50+a,a,0)
    }
    pop();

    //white upper left curve
    for (var a = 150; a > 0; a -= 5){
        stroke(255);
        push();
        translate(150,200)
        angleMode(DEGREES);
        rotate(180);
        line (150,50+a,a,0);
        pop();
    }

    //background lines
    for (var c = 0; c < 300; c += 5){
        stroke(0);
        line (c, a, c, height);
    }
}

I found this assignment to be really challenging. For loops are definitely not easy to grasp. You would think you could easily manipulate positioning by just adding to x and y coordinates but it gets messy really fast.

Miranda-Luong-Looking Outwards-04

http://soundleak.org/works/sounddam

View post on imgur.com

SoundDam (2011) is an aural investigation of spacial awareness by Keiko Uenishi. The installation runs along a 6km stretch of the Rio Paiva river. Children were asked to travel along the river but had to cross many invisible “sound dams” along the way. Unlike traditional dams and barriers, sound dams react to spaces and movements. I admire the idea of using sound to create a physical presence. I can only guess at what algorithms Uenishi is using to create this dynamic experience for the children. In addition to the physical presence that sound creates, the changing of the sound and adjusting to the environment around it. There is something purely breathtaking and warming about the idea that sound can be so well integrated into the environment. Uenishi writes that his installation had many “‘cross-communications’ as results from different parts of the river and the people living along it.” While the algorithms used are still a mystery to me, I feel like the applications are tremendous.

Miranda Luong-Project-03-Dynamic Drawing

sketch

/* Miranda Luong
Section E
mluong@andrew.cmu.edu
Project-03-Dynamic Drawing
*/


function setup() {
    createCanvas(640, 480);
}

function draw() {
    background(170, 190, 200);
    noStroke();

    // Translate the origin point to the center of the screen
	translate(width/2, height/2);

    // Size of circles 
    var size = 60
    //position of circles 
    var pos = 1
    //color of all shapes
    var color = 0
	

	// Restrict mouseX and mouse Y within a 400 x 400 square 
	// positioned at center of canvas
    var mX = max(min(mouseX, 520), 120);
    var mY = max(min(mouseY, 440),40);

    // Change attributes of circles according to distance
    // of mouse from center
	size = dist(320,240,mX,mY) * 60/200;
	pos = dist(320,240,mX,mY) / 250;
	color = dist(320,240,mX,mY);

    // North circle
	var northY= -150*pos;

    fill(color,100,100);
    ellipse(0,-150*pos,size,size);

    // Northeast circle
 
    var northeastX = 150/sqrt(2)*pos;
	var northeastY = -150/sqrt(2)*pos;

	fill(color,100,100);
	ellipse(northeastX,northeastY,size,size);

	// East circle

	var eastX = 150*pos;

	fill(color,100,100);
	ellipse(eastX,0,size,size);

	// Southeast circle
	var southeastX = 150/sqrt(2)*pos;
	var southeastY = 150/sqrt(2)*pos;

	fill(color,100,100);
	ellipse(southeastX,southeastY,size,size);

	// South circle

	var southY = 150*pos;

	fill(color,100,100);
	ellipse(0,southY,size,size);

	// Southwest circle

	var southwestX = -150/sqrt(2)*pos;
	var southwestY = 150/sqrt(2)*pos;

	fill(color,100,100);
	ellipse(southwestX,southwestY,size,size);

	// West circle

	var westX = -150*pos;

	fill(color,100,100);
	ellipse(westX,0,size,size);

	// Northwest circle

	var northwestX = -(150/sqrt(2))*pos;
	var northwestY = -(150/sqrt(2))*pos;

	fill(color,100,100);
	ellipse(northwestX,northwestY,size,size);

	// Center square

	// Change angle of square's rotation according to distance
    // of mouse from center
	angle = dist(320,240,mX,mY)*.01;
    
    // Use cosine to get a smooth CW and CCW motion
  	var c = cos(angle);

    fill(color,100,100);
    rectMode(CENTER);
    rotate(c);
    rect(0,0,60,60);
	
}

I tried to challenge myself but coding movements that radiated from the center. After changing the origin of the canvas to the center, I wonder if it’s possible to set the canvas to a normal cartesian grid. I also wonder as to why mouseX and mouseY do not follow my new grid system even after I changed the origin.

Miranda Luong-Looking Outwards-03

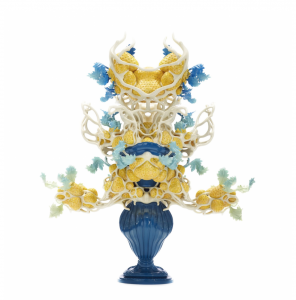
A frontal view of NABEKIESAV, from the artist’s own portfolio site.

NABEKIESAV (2013-2014) is a 3D print that belongs to a larger series of three “strawberry sculptures” including AELBWARTS and NABEKIARTS. Crafted by Nick Ervinck, this series is inspired by his exchange with Dr. A.P.M. Ton den Nijs, a scientist at the Plant Breeding Department of Wageningen University. NABEKIESAV carries Dr. Nijs’ rot-resistant strawberry hybridization process to the extreme. I admire the commanding presence of this utopian strawberry sculpture. From the shape of its vase to the blooming quality of its leaves, it looks as if it may come to life. Why I admire this aspect is because it goes to show the complexity of Ervinck’s thoughts on fruit hybridization. In addition to qualities that make NABEKIESAV seemingly come to life, are sculptural contradictions that make for an impactful experience. While there is something purely beautiful and poetic about the form and texture of his sculpture, Ervinck writes that his sculpture “resembles a horned demon emerging from its cave.” He has transformed the simple strawberry into something surreal and out of ordinary, a manifestation of his own thoughts on fruit hybridization. While I can’t really guess the algorithms utilized to 3d print his sculpture, Ervinck’s final form well depicts the artist’s thoughts on an important topic of today that is the manipulation of the purest forms of nature.

Miranda Luong- Looking Outwards-02

Bubbles Scanner 2 is a visual created by Dan Schiffman, the man behind Coding Train, a web series on Youtube. Using Processing, he created a loop in which stacks of “bubbles” are generated on top of each other. Each bubble is a different color with subtle transparency. I admire the fluidity of his visual; there is something very calming and melodic to it. This is most likely due to his pacing of the stacking which is slow and somewhat graceful. The positioning of the bubbles slightly change in horizontal position every time they are added creating mimicking natural motion, but never to the point that the stack looks like it should tilt over. From what I can guess, his code is continuously generating bubbles that draw on top of each other, with their vertical positions slightly increasing so that the bubbles look like there stacking. The artist’s intentionality is well received, which is what I most admire about his code, because although it is very simple, viewers understand the accuracy and detailed attention required to create such a graceful generative art.