/*Carley Johnson
Section E
cbjohnso@andrew.cmu.edu
Lab 3
*/functionsetup(){createCanvas(400,300);strokeWeight(2);}functiondraw(){background(200);for(var i =20; i <400; i +=20){stroke(30,70,80)line(1.2*i,17,5*i,100);line(1.5*i,120,1.2*i,300);line(.7*i,0,1.1*i,30);stroke(155,190,20)line(.6*i,0,1.1*i,140);line(.7*i,25,1*i,145);line(.7*i,30,1.8*i,160);line(.8*i,50,2.4*i,160);stroke(150,70,10)line(0*i,300,2.4*i,160);line(1*i,240,6*i,300);stroke(30,50,50)line(0*i,240,2*i,100);line(.3*i,200,8*i,100);}}
This project was not one of my favorites, as I missed a few of the classes on for() function and had to do more in depth learn-by-doing. I also just don’t think string art is super attractive. HOWEVER, now that I know the for() function I can definitely think of other uses for it, as incrementation is really helpful and can also simplify some tedious coding.
/*Sharon Yang
Section C
junginny
Project-04
*/functionsetup(){createCanvas(400,300);}functiondraw(){background(255);var x1;var x2;var y1;var y2;var colorLR =20;var colorLG =45;var colorLB =80; //Left curve
x1 =0;
x2 =0;
y1 =0;
y2 =0;push();for(var jL =1;jL <=100; jL+=1){translate(jL,jL);strokeWeight(1-(jL/20));stroke(colorLR,colorLG,colorLB);for(var iL =1;iL <=50; iL+=2.8){
x2 = iL*8;
y1 = iL*6;line(x1-jL,height-y1-jL,x2-jL,y2-jL);} //Change color value - gradient
colorLR+=10;
colorLG+=10;
colorLB+=10;}pop(); //Right curve - resetting variables
x1 =0;
x2 =0;
y1 =0;
y2 =0;
colorLR =25;
colorLG =50;
colorLB =90;push();for(var jR =1;jR <=100; jR+=1){translate(-jR,jR);strokeWeight(1-(jR/20));stroke(colorLR,colorLG,colorLB);for(var iR =1;iR <=50; iR+=2.8){
x1 = iR*8;
y2 = iR*6;line(x1,0,width,y2);} //Change color value - gradient
colorLR+=10;
colorLG+=10;
colorLB+=10;}pop();}
Using for loops to create various lines to put them together into a harmonious art piece helped me explore the order in for loops and/or nested for loops. I played with the stroke weights as well as the colors to create an effect of a gradient.
/* Jaclyn Saik
Section E
jsaik@andrew.cmu.edu
Project-04
*/var x1; //global values for all points that create curves
var y1;var x2;var y2;var increment;var rectW;var rectH;functionsetup(){createCanvas(400,300);background("RosyBrown");strokeWeight(2);
increment =15;
increment =random(5,9); //resets spacing everytime you refresh the page
}functiondraw(){stroke("Pink");
//top right swoop
for(var i =0; i < width; i+= increment){ //increment variable set so I can randomize it
x1 = width; //starting points incrementing along right edge
y1 = i; //increments
x2 = i; //paired with fized width to create curves
y2 =0; //i is paired with zero to create curves
line(x1, y1, x2, y2);}
//bottom left swoop
for(var i =0; i < height; i+= increment){
x1 = i; //values flipped in order to create different curve location
y1 = height;
x2 =0;
y2 = i;line(x1, y1, x2, y2);}
//purple rectangle
noFill(); //created a rectangle in front of the background pink curves
stroke("DarkMagenta");
rectW =280;
rectH =220;rect(60,40, rectW, rectH); //rectangle swoop bottom right
push();translate(60,40); //new axis for creatign curves
for(var i =0; i <= rectH; i+= increment){
x1 = i;
y1 = rectH;
x2 = rectW;
y2 = rectH-i; //new curve position, so increments work opposite based on starting height
//another option would have been to rotate the origin
line(x1, y1, x2, y2);}pop(); //push pop used because I translated the origin
//rectangle swoop upper left
push();translate(60,40);for(var i =0; i <= rectH; i+= increment){
x1 = rectW-i;
y1 =0;
x2 =0;
y2 = i;line(x1, y1, x2, y2);}pop(); //blue rectangle
noFill();stroke("DarkTurquoise");
rectW = rectW-40
rectH = rectH-40rect(60,40, rectW, rectH); //rectangle swoop bottom right
push();translate(60,40);for(var i =0; i <= rectH; i+= increment){
x1 = i;
y1 = rectH;
x2 = rectW;
y2 = rectH-i;line(x1, y1, x2, y2);}pop(); //rectangle swoop upper left
push();translate(60,40);for(var i =0; i <= rectH; i+= increment){
x1 = rectW-i;
y1 =0;
x2 =0;
y2 = i;line(x1, y1, x2, y2);}pop(); //design lines
stroke("AliceBlue");line(0,0, width/2, height)line(0,0, width, height/2);line(width, height,0, height/2);line(width, height, width/2,0); //gold rectangle
noFill();stroke("Gold");
rectW = rectW-40
rectH = rectH-40rect(60,40, rectW, rectH); //rectangle swoop bottom right
push();translate(60,40);for(var i =0; i <= rectH; i+= increment){
x1 = i;
y1 = rectH;
x2 = rectW;
y2 = rectH-i;line(x1, y1, x2, y2);}pop(); //rectangle swoop upper left
push();translate(60,40);for(var i =0; i <= rectH; i+= increment){
x1 = rectW-i;
y1 =0;
x2 =0;
y2 = i;line(x1, y1, x2, y2);}pop();}
Creating string art was a challenging process, especially after translating the origin of my piece around a couple times to experiment. This was definitely an exercise in understanding the coordinate system enough to assign opposing values to the ends of points. I liked playing with the foreground and background of my curves, and I thought it was definitely one the prettiest projects we have made so far.
/*
Jamie Dorst
Section A
jdorst@andrew.cmu.edu
Project-04
*/functionsetup(){createCanvas(400,300);background(0);}functiondraw(){ // variables
var x1 =10;var y1 =10;var x2 =20;var y2 =20;var x3 =350;var y3 =15;var x4 =10;var y4 =295;var x5 =10;var y5 =10;var x6 =20;var y6 =20;var x7 =350;var y7 =15;var x8 =10;var y8 =295;
// BOTTOM LEFT CORNER
// draw bottom left white background lines
// change y coordinate of first point
// change x coordinate of second point
for(var i =0; i <50; i++){stroke('white');
x5 +=9;
y5 +=11;line(0, y5, x5,300);} // draw bottom left blue lines
// change y coordinate of first point
// change x coordinate of second point
for(var i =0; i <50; i++){stroke('blue');
x1 +=10;
y1 +=12;line(0, y1, x1,300);}
// TOP RIGHT CORNER
// draw top right white background lines
// change y coordinate of first point
// change x coordinate of second point
for(var i =0; i <50; i++){stroke('white');
x6 +=19;
y6 +=22;line(400, y6, x6,0);} // draw top right green lines
// change y coordinate of first point
// change x coordinate of second point
for(var i =0; i <50; i++){stroke('green');
x2 +=20;
y2 +=23;line(400, y2, x2,0);}
// TOP LEFT CORNER
// draw top left white background lines
// change y coordinate of first point
// change x coordinate of second point
for(var i =0; i <50; i++){stroke('white');
x7 -=26;
y7 +=24;line(x7,0,0, y7);} // draw top left red lines
// change y coordinate of first point
// change x coordinate of second point
for(var i =0; i <50; i++){stroke('red');
x3 -=27;
y3 +=25;line(x3,0,0, y3);}
// BOTTOM RIGHT CORNER
// draw bottom right yellow lines
// change y coordinate of first point
// change x coordinate of second point
for(var i =0; i <50; i++){stroke('white');
x8 +=16;
y8 -=18;line(400, y8, x8,300);} // draw bottom right yellow lines
// change y coordinate of first point
// change x coordinate of second point
for(var i =0; i <50; i++){stroke('yellow');
x4 +=15;
y4 -=19;line(400, y4, x4,300);}}
For this project I wanted to practice doing for loops. I had trouble figuring out how to move the lines from the bottom left corner, especially getting them into the top left and bottom right corners, because I had to make some values negative. After I figured that out, I wanted to emphasize the shapes of the lines so I made the background black, and added background lines to each corner to make them pop. Overall I found this project sort of difficult, but it was cool once it finally worked.
In this project, I iterated some simple for-loops for each curve. In some cases, dynamic to the mouse’s X position, and in other cases, static. I think what’s nice about the movement is that it’s a dynamic set of strings, tied to a static set, which creates a satisfying connection between their visual elements and rhythm!
This time I didn’t dabble as much in composition before writing the program, instead, I really enjoyed seeing the composition emerge as I played with the numbers. Another nice touch which makes the interactions a bit more satisfying is the additional randomized color sets.
functionsetup(){createCanvas(400,300);}var ratio =0.75; // width to height ratio
var radius =400; // length of radiating center lines
functiondraw(){background(47,19,116); // circles:
// outer circle
fill(244,96,54);noStroke();ellipse(width /2, height /2,300,300); // middle circle
fill(245,110,72);noStroke();ellipse(width /2, height /2,150,150); // inner circle
fill(246,124,90);noStroke();ellipse(width /2, height /2,50,50); // lines:
// center radial
for(var a =0; a <360; a +=10){stroke(255,249,104);line(width /2, height /2, // trig uses var radius as hypotenuse
width /2+ radius *cos(radians(a)),
height /2+ radius *sin(radians(a)));} // bottom left corner
for(var b =0; b < width; b +=7){stroke(66,51,227);line(0, b, b / ratio, height);} // top left corner
for(var c =0; c < width; c +=7){stroke(30,81,221);line(0, c, width - c / ratio,0);} // top right corner
for(var d =0; d < width; d +=7){stroke(66,51,227);line(width, d, d / ratio,0);} // bottom right corner
for(var e =0; e < width; e +=7){stroke(30,81,221);line(width, e, width - e / ratio, height);}}
It took me a while to catch on, but I hit one good curve and used it to figure out the others. I played around with difference colour schemes and decided to go with a sun, stars, and space theme from there.
/* Dani Delgado
Section E
ddelgad1@andrew.cmu.edu
Project-04
*/functionsetup(){createCanvas(400,300);background(10);}functiondraw(){ //draw the sixth layer of lines (brownish black lines)
//these lines are on the "inside" of all other line layers (its the lowest layer)
for(var g =0; g <1.5; g +=0.09){ //set the stroke style
strokeWeight(0.2);stroke(35,19,0); //determine the lerp values
x1 =lerp(0, width /2.15, g);
y1 =lerp(0, height *2.15, g);
x2 =lerp(width *2.15,0, g);
y2 =lerp(height /2.15,0, g); //draw the curves
line(x1,0, width, y1);line(x2, height,0, y2);line(x1, height, width, y2);line(x2,0,0, y1);} //draw the fifth layer of lines (brown lines)
//these lines are on the "inside" the above layers of lines
for(var f =0; f <1.4; f +=0.08){ //set the stroke style
strokeWeight(0.3);stroke(51,34,0); //determine the lerp values
x1 =lerp(0, width /1.9, f);
y1 =lerp(0, height *1.9, f);
x2 =lerp(width *1.9,0, f);
y2 =lerp(height /1.9,0, f); //draw the curves
line(x1,0, width, y1);line(x2, height,0, y2);line(x1, height, width, y2);line(x2,0,0, y1);} //draw the fourth layer of line (dark orange lines)
//these lines are "inside" the above layer of lines
for(var e =0; e <1.3; e +=0.07){ //set the stroke style
strokeWeight(0.4);stroke(102,68,0); //determine the lerp values
x1 =lerp(0, width /1.75, e);
y1 =lerp(0, height *1.75, e);
x2 =lerp(width *1.75,0, e);
y2 =lerp(height /1.75,0, e); //draw the curves
line(x1,0, width, y1);line(x2, height,0, y2);line(x1, height, width, y2);line(x2,0,0, y1);} //draw the third layer of lines (medium orange lines)
//these lines are "inside" the above layer of lines
for(var d =0; d <1.2; d +=0.06){ //set the stroke style
strokeWeight(0.6);stroke(204,136,0); //determine the lerp values
x1 =lerp(0, width /1.5, d);
y1 =lerp(0, height *1.5, d);
x2 =lerp(width *1.5,0, d);
y2 =lerp(height /1.5,0, d); //draw the curves
line(x1,0, width, y1);line(x2, height,0, y2);line(x1, height, width, y2);line(x2,0,0, y1);} //draw the second layer of lines (light orange lines)
//these lines are "inside" of the abvoe layer of lines
for(var c =0; c <1.1; c +=0.05){ //set the stroke style
strokeWeight(0.8);stroke(255,204,102); //determine the lerp values
x1 =lerp(0, width /1.5, c);
y1 =lerp(0, height, c);
x2 =lerp(width *1.5,0, c);
y2 =lerp(height,0, c); //draw the curves
line(x1,0, width, y1);line(x2, height,0, y2);line(x1, height, width, y2);line(x2,0,0, y1);} //draw the uppermost line set (creme colored lines)
//the first line set will curve the corners
for(var i =0; i <1; i +=0.04){ //set the stroke style
strokeWeight(1);stroke(250,240,220); //determine the lerp variables
x1 =lerp(0, width, i);
y1 =lerp(0, height, i);
x2 =lerp(width,0, i);
y2 =lerp(height,0, i); //draw the curves
line(x1,0, width, y1);line(x2, height,0, y2);line(x1, height, width, y2);line(x2,0,0, y1);}}
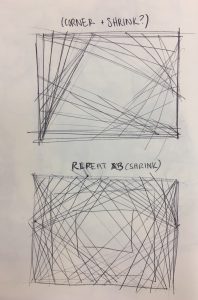
Some initial concept sketches to decide how I wanted to place the lines
Since this is my first experience with for loops (outside of the other class assignments), I found this to be very challenging since I first had to solidify the conceptual aspect of the code before I could begin to work on the physical coding. Once I got into the groove of it though I had fun with the assignment!
/*
Alice Fang
Section E
acfang@andrew.cmu.edu
Project-04
*/var x1; // (x1, y1, x2, y2) variables for lines
var y1;var x2;var y2;var circlesize =270; // circle diameter
var squaresize =80; // square length
functionsetup(){createCanvas(400,300);background(0);}functiondraw(){stroke(57,255,20);strokeWeight(0.5); // bottom left corner curve
for(var i =0; i < width; i +=20){
x1 = i;
y1 = height;
y2 = i;
x2 =0;line(x1, y1, x2, y2);} // top right corner curve
for(var i = width; i >0; i -=20){
x1 = i + width -300;
y1 =0;
y2 = i;
x2 = width;line(x1, y1, x2, y2);} //bottom right corner curve
push();translate(width /4, height);rotate(radians(270));for(var i =0; i < width; i +=20){
x1 = i;
y1 = height;
y2 = i;
x2 =0;line(x1, y1, x2, y2);}pop(); //top left corner curve
push();translate(0, height + width /4);rotate(radians(270));for(var i = width; i >0; i -=20){
x1 = i + width -300;
y1 =0;
y2 = i;
x2 = width;line(x1, y1, x2, y2);}pop(); // center square outline
noFill();rect(width /2-40, height /2-40, squaresize, squaresize); // white circle outlines
stroke(240);ellipse(width /2, height /2, circlesize, circlesize);ellipse(width /2, height /2,115,115);ellipse(width /2, height /2, circlesize /15, circlesize /15);fill(240);ellipse(width /2, height /2, circlesize /27, circlesize /27); // curves generated in square
noFill();strokeWeight(0.5);stroke(57,255,20);push(); // translate (0, 0) to top left corner of square
translate(width /2- squaresize/2, height /2- squaresize/2);square(0,0); // top X shape (function square() established below)
push();translate(0, squaresize); // left X shape
rotate(radians(270));square(0,0);pop();push();translate(squaresize,0); // right X shape
rotate(radians(90));square(0,0);pop();push();translate(squaresize, squaresize); // bottom X shape
rotate(radians(180));square(0,0);pop();pop(); // cross hair (white perpendicular lines)
stroke(255);line(width /2,0, width /2, height);line(0, height /2, width, height /2);}functionsquare(x, y){ // produces X-shape within square
push();translate(x, y);noFill();strokeWeight(0.5);stroke(57,255,20);for(i =0; i <30; i+=10){
x1 =0;
x2 = squaresize;
y1 =.75*i +20;
y2 =-i +20;line(x1, y1, x2, y2);line(x2, y1, x1, y2);}pop();}
This was inspired by lasers that my mind associates with laser security systems, as well as eye-scanning mechanisms. (Or perhaps, a target scope aimed at an eye? They’re all interpretations within the same realm). The color scheme of neon green and black were especially influenced by this. I also used this project as an opportunity to try out and practice defining and creating my own function.
// Shirley Chen
// Section B
// junfanc@andrew.cmu.edu
// Project-04
functionsetup(){createCanvas(400,300);background(244,217,166);}functiondraw(){var x1 =0;var y1 =0;var x2 =0;var x3 =0;var y3 =0;strokeWeight(1); //Draw the blue lines at the bottom left corner
for(var i =0; i <50; i++){
y1 +=4;
x1 +=8;stroke(166,188,201);line(0, y1, x1, height);} //Draw the yellow and pink lines at the upper left and right corner
for(var i =0; i <50; i++){
x2 +=20;
x3 +=5;
y3 +=5;stroke(242,143,143);line(400,0, x2, height);stroke(255,191,62);line(x3,0, x3, y3);}strokeWeight(1);stroke(86,42,42); //Draw lines between points along the circles to create eyes
for(var i =0; i <360; i +=10){line( width *0.2+20*cos(radians(i)),
height *0.4-20*sin(radians(i)),
width *0.2-20*cos(radians(i)),
height *0.4-20*sin(radians(i)));}for(var i =0; i <360; i +=10){line( width *0.5+20*cos(radians(i)),
height *0.4-20*sin(radians(i)),
width *0.5-20*cos(radians(i)),
height *0.4-20*sin(radians(i)));}stroke(0);for(var i =0; i <360; i +=10){line( width *0.2+5*cos(radians(i)),
height *0.4-5*sin(radians(i)),
width *0.2-5*cos(radians(i)),
height *0.4-5*sin(radians(i)));}for(var i =0; i <360; i +=10){line( width *0.5+5*cos(radians(i)),
height *0.4-5*sin(radians(i)),
width *0.5-5*cos(radians(i)),
height *0.4-5*sin(radians(i)));}strokeWeight(2);stroke(214,29,29); //Draw the mouth by connectiing points on the ellipse
for(var i =0; i <360; i +=10){line( width /2.5+30*cos(radians(i)),
height /1.5-30*sin(radians(i)),
width /3.5-30*cos(radians(i)),
height/1.5-30*sin(radians(i)));}}
For this project, I use the “for” loop to map out all the points on different lines and connect them together. When I drew the circles that are constructed by lines, I need to use cos and sine to calculate each point on the circle and then connect them together. The circles eventually form a face. Overall, I feel comfortable with the looping function.
/*
Eliza Pratt
Section E
elpratt@andrew.cmu.edu
Project-04
*/functionsetup(){createCanvas(400,300);}functiondraw(){background(0);var y =0;var x =0;var y1 = height/2;var x1 = width/2var y2 = height/4;var x2 = width/4; //dark gray curves
for(var z =0; z <35; z++){stroke(180- x2/2); //bottom left curve
line(width - x2, height,0, height - y2); //top right curve
line(x2,0, width, y2);
x2 +=6;
y2 +=6;} //gray center curves
for(var i =0; i <44; i++){stroke(x/2); //bottom center curve
line(width - x, height - y, x, height); //top center curve
line(x, y, width - x,0);
x +=7;
y +=7;} //white curves
for(var w =0; w <20; w++){stroke(255); //bottom right curve
line(x1, height, width, height - y1); //top left curve
line(width - x1,0,0, y1);
x1 = x1*1.04;
y1 = y1*1.04;}}
Although confusing at first, I had a lot of fun with this assignment! While it’s frustrating when the lines don’t map out the way you want them to, it was always a surprise when I refreshed my browser. I also played around with adjusting the stroke color in my for loops, which led to some pretty cool gradients!
![[OLD FALL 2018] 15-104 • Introduction to Computing for Creative Practice](../../../../wp-content/uploads/2020/08/stop-banner.png)