Lingfan Jiang – Looking Outward – 04

‘Déguster l’augmenté’is a project done by Erika Marthins with ECAL (Bachelor Media & Interaction Design) which tries to add a sound dimension to food. I found this project very interesting because food is always about smell, taste and visual impression. Sound could really be a new dimension to think about.

It is quite interesting to see how chocolate and Oreo could be transformed into discs, but it is definitely still in its early stage in terms of accuracy. However, the accuracy could also be used as an advantage. For example, it could be used to test the quality of the food.

Lingfan Jiang – Project 04 – String Art

lingfanj-04

//Lingfan Jiang
//Section B
//lingfanj@andrew.cmu.edu
//Project-04


var dx; //x coordinate for points on curve
var dy; //y coordinate for points on curve
var circleDiameter; //diameter of the center circle


function setup(){
    createCanvas (400, 300);

}

function draw(){
    background(0);
    angleMode(DEGREES);
    strokeWeight(0.1); //set a lineweight for the bottom curves
    circleDiameter = 75;


    stroke(255,104,107); //red lines
    for (var x = 0; x < 95; x += 5) {
        dx = 200 + (circleDiameter * cos(x));
        dy = 150 + (circleDiameter * sin(x));
        //connect first quarter of the points on the circle with the points on the top
            for (var i = 0; i < 400; i += 5){
            line(i,0,dx,dy);  
        }
    }
    strokeWeight(0.08);
    stroke(27,179,244); //light blue lines
    for (var x = 90; x < 275; x += 5) {
        dx = 200 + (circleDiameter * cos(x));
        dy = 150 + (circleDiameter * sin(x));
        //connect half quarter of the points on the circle with the points on the left
            for (var i = 0; i < 300; i += 5){
            line(0,i,dx,dy);  
        }
    }
    strokeWeight(0.05);
    stroke(0,40,255); // dark blue lines
    for (var x = 180; x < 275; x += 5) {
        dx = 200 + (circleDiameter * cos(x));
        dy = 150 + (circleDiameter * sin(x));
        //connect quarter of the points on the circle with the points on the bottom
            for (var i = 0; i < 400; i += 5){
            line(i,300,dx,dy);  
        }
    }
    stroke(143,113,255);
    strokeWeight(0.04); // purple lines
    for (var x = 270; x < 455; x += 5) {
        dx = 200 + (circleDiameter * cos(x));
        dy = 150 + (circleDiameter * sin(x));
        //connect half quarter of the points on the circle with the points on the right
            for (var i = 0; i < 300; i += 5){
            line(400,i,dx,dy);  
        }
    }

    noLoop();
}

In this project, I had some difficulties to picture the final form at first. However, after looking through some of the string art examples, I became particularly interested in the circle from. Different from architectural modeling software, you cannot evaluate curves and find points on them. Therefore, the coordinates of the points that form a circle gave me a little bit of trouble. After understanding how “cos” and “sin” could help form it, here is the final result.

Victoria Reiter – Project 04 – String Art

sketch

/*
Victoria Reiter
Section B
vreiter@andrew.cmu.edu
Project-04
*/

// establishes canvas dimensions
function setup() {
    createCanvas(400, 300);
}

function draw() {
    // background color
    background(65);

    // gives values to some variables
    var x1 = 0;
    var x2 = 0;
    var y1 = 0;
    var y2 = 0;
    var g = 40;

    // angle for sin function
    var a = 0;

    // value of increment for angle in sin function
    var inc = PI / 32;

    // draws sin function
    for (var x1 = 0; x1 < width; x1 += 2) {

        // color blue
        stroke(0, 0, 255);

        line(x1 * 1.5, g, x1 * 1.5, g + sin(a + PI / 2) * 50);
        // calculates growth of angle
        a = a + inc;
        x1 += 1;
        g += 2.5;
    }

    // draws bottom left curve, the pretty lilac colored one
    for (x1 = 0; x1 < width; x1++) {
        x1 += 5;
        y2 += 5;

        // color lilac
        stroke(165, 125, 235);

        // draws curve
        line(x1, height, x2, y2);
    } 

    // draws sunset-colored curve on right side of screen
    for (x1 = 0; x1 < width; x1++) {
        x1 = x1 + 4;
        y2 += 5;

        // draws sunset-color
        stroke(244, 66, 0);

        // draws curve
        line(x1, y1, width, y2 - 75);
    } 

    // draws maroon-colored lines in middle of screen
    for (var i = 30; i < width; i += 10) {
        i += 8;

        // color maroon
        stroke(130, 9, 41);

        // draws curve
        line(width - i, height, i * .25, 0);
    }

}

Was able to create several curved lines, including using the sin function to draw a sin curve in blue. Able to draw the bottom left and the right curves as, well, curves, and the center cross of lines in maroon.

Alessandra Fleck – Looking Outwards 04 : Sound Art

One sound and computation project I found that I thought was interesting is th
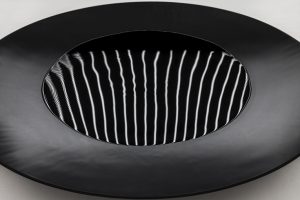
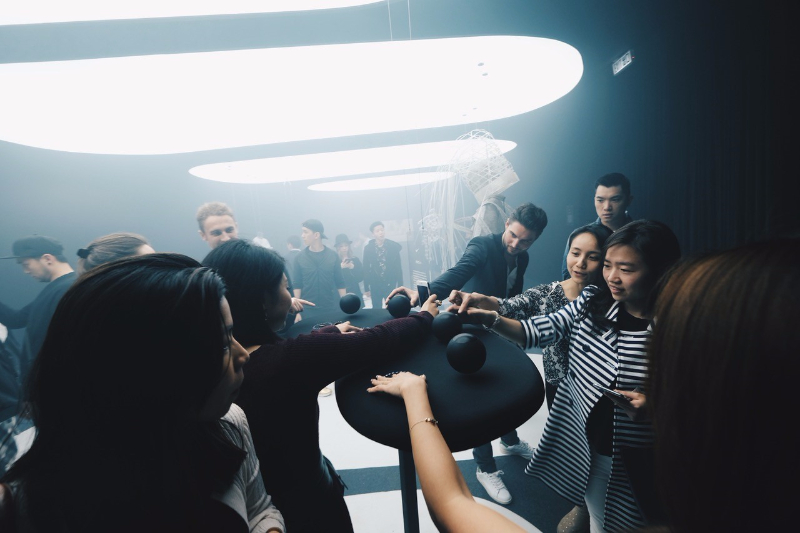
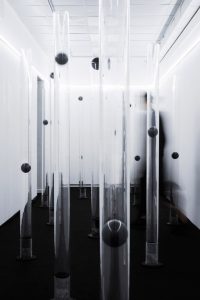
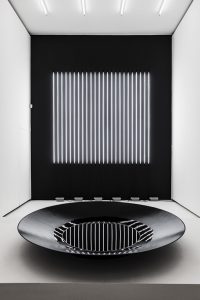
e Reflector Distortion project by Carsten Nicolai. What I find most interesting about this project is the way in which the computational aspect is not transcribed visually on a screen but rather through the subtle moves in the water dish.

The premises of this project stem from inputting sound into an algorithm that then associates that sound with a pattern and then outputs that sound in the source of a low frequency sound that replicates that pattern in the water basin.

(on the image above, the art piece is set in a white box room with clean, neon white lights as the only source of light. There was much detail put into the room alone to ensure that the cleanliness of the exhibit and sound distortions is exhibited well)

Rather than exhibiting the sound in the form of music, this project focuses on the frequency of sound as a basis of art. Enable to clearly visualize these changes in frequencies, the art piece uses a low black basin of water with a line of white neon lights mounted on the ceiling above the basin to reflect the lines in the basin and male the sound changes visible.

Exhibiting sound in the form of art is a very interesting track for visualizing what is not seen on the computer. The algorithms that were used to create this probably dealt along the lines of transcribing direct frequencies to points of a curve, then using an algorithm similar to what is used in Trapcode soundkeys to take those curves and based on the level of frequency, then exhibit that curve at a higher or lower visual mode.

(the image above shows a detail of the sound basin with the neon white light reflecting off the surface of the water in the dish)

Carsten Nicolai – reflektor distortion from studio carsten nicolai on Vimeo.

Sources:

http://carstennicolai.de/?c=works&w=reflektor_distortion

12 Sound Artists Changing Your Perception of Art

Austin Treu – Looking Outwards-04

Multiverse by fuse* is a fascinating project including both generative graphics and sound. It utilizes the Multiverse Theories of physicist Lee Smolin that say that universes create new universes as opposed to collapsing into singularity as inspiration in that a new ‘universe’ begins every thirty minutes and inherits certain attributes from its ‘parent universe’ and those before it. The synthesized sound and constantly changing visuals invoke a sense of wonder about the cosmos and what is really out there. The division and consolidation that happen on the display symbolize the constant change that the Multiverse goes through, which is an incredible visual representation of something outside of our human grasp of space-time. One of the most interesting parts of the project that goes on under the hood is a direct interaction between openFrameworks and Ableton Live, which means that the sound and visuals are actually generated in tandem with one another, so, while each ‘universe’ is unique, it has matching visuals and sound that would match again under the exact same conditions. I am not only impressed by the wild physics of the modern day, I am impressed by this fantastic representation of it.

The following video is a three minute demonstration of the project.

Sarah Yae Project 4 Section B


Project 4

//Sarah Yae
//Section B
//smyae@andrew.cmu.edu
//Project-04

function setup() {
    createCanvas(400, 300);
 }

function draw() {
    background(29,41,81);

 //variables
	var a = 0;
	var b = 0;
	var c = 0;
	var d = 0;
	var e = 0;
	var f = 0;
	var g = 0;
	var h = 0;
	var s = 10;
	var t = 10;
	var u = 10;
	var v = 10;
	var w = 10;
	var s1 = 10;
	var s2 = 10;
	var s3 = 10;
	var s4 = 10;
	var s5 = 10;
	var s6 = 10;
	var s7 = 10;
	var s8 = 10;
	var s9 = 10;
	var s10 = 10;


//Star 
	for (i = 0; i <= 38; i++) {
		fill ('Yellow');
		noStroke ();
		ellipse (s, 10, 5, 5);
		s += 10;
	}

	for (i = 0; i <= 38; i++) {
		fill ('Yellow');
		noStroke ();
		ellipse (t, 30, 5, 5);
		t += 10;
	}

	for (i = 0; i <= 38; i++) {
		fill ('Yellow');
		noStroke ();
		ellipse (u, 50, 5, 5);
		u += 10;
	}

	for (i = 0; i <= 38; i++) {
		fill ('Yellow');
		noStroke ();
		ellipse (v, 70, 5, 5);
		v += 10;
	}

	for (i = 0; i <= 38; i++) {
		fill ('Yellow');
		noStroke ();
		ellipse (w, 90, 5, 5);
		w += 10;
	}

	for (i = 0; i <= 38; i++) {
		fill ('Yellow');
		noStroke ();
		ellipse (s1, 110, 5, 5);
		s1 += 10;
	}

	for (i = 0; i <= 38; i++) {
		fill ('Yellow');
		noStroke ();
		ellipse (s2, 130, 5, 5);
		s2 += 10;
	}

	for (i = 0; i <= 38; i++) {
		fill ('Yellow');
		noStroke ();
		ellipse (s3, 150, 5, 5);
		s3 += 10;
	}

	for (i = 0; i <= 38; i++) {
		fill ('Yellow');
		noStroke ();
		ellipse (s4, 170, 5, 5);
		s4 += 10;
	}

	for (i = 0; i <= 38; i++) {
		fill ('Yellow');
		noStroke ();
		ellipse (s5, 190, 5, 5);
		s5 += 10;
	}

	for (i = 0; i <= 38; i++) {
		fill ('Yellow');
		noStroke ();
		ellipse (s6, 210, 5, 5);
		s6 += 10;
	}

	for (i = 0; i <= 38; i++) {
		fill ('Yellow');
		noStroke ();
		ellipse (s7, 230, 5, 5);
		s7 += 10;
	}

	for (i = 0; i <= 38; i++) {
		fill ('Yellow');
		noStroke ();
		ellipse (s8, 250, 5, 5);
		s8 += 10;
	}

	for (i = 0; i <= 38; i++) {
		fill ('Yellow');
		noStroke ()
		ellipse (s9, 270, 5, 5);
		s9 += 10;
	}
	
	for (i = 0; i <= 38; i++) {
		fill ('Yellow');
		noStroke ();
		ellipse (s10, 290, 5, 5);
		s10 += 10;
	}

//Salmon String Line 
	for (i = 0; i <= 100; i++) {
		stroke ('Salmon');
		strokeWeight (0.5);
		line (a, 0, 0, height-b);
		a += 10;
		b += 10;
	}

//Lavendar String Line
	for (i = 0; i <= 100; i++) {
		stroke (187,180,214);
		strokeWeight (0.5);
		line (width-c, 0, width, height-d);
		c += 10;
		d += 10;
	}

//Light Green String Line
	for (i = 0; i <= 100; i++) {
		stroke (191,228,118);
		strokeWeight (0.5);
		line (e, height, width, width-f);
		e += 10;
		f += 10;
	}

//Blue String Line 
	for (i = 0; i <= 100; i++) {
		stroke (148,168,208);
		strokeWeight (0.5);
		line (height-g, height, 0, height-h);
		g += 10;
		h += 10;
	}
}

This project reflects a concept of the outer space; the circles represent stars, and the strings are almost like the different dimensions of the space. I had fun making art out of the loop function!

Austin Treu – Project 04 – String Art

atreu – project04

//Austin Treu
//atreu
//Project 04
//Section C

var x1, y1, x2, y2;

function setup() {
    createCanvas(400, 300);
    background(0);

    //for loop to generate points and draw lines
    for(var i = 0; i < 100; i++){
        //new points
        x1 = lerp(width,0, i/100);
        y1 = lerp(0,height, i/100);
        x2 = lerp(0,width, i/50);
        y2 = lerp(height,0, i/50);
        //draw red lines
        stroke(255, 0, 50);
        line(x1, height/i, 0, y1);
        line(width-x1, height/i, width,y1);

        //generate points
        x1 = lerp(width/2,0, i/100);
        y1 = lerp(height/2,0, i/100);
        x2 = lerp(width/2,0, i/50);
        y2 = lerp(height,0, i/50);
        //draw blue lines
        stroke(50, 0, 255);
        line(x1, y1, x2, y2);
        line(x2, y1, x1, y2);
        line(width-x1, y1, width-x2, y2);
        line(width-x2, y1, width-x1, y2)

        //generate new points
        x1 = lerp(width/i,width, i/100);
        y1 = lerp(height/i,height, i/100);
        x2 = lerp(0,width, i/75);
        y2 = lerp(0,height, i/75);
        //draw yellow lines
        stroke(175, 150, 0);
        line(x2, y2, x1, height);
        line(width-x2, y2, width-x1, height);

        //new points
        x1 = lerp(0,width/2, i/100);
        y1 = lerp(0,height/2, i/100);
        x2 = lerp(0,width-width/7.5, i/200);
        y2 = lerp(0,height/2, i/200);
        //draw green lines
        stroke(0, 255, 150);
        line(x2, y2, x1, y1);
        line(width-x2, y2, width-x1, y1);
    }
}

Learning how to properly utilize lerp() was an interesting process to experiment with, as it offered a huge variety of different options once I understood. I spent the time I worked on this completely focused on making it symmetrical, which changed my focus throughout the project.

Victoria Reiter – Looking Outwards – 04

Vapor-Space creates an interactive Soundscape that reacts to data collected from the human body

People place their fingers on sensors to collect biological data from their skin


Vapor-Space is an interactive soundspace installation, whose name reflects how the data which feeds the soundscape is collected. Soundscape collects data on the humidity of the room, the temperature of the participant’s skin which touches the sensor, and calculates a vaporization rate which is translated into sound.

The creators at Vapor-Space highlight that the micro-workings of the body are themselves “an orchestra,” so in a way their soundscape seeks to amplify this symphony to a degree audible to the human ear.

What interests me about this project is how it brings together two seemingly opposing elements– electronics and water (hahaha if you ever drop your phone in the toilet or drop a hairdryer in the bathtub while you’re in it you’d understand)– and makes them collaborate together to create the sound.


Video demonstrates the use of Vapor-Space


Full information available here.

Shirley Chen – Project 04 – String Art

sketch

// Shirley Chen
// Section B
// junfanc@andrew.cmu.edu
// Project-04


function setup() {
    createCanvas(400, 300);
    background(244, 217, 166);

}

function draw() {
    var x1 = 0;
    var y1 = 0;
    var x2 = 0;
    var x3 = 0;
    var y3 = 0;

    strokeWeight(1);
    //Draw the blue lines at the bottom left corner
    for (var i = 0; i < 50; i++){
        y1 += 4;
        x1 += 8;
        stroke(166, 188, 201);
        line(0, y1, x1, height);
    }
    //Draw the yellow and pink lines at the upper left and right corner
    for (var i = 0; i < 50; i++){
        x2 += 20;
        x3 += 5;
        y3 += 5;
        stroke(242, 143, 143);
        line(400, 0, x2, height);
        stroke(255, 191, 62);
        line(x3, 0, x3, y3);
    }
    strokeWeight(1);
    stroke(86, 42, 42);
    //Draw lines between points along the circles to create eyes
    for(var i = 0; i < 360; i += 10){
        line( width * 0.2 + 20 * cos(radians(i)), 
              height * 0.4 - 20 * sin(radians(i)),
              width * 0.2 - 20 * cos(radians(i)),
              height * 0.4 - 20 * sin(radians(i)));
    }
    for(var i = 0; i < 360; i += 10){
        line( width * 0.5 + 20 * cos(radians(i)), 
              height * 0.4 - 20 * sin(radians(i)),
              width * 0.5 - 20 * cos(radians(i)),
              height * 0.4 - 20 * sin(radians(i)));
    }
    stroke(0);
    for(var i = 0; i < 360; i += 10){
        line( width * 0.2 + 5 * cos(radians(i)), 
              height * 0.4 - 5 * sin(radians(i)),
              width * 0.2 - 5 * cos(radians(i)),
              height * 0.4 - 5 * sin(radians(i)));
    }
    for(var i = 0; i < 360; i += 10){
        line( width * 0.5 + 5 * cos(radians(i)), 
              height * 0.4 - 5 * sin(radians(i)),
              width * 0.5 - 5 * cos(radians(i)),
              height * 0.4 - 5 * sin(radians(i)));
    }
    strokeWeight(2);
    stroke(214, 29, 29);
    //Draw the mouth by connectiing points on the ellipse
    for(var i = 0; i < 360; i += 10){
        line( width / 2.5 + 30 * cos(radians(i)), 
              height / 1.5 - 30 * sin(radians(i)),
              width / 3.5 - 30 * cos(radians(i)),
              height/ 1.5 - 30 * sin(radians(i)));
    }
}

For this project, I use the “for” loop to map out all the points on different lines and connect them together. When I drew the circles that are constructed by lines, I need to use cos and sine to calculate each point on the circle and then connect them together. The circles eventually form a face. Overall, I feel comfortable with the looping function.

Looking Outwards-04 Sound Art-Veronica Wang

CARBONSCAPE, the latest kinetic data soundscape installation by h0nh1m aka chris cheung from designboom on Vimeo.

CarbonScape is a kinetic soundscape installation created by Chris Cheung. It consists of 18 tracks of granular synthesized sound samples. They are collected from the sound sources where carbon footprints left: the sound from the jet engine, steam from the factory and horn of the ship, etc… The finale is composed of all tracks blending into the soundscape.

Interactive installation

The installation is a visualization of CO2 levels arranged in a bamboo forest like landscape, with the changing ambiance drone noises, imitates chimneys frequently found in power plants and factories, with black spheres indicating CO2 levels around the globe.

Sound data incorporated with the exhibition