/*
Jamie Dorst
jdorst@andrew.cmu.edu
Section A
Project-07
*/

function setup() {
    createCanvas(480, 480);
}

function draw() {
    background(0);
    stroke(255);
    noFill();
    // draw graph lines
    strokeWeight(0.25);
    line(width / 2, 0, width / 2, height);
    line(0, height / 2, width, height / 2);
    // move to center of canvas
    translate(width / 2, height / 2);
    // draw graph
    strokeWeight(1);
    epispiral();
}

function epispiral() {
    var nPoints = 1000;
    var r;
    // constrain mouseX and Y to canvas borders
    // multiply to give bigger range
    var a = 20 * constrain((mouseX / width), 0, 1);
    var n = 5 * constrain((mouseY / height), 0, 1);
    /*var a = 1
    var n = 6*/
    var theta;
    var x;
    var y;

    beginShape();
    for (var i = 0; i < nPoints; i++) {
        // theta goes from 0 to two pi
        theta = map(i, 0, nPoints, 0, TWO_PI);
        // function
        r = a / cos(n * theta);
        // compute x and y
        x = r * cos(theta);
        y = r * sin(theta);
        // draw points until end shape
        vertex(x, y);
    }
    endShape();
}
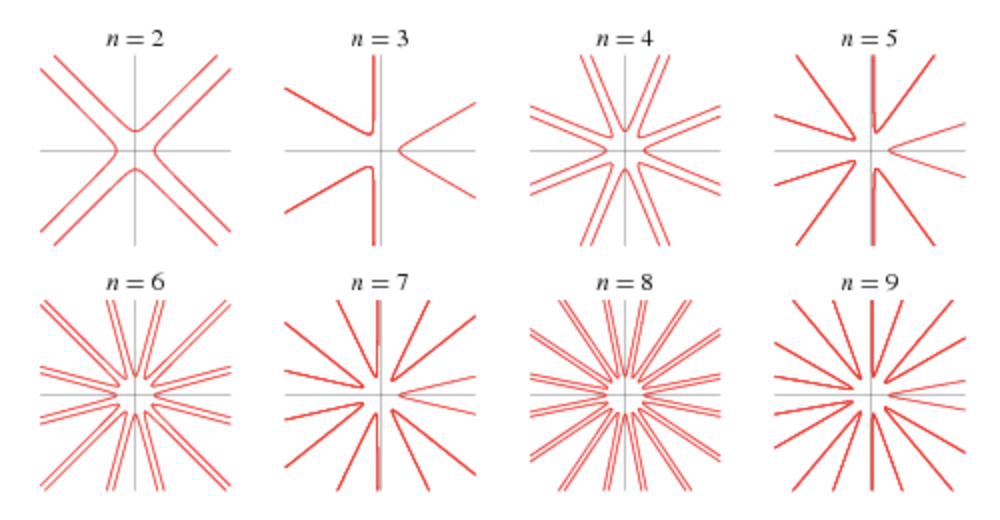
For this project I chose to develop the epispiral. I really liked that this curve was open and that I had two variables I could make attached to mouseX and Y. MouseX controls how far from the center of the graph it starts, and mouseY controls n, how many “branches” there are. I think it’s really interesting to look at, especially in it’s primitive forms when it is just a circle and something that reminds me of the golden ratio.

I had trouble getting started on this project, but once I figured out beginShape and endShape and examined the sample code some more, I got the hang of it. I really like how it turned out because you can see the in-betweens of these stages that Wolfram gave. You can see the lines getting longer from the center before they actually turn into this shape and I think it’s cool that you can visualize it like this and get a better idea of what’s going on behind the pictures.
![[OLD FALL 2018] 15-104 • Introduction to Computing for Creative Practice](wp-content/uploads/2020/08/stop-banner.png)