function setup() {
  createCanvas(400, 400);
}

function draw() {
  background(0);
  fill(186, 85, 211, 100);
  strokeWeight(.25);
  stroke('black');
  drawHypocycloid();
}

function drawHypocycloid() {
  var x;
  var y;
  var theta;
  var nPoints = map(mouseY, 0, height, 50, 100);

  beginShape();

  for (var i = 0; i < nPoints; i++) {

    push();

    var a = map(mouseX, 0, width, 0, 50);
    var n = map(mouseY, 0, height, 0, 200);
    var d = map(mouseX, 0, width, 10, 20);

    theta = i;

    x = ((a / n) * (n - 1)*cos(theta)) - (d*(cos((n-1)*theta)));
    y = ((a / n) * (n - 1)*sin(theta)) + (d*(sin((n-1)*theta)));

    vertex(x + width/2, y + height/2);
    pop();
  }

  endShape(CLOSE);

  beginShape();

  for (var i = 0; i < nPoints; i++) {

    push();

    var a = map(mouseX, 0, width, 100, 0);
    var n = map(mouseY, 0, height, 400, 0);
    var d = map(mouseX, 0, width, 10, 20);

    theta = i;

    x = ((a / n) * (n - 1)*cos(theta)) - (d*(cos((n-1)*theta)));
    y = ((a / n) * (n - 1)*sin(theta)) + (d*(sin((n-1)*theta)));
    vertex(x + width/2, y + height/2);

    pop();
  }
  endShape(CLOSE);

  beginShape();

  for (var i = 0; i < nPoints; i++) {

    push();

    var a = map(mouseX, 0, width, 0, 100);
    var n = map(mouseY, 0, height, 0, 400);
    var d = map(mouseX, 0, width, 10, 20);

    theta = i;

    x = ((a / n) * (n - 1)*cos(theta)) - (d*(cos((n-1)*theta)));
    y = ((a / n) * (n - 1)*sin(theta)) + (d*(sin((n-1)*theta)));

    vertex(x + width/2, y + height/2);
    pop();
  }

  endShape(CLOSE);
}
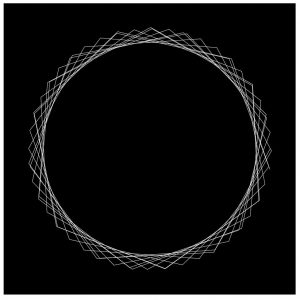
For this project, I focused on the hypocycloid curve. 
http://mathworld.wolfram.com/Hypocycloid.html
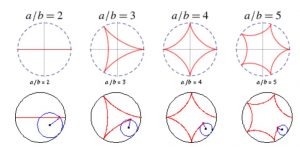
The hypocycloid is based on the idea of a circle, of smaller radius, rolling along the inside of a larger circle, with a point drawing it’s curve throughout the rotation. For my project I first began exploring variations based on the number of points and how adding different variables to the equation could influence it’s shape.

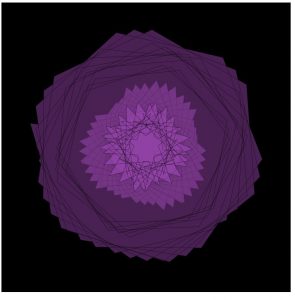
I then began playing around graphically, adding in 3 layers of these hypocycloid curves, and filling in the curves, to almost recreate a flower in bloom. It’s quite interesting to me how these circles are proportional to one another but act quite differently at certain points in the canvas.

I added in the d variable, which creates even more variation, based on the Astroid curve, http://mathworld.wolfram.com/Astroid.html, which is a type of hypocycloid.
![[OLD FALL 2018] 15-104 • Introduction to Computing for Creative Practice](wp-content/uploads/2020/08/stop-banner.png)